. 2018 Nov;15(11):969-976.
doi: 10.1038/s41592-018-0186-9. Epub 2018 Oct 30.

A light-gated potassium channel for sustained neuronal inhibition

Affiliations

A light-gated potassium channel for sustained neuronal inhibition

Laura Alberio et al. Nat Methods. 2018 Nov.

Abstract

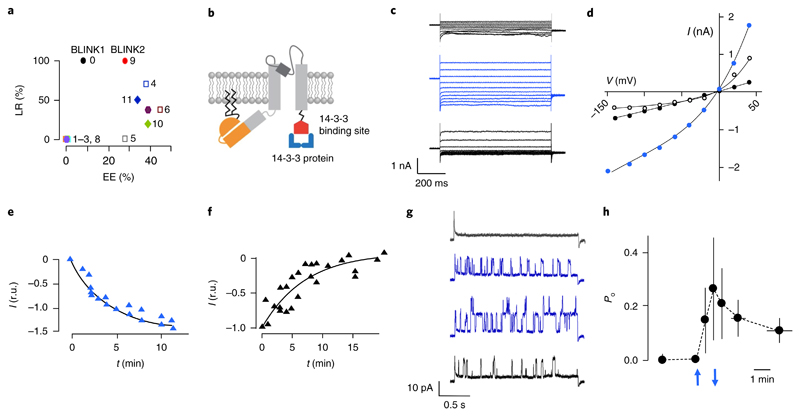
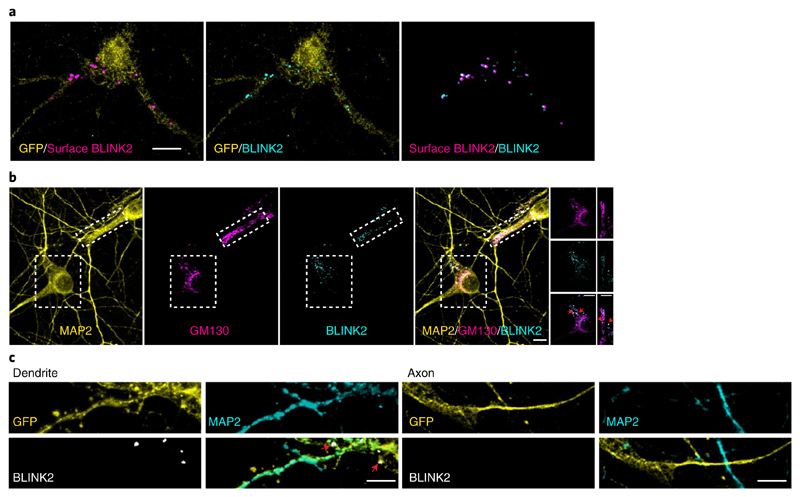
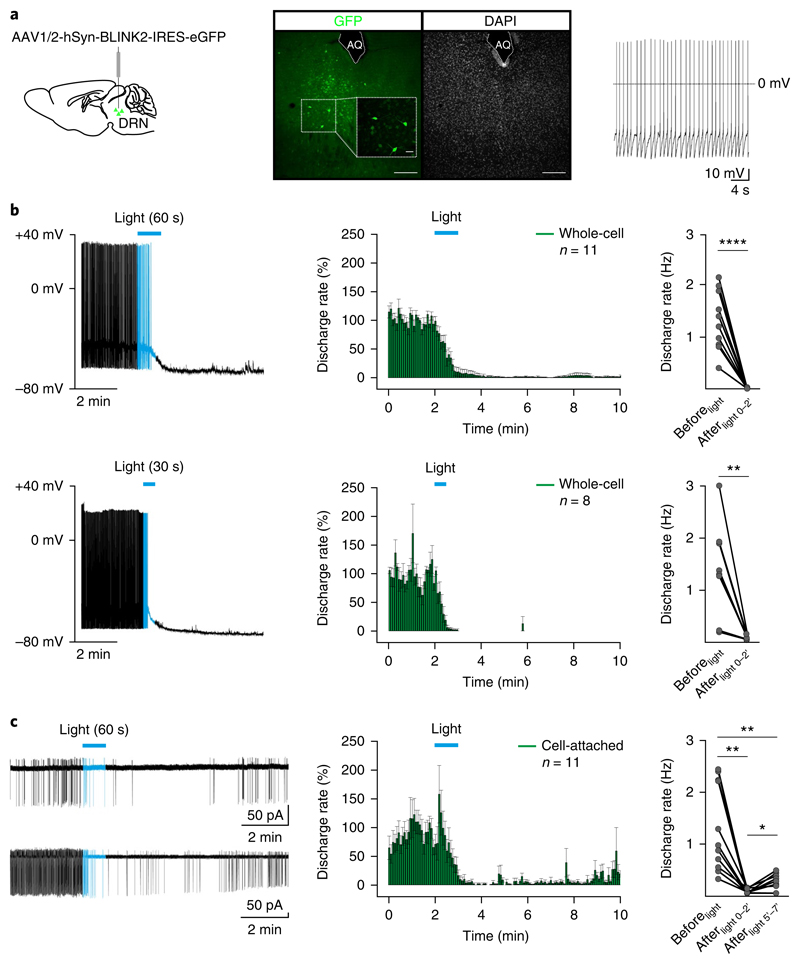
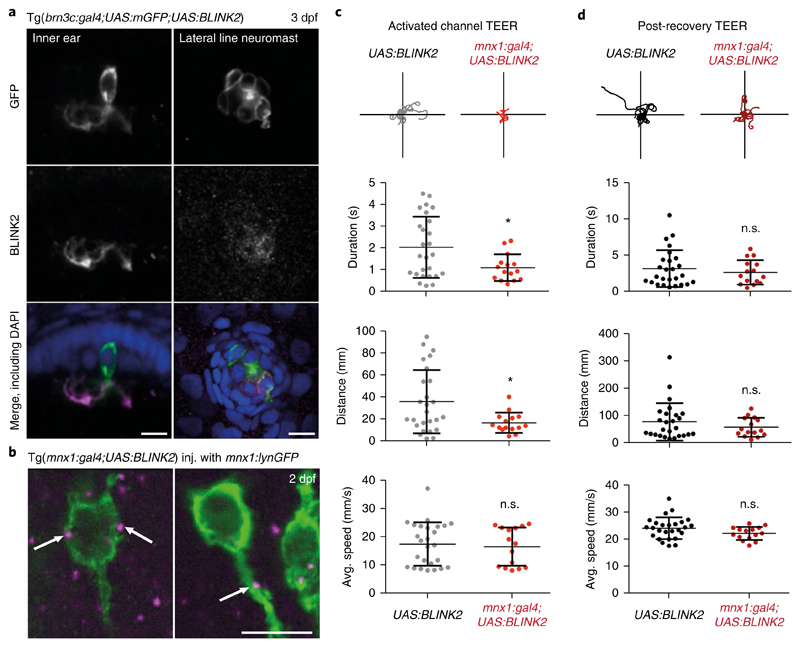
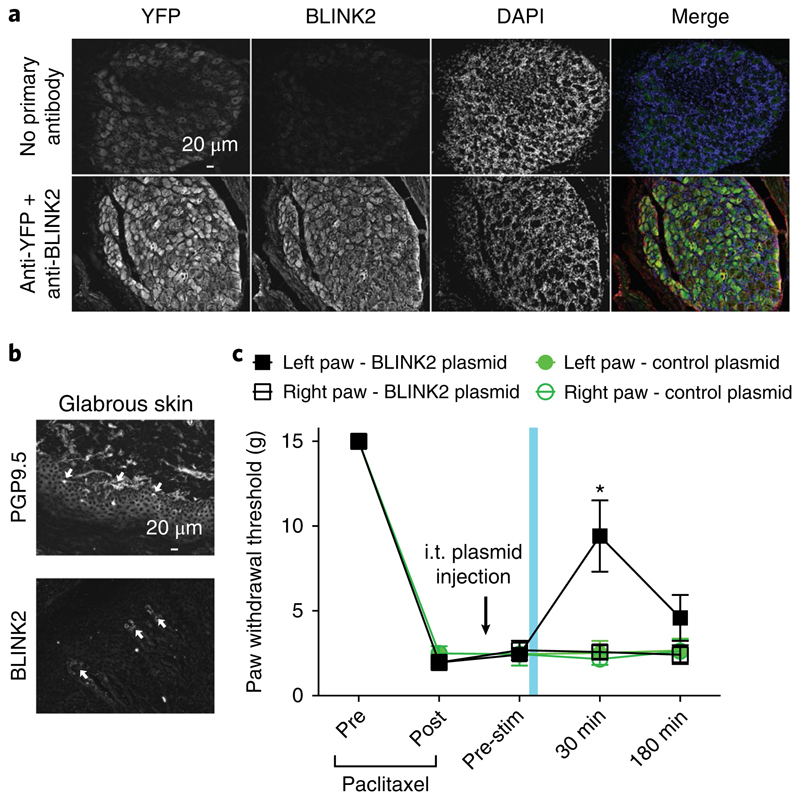
Currently available inhibitory optogenetic tools provide short and transient silencing of neurons, but they cannot provide long-lasting inhibition because of the requirement for high light intensities. Here we present an optimized blue-light-sensitive synthetic potassium channel, BLINK2, which showed good expression in neurons in three species. The channel is activated by illumination with low doses of blue light, and in our experiments it remained active over (tens of) minutes in the dark after the illumination was stopped. This activation caused long periods of inhibition of neuronal firing in ex vivo recordings of mouse neurons and impaired motor neuron response in zebrafish in vivo. As a proof-of-concept application, we demonstrated that in a freely moving rat model of neuropathic pain, the activation of a small number of BLINK2 channels caused a long-lasting (>30 min) reduction in pain sensation.


Conflict of interest statement

Competing interests

The authors declare no competing interests

Figures

Fig. 1
Fig. 1. Engineering and characterization of BLINK2.
a, Surface expression and light regulation of BLINK1 derivatives. Expression efficiency (EE) was defined as the percentage of cells with measurable BLINK1-like current. Light regulation (LR) represents the percentage of cells that did not show dark current. Clones are numbered according to Supplementary Table 1. b, Cartoon representation of BLINK2 showing the KcvPBCV1channel (gray), LOV2 domain (orange), N-terminal myristoylation and palmitoylation sites (zigzagging black lines) and a fragment of Arabidopsis thaliana KAT1 protein (GenBank AED95356.1) (red) for binding of 14-3-3 proteins (blue). c, Whole-cell recordings from a COS7 cell transfected with BLINK2 in response to voltage steps from +60 to –140 mV in the dark (top black traces), 5 min after the start of blue light illumination (blue traces) and 5 min after returning to darkness (bottom black traces). Similar results were obtained in n=9 cells from 10 independent experiments. d, I/V relationship from measurements in c in the dark (black solid circles), in blue light (blue circles) and after a return to dark conditions (open black circles). e,f, Activation kinetics of BLINK2 current in blue light (e) and after deactivation in the dark (f). Currents were recorded at –100 mV and normalized to t = 5 and t = 0 min for activation and deactivation, respectively (r.u., relative units). Data were fitted with a single exponential (solid line). g, Single-channel recordings from cell-attached measurement of BLINK2 in COS7 cells. The traces show the current response to a voltage step from 0 mV to+40 mV in a dark-adapted cell (top black trace), after 1.5 and 2 min of blue light (blue traces) and 1 min after turning the light off (bottom black trace). Similar results were obtained in n=4 cells from 4 independent experiments. h, Open probability (Po) changes of BLINK2 single channels in response to dark/light transitions. Recordings were done at + 40mV in the cell-attached configuration. Blue arrows indicate the time of light on (upward-facing arrow) and light off (downward-facing arrow). Data shown are the mean ± s.d. of the time at which measurements were performed in 4 experiments. In all experiments reported in this figure, the blue light (455 nm) intensity was 90 μW/mm2.
Fig. 2
Fig. 2. BLINK2 expression in rat hippocampal neurons.
a, BLINK2 expression. Left, BLINK2 at the cell surface (magenta). Center, total BLINK2 (turquoise). Right, merged image. GFP is shown in yellow. Scale bar, 10 μm. Similar results were obtained in n= 27cells from 3 independent experiments. b, From left to right, staining for MAP2, Golgi marker GM130 (magenta) and BLINK2 (turquoise), and merged images. The rightmost images are cropped views of the regions outlined by boxes in the other images in the row; red arrowheads indicate colocalization between BLINK2 and GM130. Scale bars, 10 μm. Similar results were obtained in n=15 cells from 3 independent experiments. c, GFP (yellow), MAP2 (turquoise) and BLINK2 (white) in dendrites (MAP2+) and axons (MAP2). Scale bars, 5 μm. Similar results were observed in n=16 cells from 3 independent experiments. All images were acquired from cultured rat hippocampal neurons infected with AAV1/2-hSyn-BLINK2-IRES-eGFP. Neurons in c were also transfected with a GFP expression plasmid.
Fig. 3
Fig. 3. BLINK2-mediated silencing of tonic firing activity in mouse DRN neurons.
a, Left, diagram indicating the virus injection site. Middle, sample confocal image showing expression of the AAV1/2-hSyn-BLINK2-IRES-eGFP virus in the mouse DRN (green, GFP; gray, DAPI). Scale bars, 200 μm or 40 μm (inset). AQ, aqueduct. n = 21 mice. Right, representative (n = 19 from 11 mice) current-clamp recording of tonic firing activity in DRN GFP+ neurons. b, Left, representative whole-cell current-clamp recordings of the firing response before and after 60 s (top) and 30 s (bottom) of blue light stimulation (duration indicated by horizontal blue bars) (top, n = 11 independent recordings in 5 mice; bottom, n = 8 independent recordings in 6 mice). Middle, time course of the effect of 60 s (top) and 30 s (bottom) of blue light stimulation (blue bar) on the firing discharge rate (5-s binning). Right, summary plots indicating the mean firing discharge rate 2 min before light (Beforelight; baseline) and 2 min after light-off (Afterlight 0–2′) (60 s, Beforelight versus Afterlight 0–2′, n = 11, P < 0.0001, t = 7.9, df = 10, two-sided paired t-test; 30 s, Beforelight versus Afterlight 0–2′, n = 8, P = 0.004, t = 4.2, df = 7, two-sided paired t-test). c, Left, representative cell-attached voltage-clamp recordings of firing responses before and after 60 s of blue light stimulation (blue bar) (n = 11 independent recordings; n = 10 mice). Middle, time course of the effect of 60 s of blue light stimulation (blue bar) on the firing discharge rate (5-s binning). Right, summary plot indicating the mean firing discharge rate 2 min before light (Beforelight) and at 2 (Afterlight 0–2′) and 5 (Afterlight 5′–7′) min after the end of light exposure (n = 11; repeated measures one-way ANOVA, F10,2 = 22, P = 0.0007; post hoc, Beforelight versus Afterlight 0–2′, P = 0.002; Beforelight versus Afterlight 5′–7′, P = 0.003; Afterlight 0–2′ versus Afterlight 5′–7′, P = 0.02; multiple comparison and Tukey’s P value correction) (*P < 0.05, **P < 0.01, ****P < 0.0001). Data in time course plots are presented as mean ± s.e.m. Blue light was delivered through the microscope objective (40× at 470 nm, 8.7 mW/mm2).
Fig. 4
Fig. 4. BLINK2 expression and functional silencing in zebrafish.
a, Left, immunohistochemistry in 3-dpf (days post-fertilization) embryos, showing a hair cell of the inner ear labeled for membrane-targeted GFP (green in the merged image) and the BLINK2 channel (magenta in the merged image), both expressed under the control of brn3c:gal4. Right, neuromast cells from the same Tg(brn3c:gal4;UAS:mGFP) line labeled in the same way. Embryos were counterstained with DAPI (blue). Scale bars, 10 μm. Similar results were obtained in 3 independent experiments. b, Immunohistochemistry on whole 2-dpf embryos showing cell bodies and part of the axons of primary motor neurons stained by membrane-targeted GFP (green) and BLINK2 (magenta). White arrows indicate BLINK2 immunoreactivity at the plasma membrane and axonal tract. Genotypes are as indicated. GFP was expressed in subsets of motor neurons only. Scale bars, 10 μm. Similar results were obtained in 3 independent experiments. c, Touch-evoked escape response assay (TEER) in Tg(mnx1:gal4;UAS:BLINK2) and Tg(UAS:BLINK2) embryos. Embryos were assayed after a 20-min activation of the channel with blue light. Swim duration, distance and average speed were 2.03 ± 0.28 s, 35.80 ± 5.65 mm and 17.49 ± 1.50 mm/s, respectively, in control animals and 1.10 ± 0.16 s, 16.62 ± 2.38 mm and 16.60 ± 1.75 mm/s in BLINK2-expressing animals. Traces for 10 escape episodes are shown for each condition. n = 26 larvae for Tg(UAS:BLINK2) and n = 15 larvae for Tg(mnx1:gal4;UAS:BLINK2). Data are presented as the average (center line) ± s.d.; P values are, respectively, 0.019, 0.017 and 0.071. d, TEER assay in the same animals as in c after 1 h of rest in the dark. Swim duration, distance and average speed were 3.18 ± 0.50 s, 77.12 ± 13.42 mm and 24.03 ± 0.79 mm/s, respectively, in control animals and 2.67 ± 0.44 s, 57.03 ± 8.90 mm and 22.08 ± 0.63 mm/s in BLINK2-expressing animals. P values are, respectively, 0.48, 0.29 and 0.099. *P ≤ 0.05 (two-sided t-test). n.s., not significant.
Fig. 5
Fig. 5. BLINK2-mediated reversal of chemotherapy-induced neuropathic pain in rats.
a, Fluorescent micrographs of 12-μm sections of adult dorsal root ganglia from animals that received intrathecal (i.t.) injection of BLINK2–YFP expression plasmid, immunostained 24 h after injection for YFP and BLINK2 (bottom row). In the images in the top row, no primary antibody control was used to visualize YFP fluorescence. Presented data are from three independent animals that yielded similar results. b, Fluorescent micrographs of 12-μm sections of glabrous skin from animals that received i.t. injection of BLINK2–YFP expression plasmid, immunostained 24 h after injection for PGP9.5 (nerve terminals) or BLINK2. White arrows indicate the nerve terminals in the glabrous skin stained with PGP9.5 or BLINK2. Presented data are from three independent animals that yielded similar results. c, Paw withdrawal thresholds for rats with chemotherapy-induced neuropathic pain (paclitaxel) and i.t. injection of BLINK2 plasmid (4.5 μg per rat; n = 6). Blue light illumination was applied for 1 min to the left paw only. *P < 0.05 for the left paw compared with the right paw. P = 0.0001 (two-way ANOVA with Student–Neuman–Kuels post hoc test). Data were analyzed by nonparametric two-way ANOVA, where time was the within-subject factor and treatment was the between-subjects factor. Data are presented as the average ± s.e.m.

Comment in

  • Anna Moroni.
    Marx V. Marx V. Nat Methods. 2018 Nov;15(11):841. doi: 10.1038/s41592-018-0192-y. Nat Methods. 2018. PMID: 30377370 No abstract available.
  • Two-component optogenetic inhibition.
    Vogt N. Vogt N. Nat Methods. 2019 Jan;16(1):26. doi: 10.1038/s41592-018-0285-7. Nat Methods. 2019. PMID: 30573828 No abstract available.

Similar articles

Cited by

References

    1. Han X, Boyden ES. Multiple-color optical activation, silencing, and desynchronization of neural activity, with single-spike temporal resolution. PLoS One. 2007;2:e299. - PMC - PubMed
    1. Chow BY, et al. High-performance genetically targetable optical neural silencing by light-driven proton pumps. Nature. 2010;463:98–102. - PMC - PubMed
    1. Zhang F, et al. Multimodal fast optical interrogation of neural circuitry. Nature. 2007;446:633–639. - PubMed
    1. Chuong AS, et al. Noninvasive optical inhibition with a red-shifted microbial rhodopsin. Nat Neurosci. 2014;17:1123–1129. - PMC - PubMed
    1. Wietek J, et al. Conversion of channelrhodopsin into a light-gated chloride channel. Science. 2014;344:409–412. - PubMed

Publication types

MeSH terms

Supplementary concepts