

Effects of tumor grade and dexamethasone on myeloid cells in patients with glioma
- PMID: 30377570
- PMCID: PMC6204983
- DOI: 10.1080/2162402X.2018.1507668
Effects of tumor grade and dexamethasone on myeloid cells in patients with glioma
Abstract
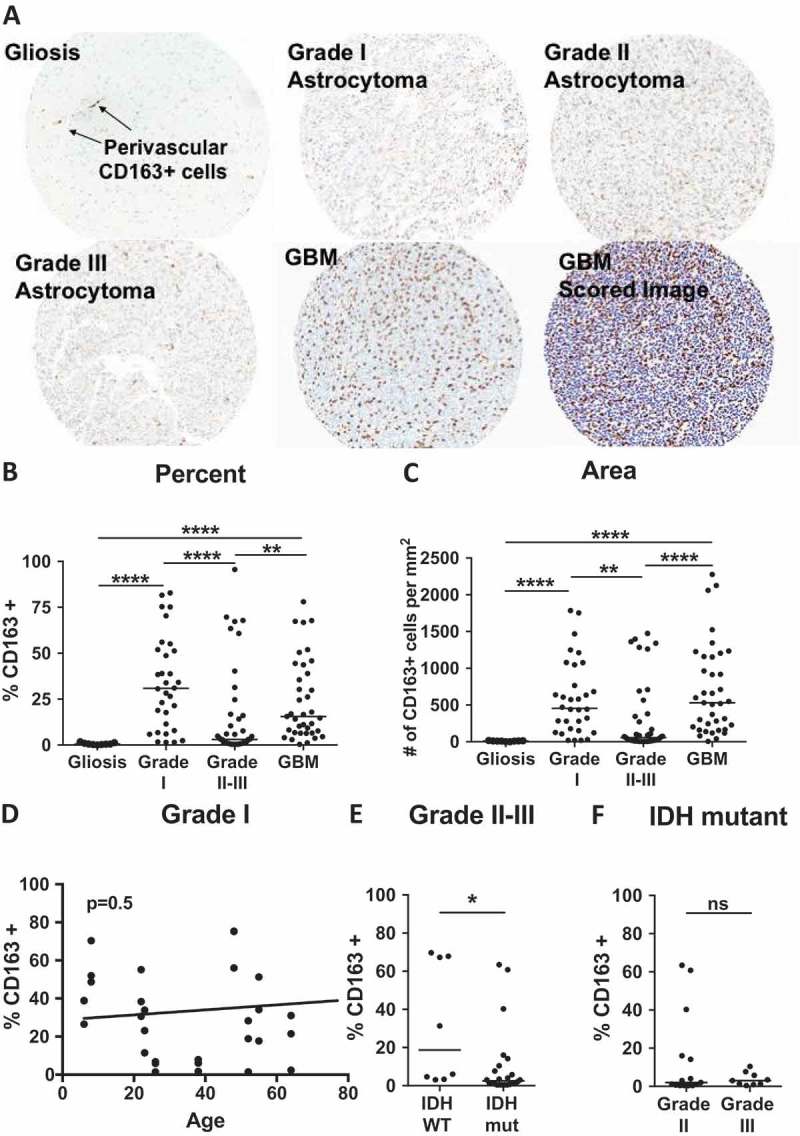
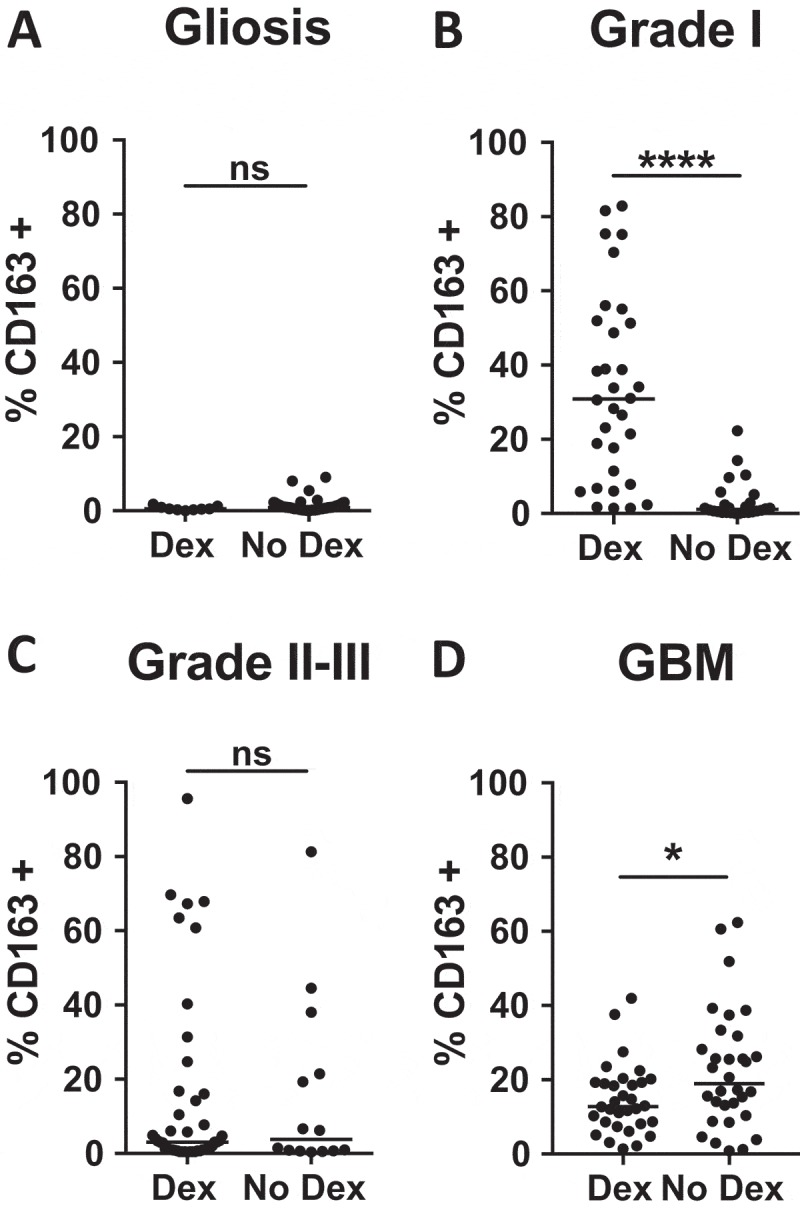
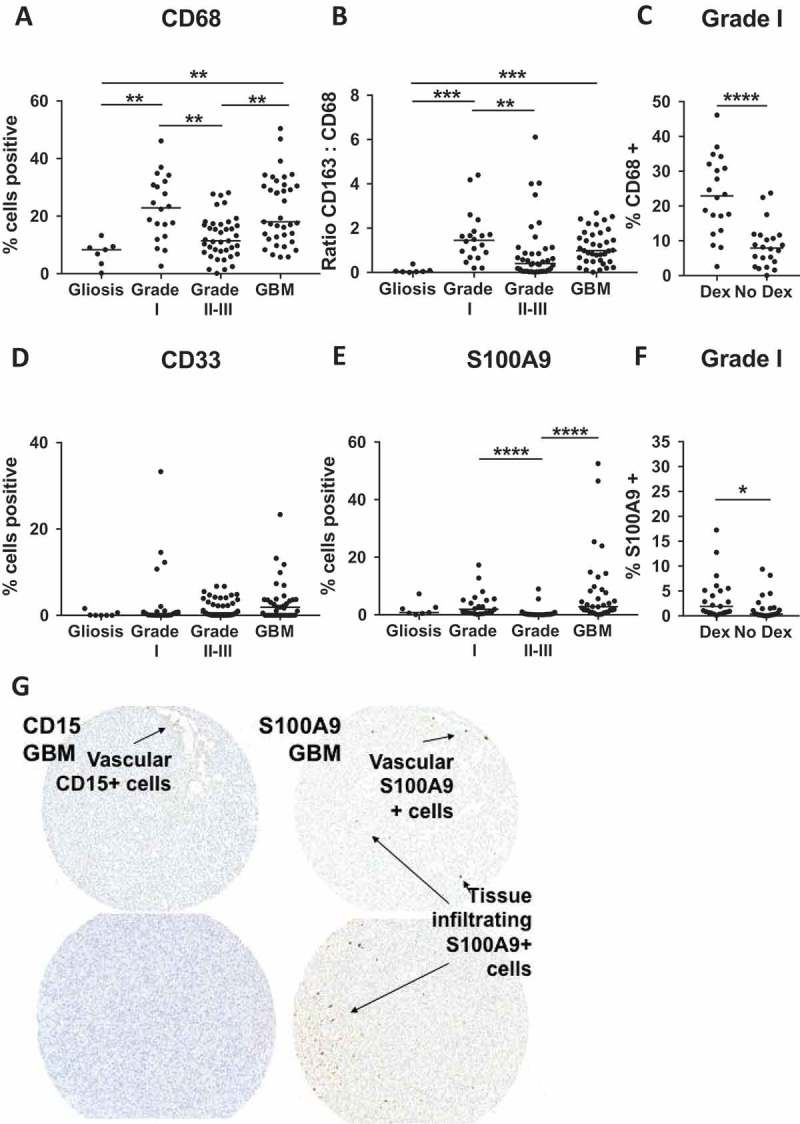
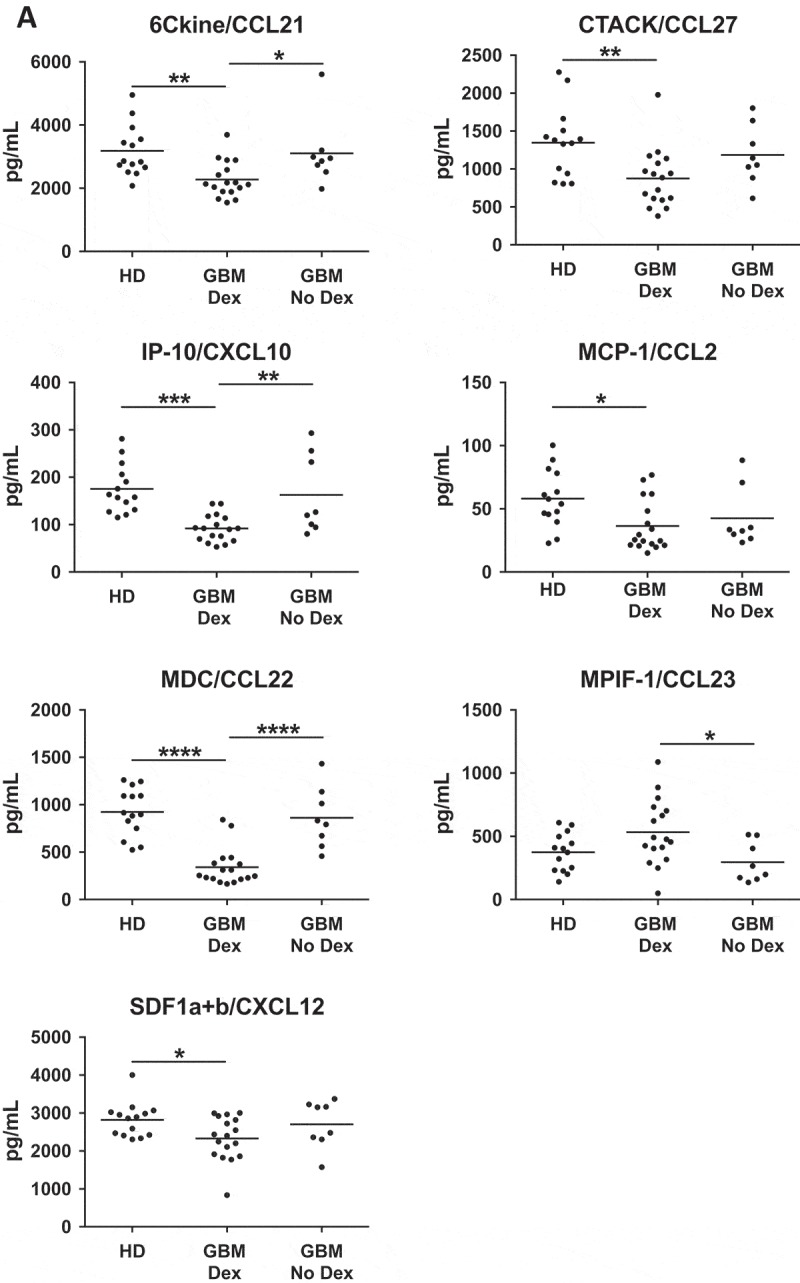
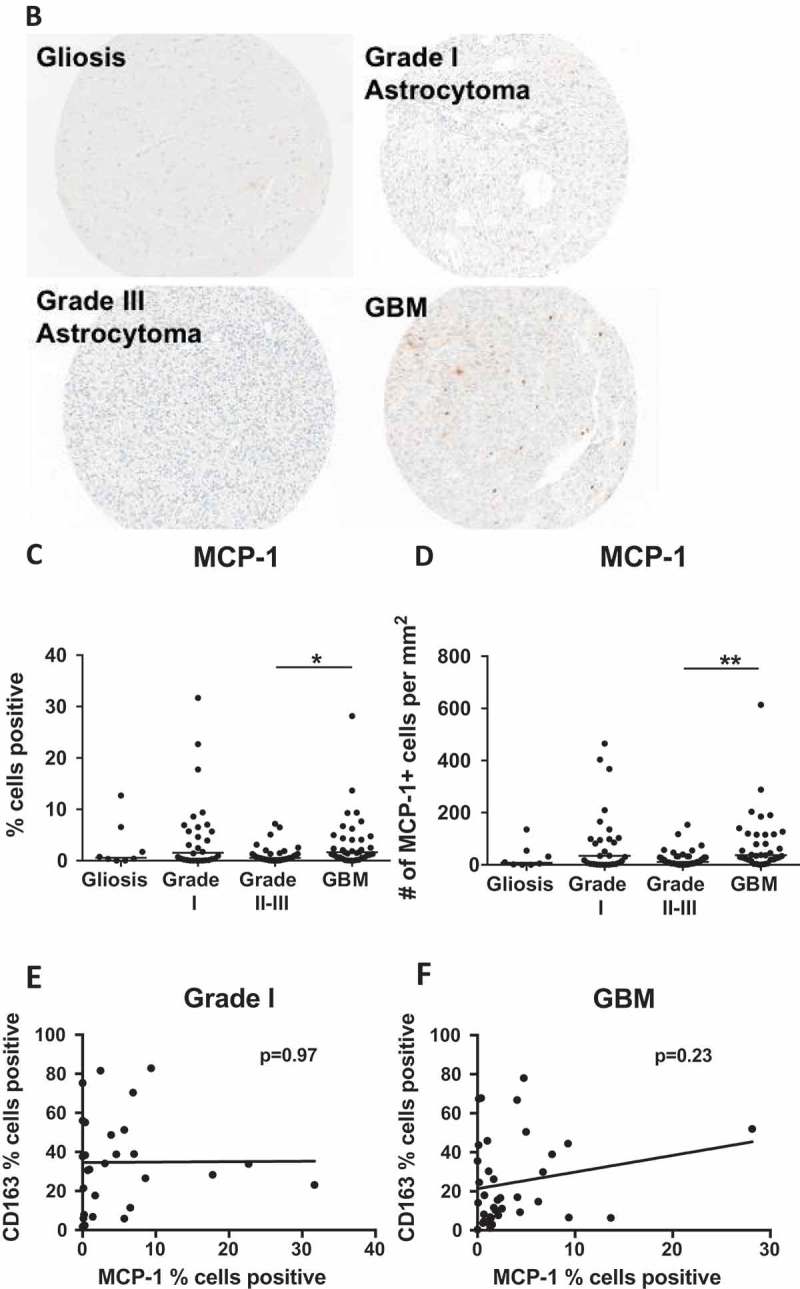
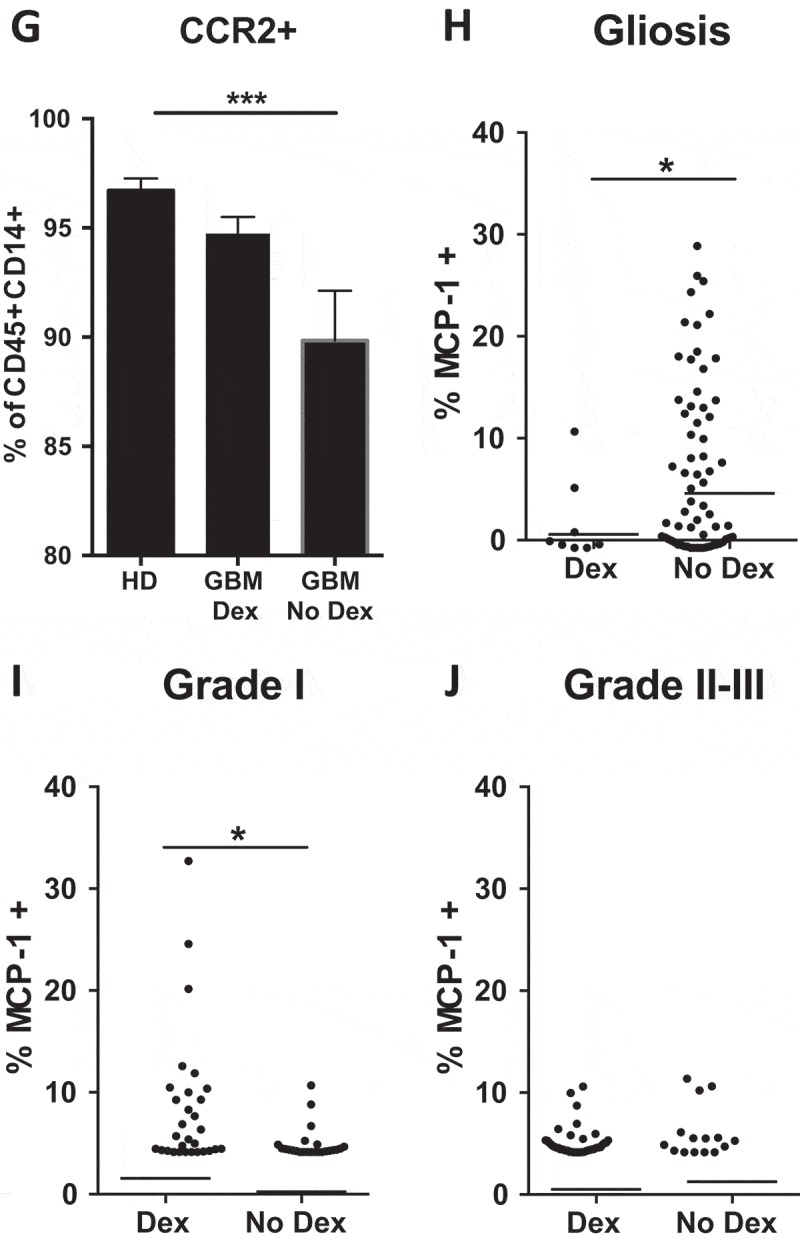
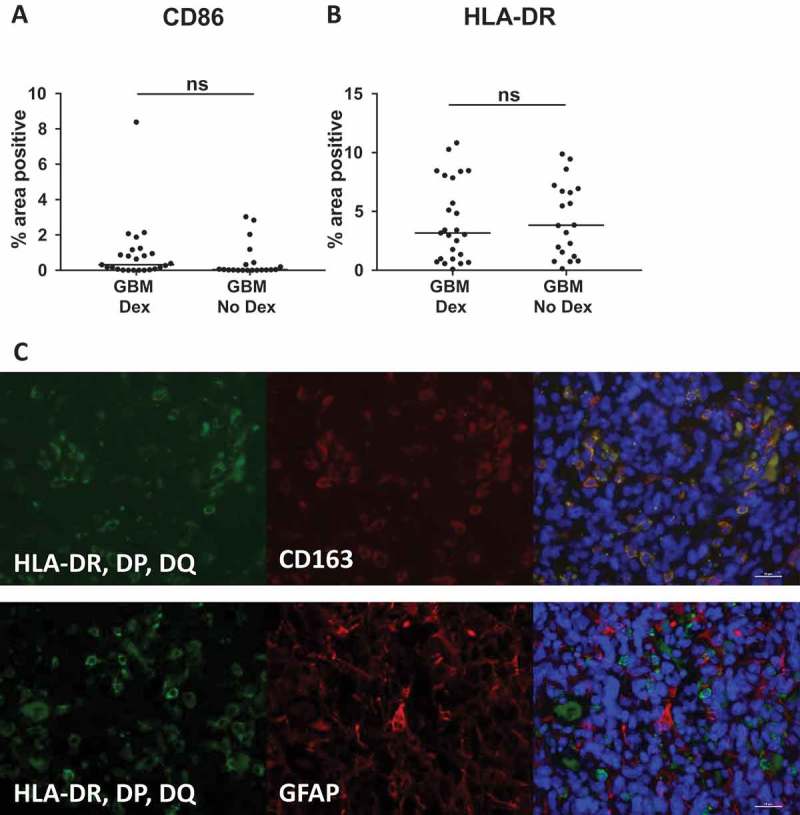
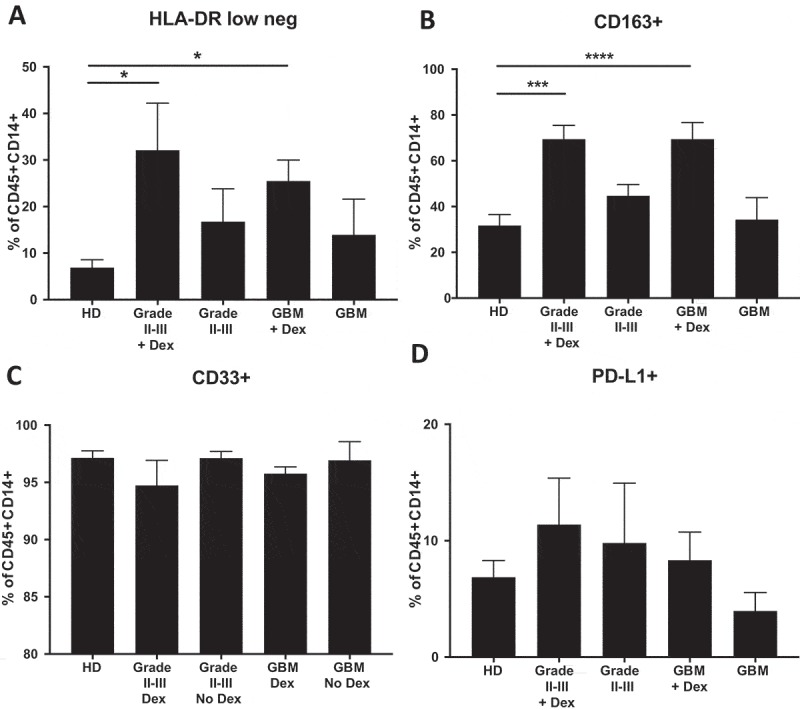
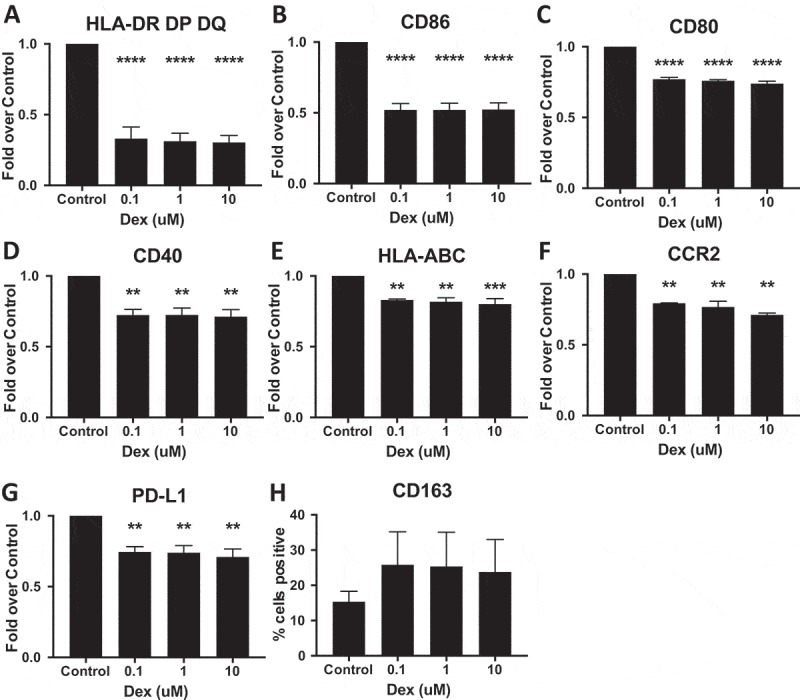
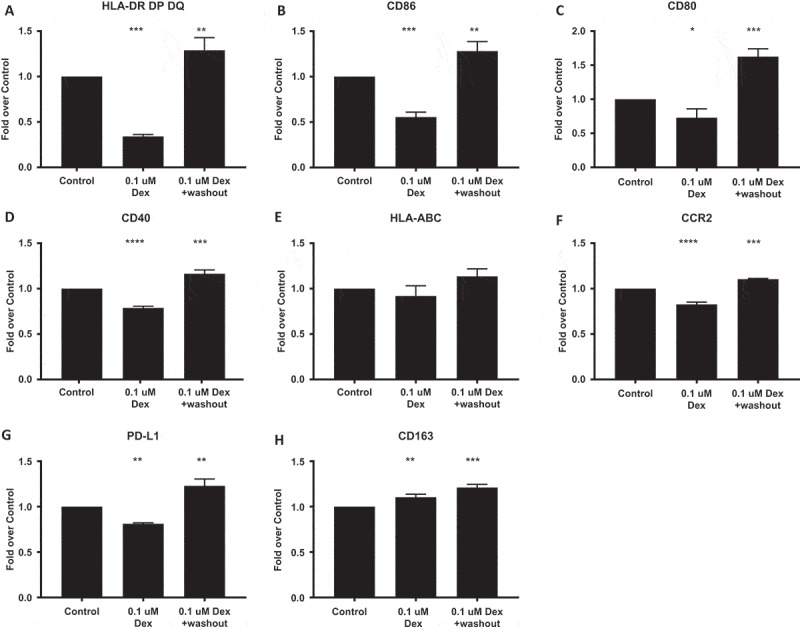
Efforts to reduce immunosuppression in the solid tumor microenvironment by blocking the recruitment or polarization of tumor associated macrophages (TAM), or myeloid derived suppressor cells (MDSCs), have gained momentum in recent years. Expanding our knowledge of the immune cell types, cytokines, or recruitment factors that are associated with high-grade disease, both within the tumor and in circulation, is critical to identifying novel targets for immunotherapy. Furthermore, a better understanding of how therapeutic regimens, such as Dexamethasone (Dex), chemotherapy, and radiation, impact these factors will facilitate the design of therapies that can be targeted to the appropriate populations and retain efficacy when administered in combination with standard of care regimens. Here we perform quantitative analysis of tissue microarrays made of samples taken from grades I-III astrocytoma and glioblastoma (GBM, grade IV astrocytoma) to evaluate infiltration of myeloid markers CD163, CD68, CD33, and S100A9. Serum, flow cytometric, and Nanostring analysis allowed us to further elucidate the impact of Dex treatment on systemic biomarkers, circulating cells, and functional markers within tumor tissue. We found that common myeloid markers were elevated in Dex-treated grade I astrocytoma and GBM compared to non-neoplastic brain tissue and grade II-III astrocytomas. Cell frequencies in these samples differed significantly from those in Dex-naïve patients in a pattern that depended on tumor grade. In contrast, observed changes in serum chemokines or circulating monocytes were independent of disease state and were due to Dex treatment alone. Furthermore, these changes seen in blood were often not reflected within the tumor tissue. Conclusions: Our findings highlight the importance of considering perioperative treatment as well as disease grade when assessing novel therapeutic targets or biomarkers of disease.
Keywords: Dexamethasone; Glioblastoma; cancer immunology; immunotherapy; tumor associated macrophage.
Figures
Similar articles
-
Glioma grade is associated with the accumulation and activity of cells bearing M2 monocyte markers.Clin Cancer Res. 2013 Jul 15;19(14):3776-86. doi: 10.1158/1078-0432.CCR-12-1940. Epub 2013 Jun 5. Clin Cancer Res. 2013. PMID: 23741072
-
Transcriptome analysis reveals distinct gene expression profiles in astrocytoma grades II-IV.Biomed Pap Med Fac Univ Palacky Olomouc Czech Repub. 2017 Sep;161(3):261-271. doi: 10.5507/bp.2017.020. Epub 2017 Apr 26. Biomed Pap Med Fac Univ Palacky Olomouc Czech Repub. 2017. PMID: 28452381
-
PBEF1/NAmPRTase/Visfatin: a potential malignant astrocytoma/glioblastoma serum marker with prognostic value.Cancer Biol Ther. 2008 May;7(5):663-8. doi: 10.4161/cbt.7.5.5663. Cancer Biol Ther. 2008. PMID: 18728403
-
Metabolic and functional reprogramming of myeloid-derived suppressor cells and their therapeutic control in glioblastoma.Cell Stress. 2019 Jan 23;3(2):47-65. doi: 10.15698/cst2019.02.176. Cell Stress. 2019. PMID: 31225500 Free PMC article. Review.
-
Standard therapies versus novel therapies in Hodgkin lymphoma.Immunol Lett. 2013 Sep-Oct;155(1-2):56-9. doi: 10.1016/j.imlet.2013.09.011. Epub 2013 Oct 16. Immunol Lett. 2013. PMID: 24140162 Review.
Cited by
-
Targeting Myeloid Cells in Combination Treatments for Glioma and Other Tumors.Front Immunol. 2019 Jul 23;10:1715. doi: 10.3389/fimmu.2019.01715. eCollection 2019. Front Immunol. 2019. PMID: 31396227 Free PMC article. Review.
-
Lessons learned from phase 3 trials of immunotherapy for glioblastoma: Time for longitudinal sampling?Neuro Oncol. 2024 Feb 2;26(2):211-225. doi: 10.1093/neuonc/noad211. Neuro Oncol. 2024. PMID: 37995317 Free PMC article.
-
Roles of STAT3 in the pathogenesis and treatment of glioblastoma.Front Cell Dev Biol. 2023 Feb 27;11:1098482. doi: 10.3389/fcell.2023.1098482. eCollection 2023. Front Cell Dev Biol. 2023. PMID: 36923251 Free PMC article. Review.
-
Biomarkers for immunotherapy for treatment of glioblastoma.J Immunother Cancer. 2020 May;8(1):e000348. doi: 10.1136/jitc-2019-000348. J Immunother Cancer. 2020. PMID: 32474411 Free PMC article. Review.
-
Myeloid Diagnostic and Prognostic Markers of Immune Suppression in the Blood of Glioma Patients.Front Immunol. 2022 Jan 7;12:809826. doi: 10.3389/fimmu.2021.809826. eCollection 2021. Front Immunol. 2022. PMID: 35069595 Free PMC article.
References
-
- Stupp R, Hegi ME, Mason WP, Van Den Bent MJ, Taphoorn MJB, Janzer RC, Ludwin SK, Allgeier A, Fisher B, Belanger K, et al. Effects of radiotherapy with concomitant and adjuvant temozolomide versus radiotherapy alone on survival in glioblastoma in a randomised phase III study: 5-year analysis of the EORTC-NCIC trial. Lancet Oncol. 2009;10:459–466. doi:10.1016/S1470-2045(09)70025-7. - DOI - PubMed
-
- Campesato LF, Silva APM, Cordeiro L, Correa BR, Navarro FCP, Zanin RF, Marçola M, Inoue LT, Duarte ML, Molgora M, et al. High IL-1R8 expression in breast tumors promotes tumor growth and contributes to impaired antitumor immunity. Oncotarget. 2017;8:49470–49483. doi:10.18632/oncotarget.17713. - DOI - PMC - PubMed
-
- Crane CA, Austgen K, Haberthur K, Hofmann C, Moyes KW, Avanesyan L, Fong L, Campbell MJ, Cooper S, Oakes SA, et al. Immune evasion mediated by tumor-derived lactate dehydrogenase induction of NKG2D ligands on myeloid cells in glioblastoma patients. Proceedings of the National Academy of Sciences of the United States of America. 2014;111:12823–12828. doi:10.1073/pnas.1413933111 - DOI - PMC - PubMed
Publication types
LinkOut - more resources
Full Text Sources
Research Materials
Miscellaneous