. 2019 Jul 1;527(10):1633-1653.
doi: 10.1002/cne.24545. Epub 2018 Oct 30.

The distribution, number, and certain neurochemical identities of infracortical white matter neurons in a lar gibbon (Hylobates lar) brain

Affiliations

The distribution, number, and certain neurochemical identities of infracortical white matter neurons in a lar gibbon (Hylobates lar) brain

Jordan Swiegers et al. J Comp Neurol. .

Abstract

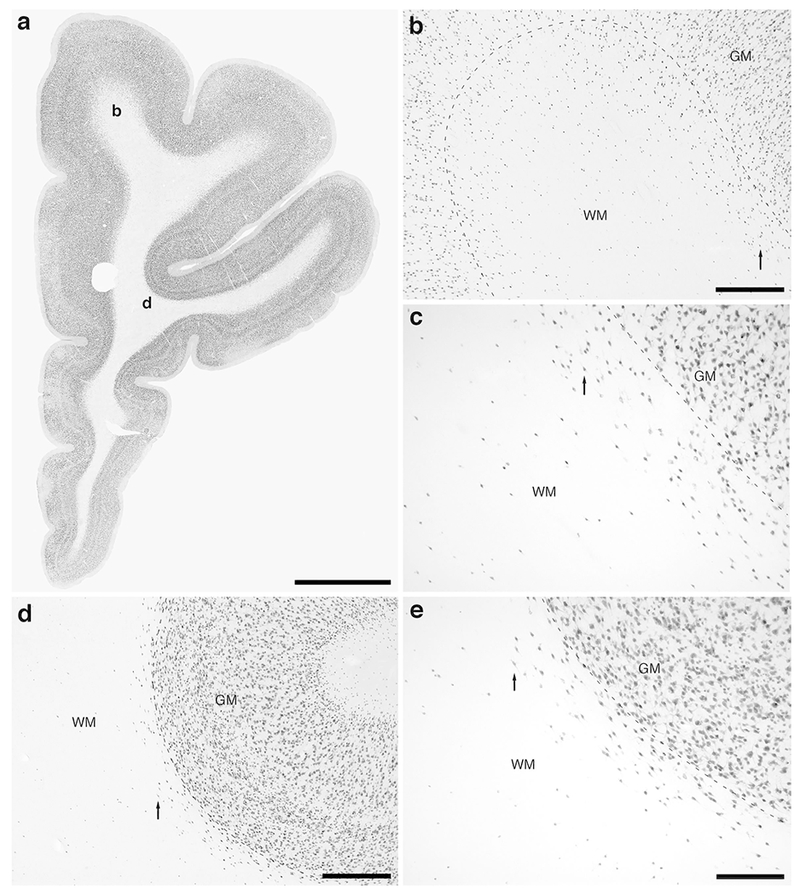
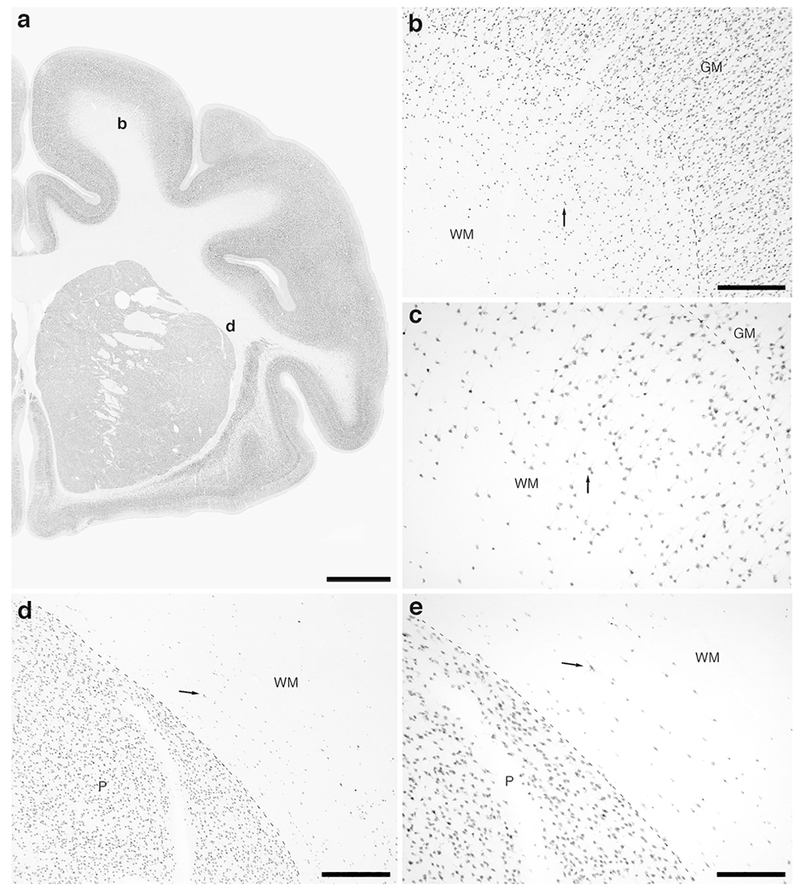
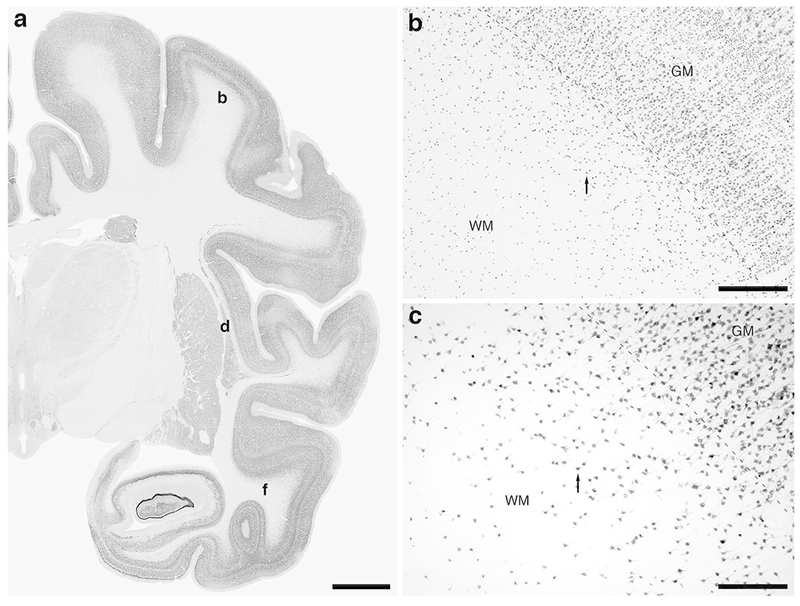
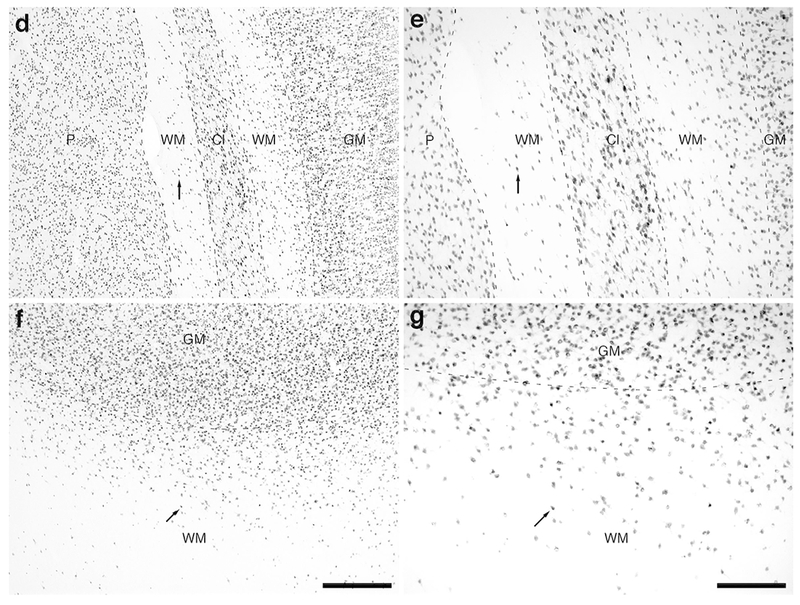
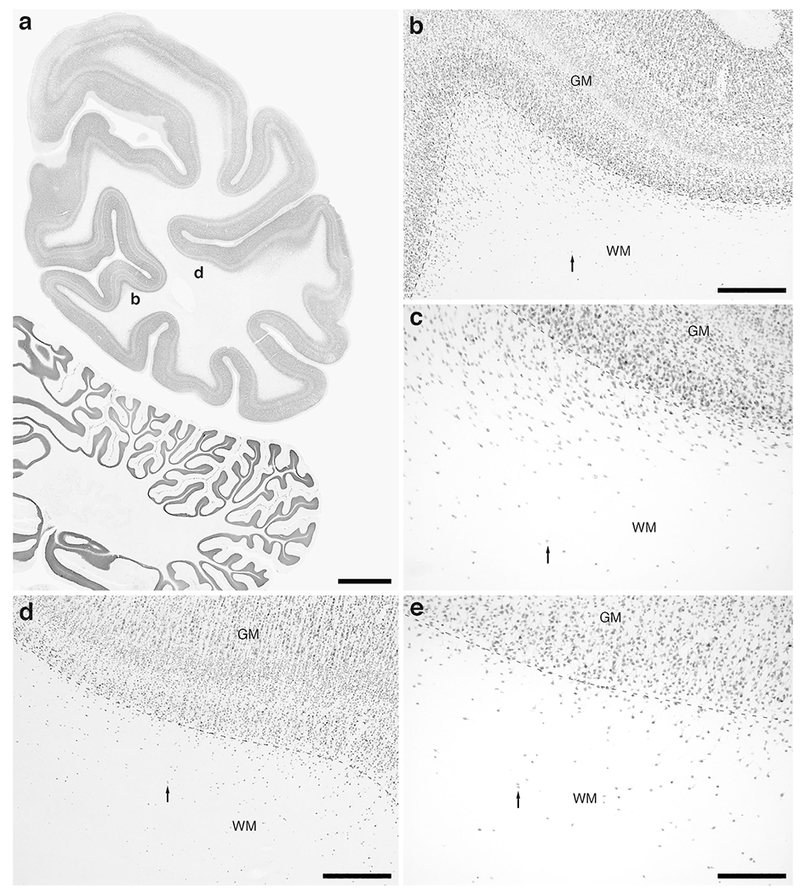
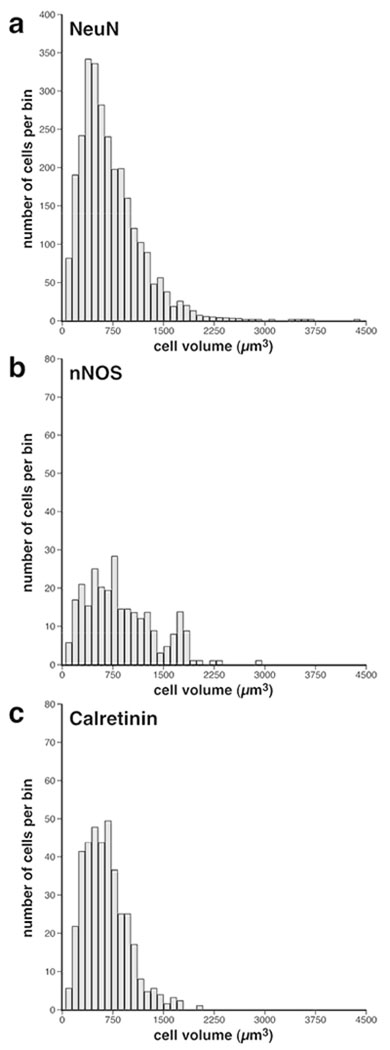
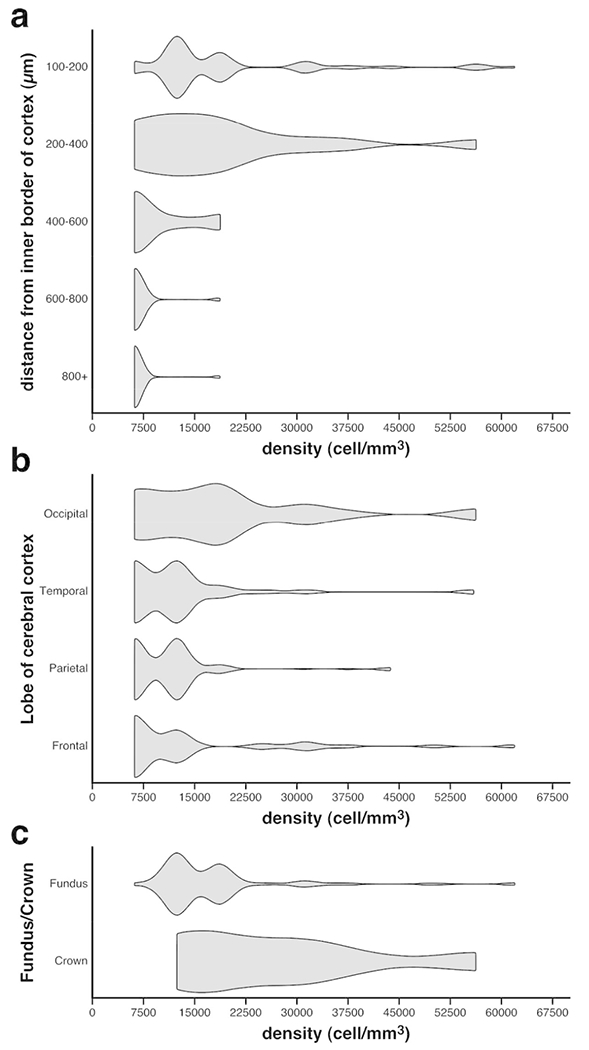
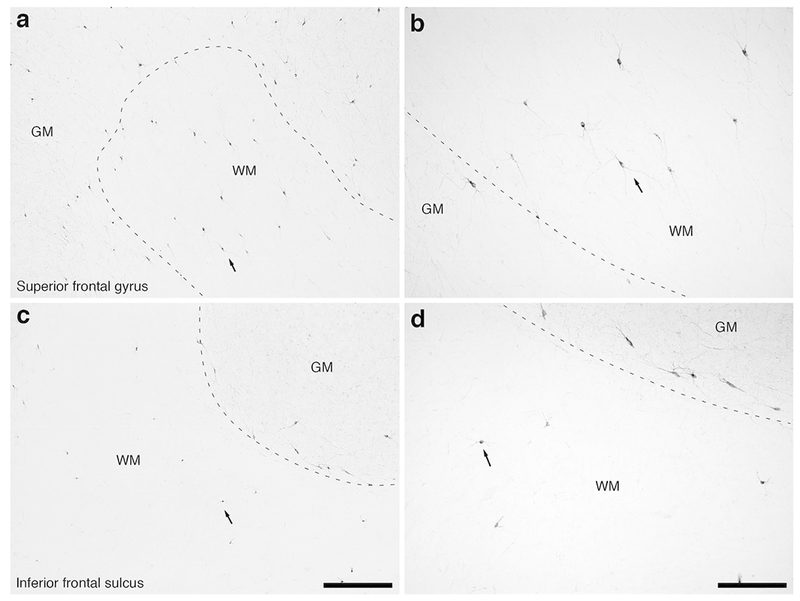
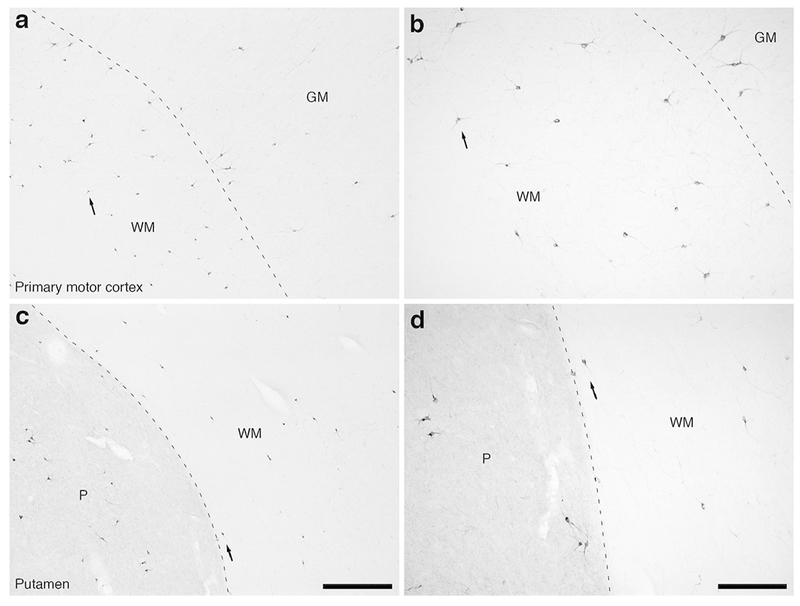
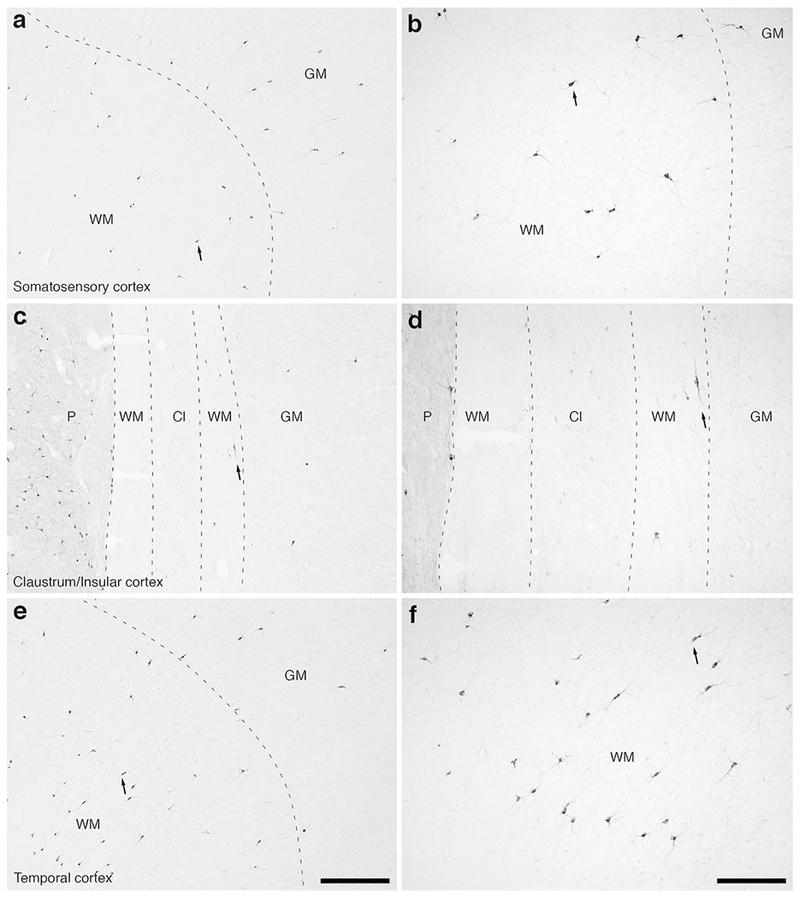
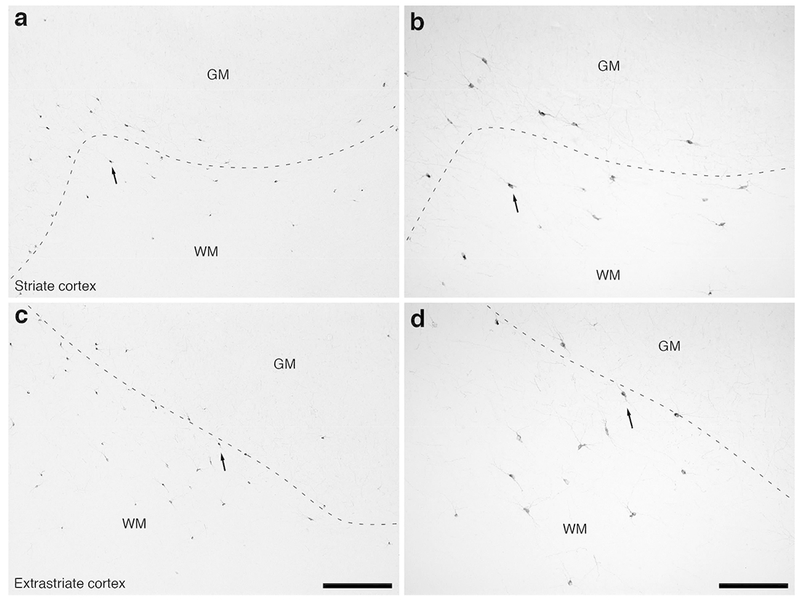
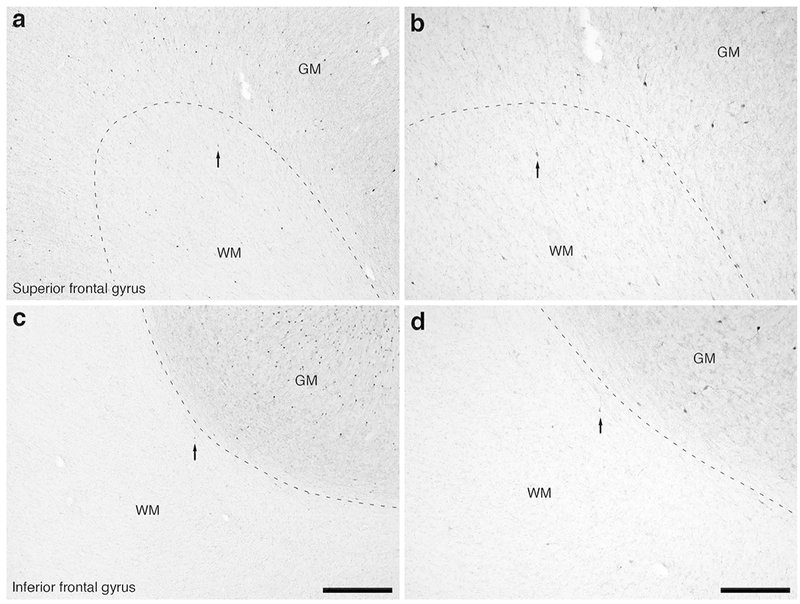
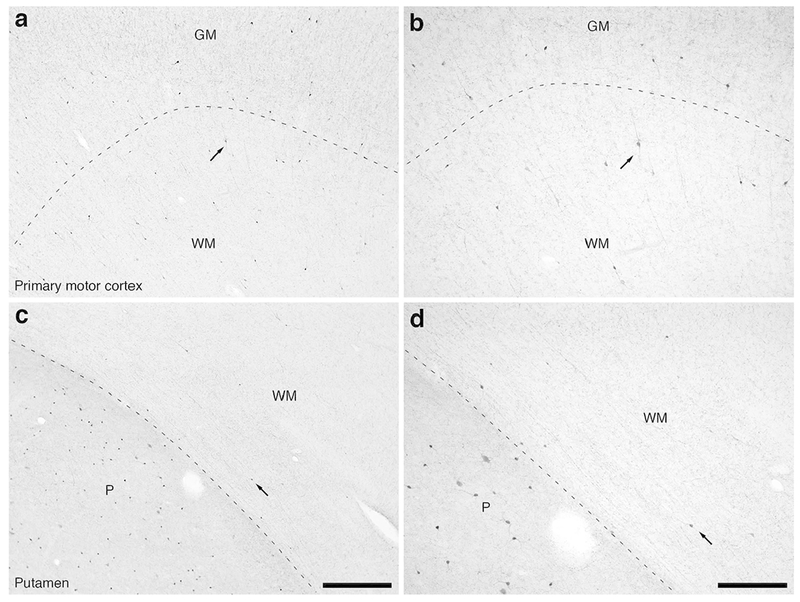
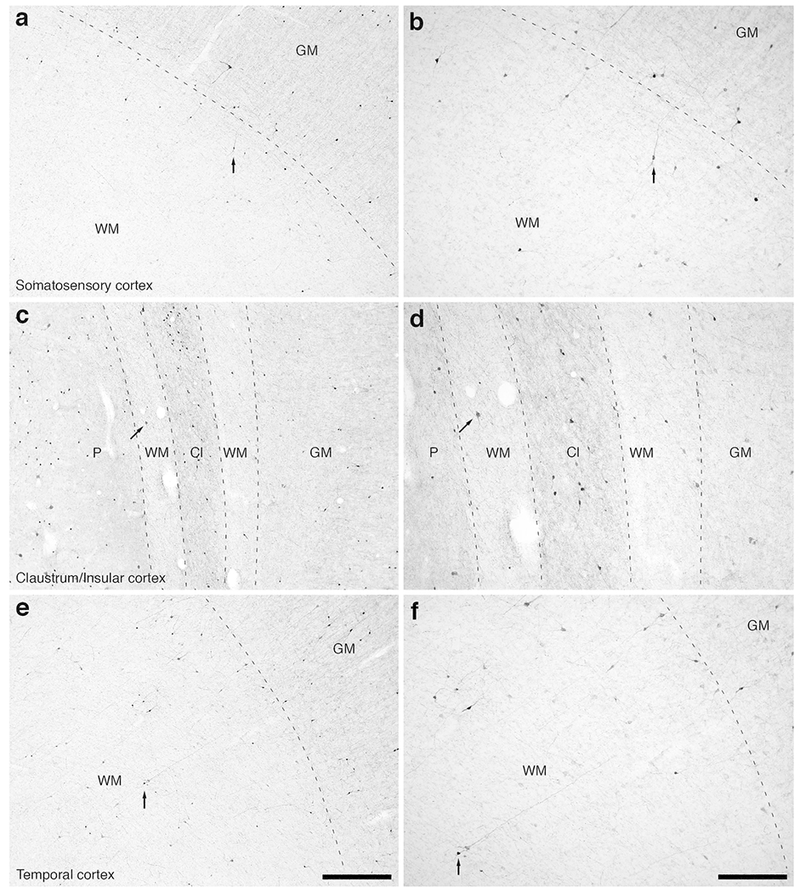
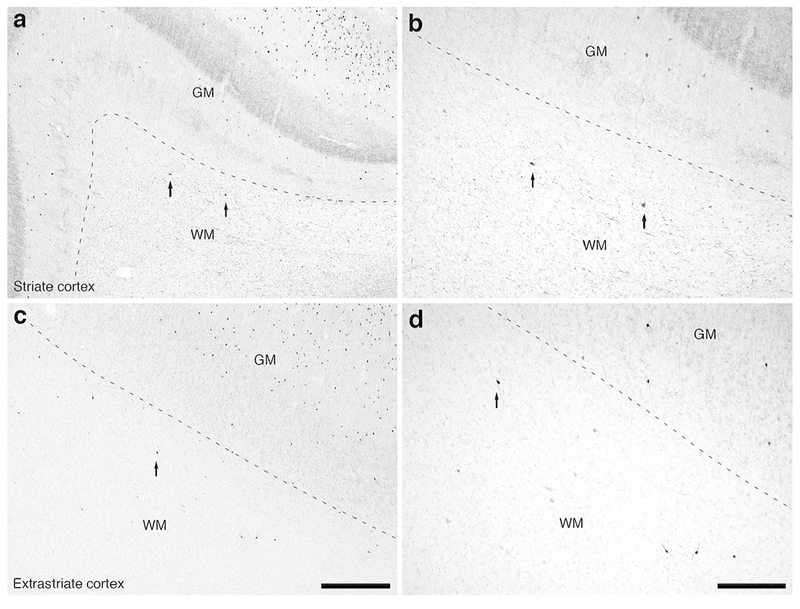
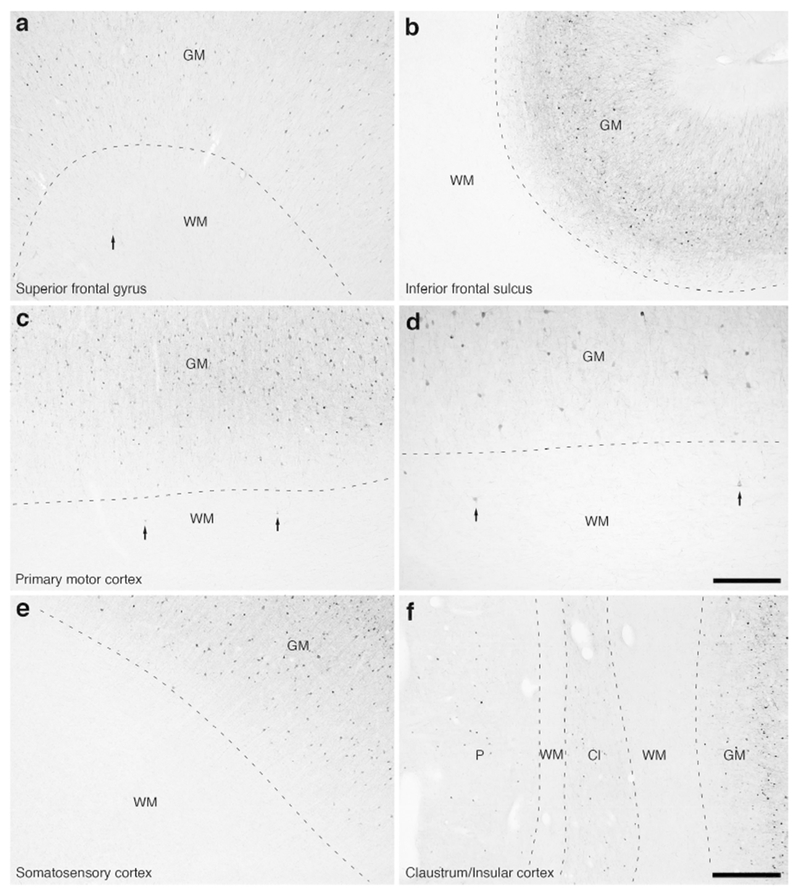
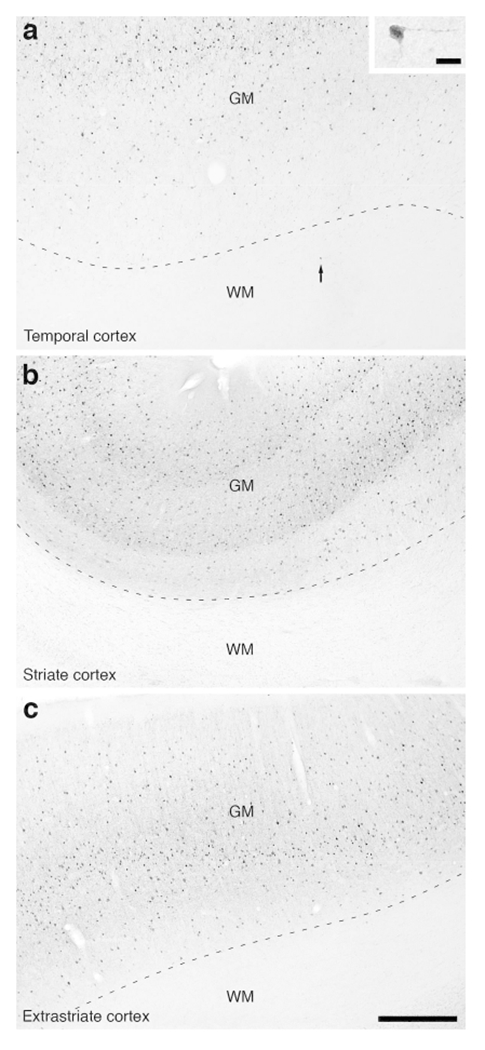
We examined the number, distribution, and immunoreactivity of the infracortical white matter neuronal population, also termed white matter interstitial cells (WMICs), in the brain of a lesser ape, the lar gibbon. Staining for neuronal nuclear marker (NeuN) revealed WMICs throughout the infracortical white matter, these cells being most numerous and dense close to cortical layer VI, decreasing significantly in density with depth in the white matter. Stereological analysis of NeuN-immunopositive cells revealed a global estimate of ~67.5 million WMICs within the infracortical white matter of the gibbon brain, indicating that the WMICs are a numerically significant population, ~2.5% of the total cortical gray matter neurons that would be estimated for a primate brain the mass of that of the lar gibbon. Immunostaining revealed subpopulations of WMICs containing neuronal nitric oxide synthase (nNOS, ~7 million in number, with both small and large soma volumes), calretinin (~8.6 million in number, all of similar soma volume), very few WMICs containing parvalbumin, and no calbindin-immunopositive neurons. These nNOS, calretinin, and parvalbumin immunopositive WMICs, presumably all inhibitory neurons, represent ~23.1% of the total WMIC population. As the white matter is affected in many cognitive conditions, such as schizophrenia, autism and also in neurodegenerative diseases, understanding these neurons across species is important for the translation of findings of neural dysfunction in animal models to humans. Furthermore, studies of WMICs in species such as apes provide a crucial phylogenetic context for understanding the evolution of these cell types in the human brain.

Keywords: RRID: AB_10000321; RRID: AB_10000340; RRID: AB_10000343; RRID: AB_11204707; RRID: AB_91824; ape brain; cortical evolution; immunohistochemistry; neurochemistry; primate brain; white matter neurons.


Conflict of interest statement

Conflict of Interest: The authors declare no conflicts of interest.

Figures

Figure 1:
Figure 1:
Photomicrographs of neuronal nuclear marker (NeuN) immunostaining in a coronal section through the rostral portion of the frontal lobe of the lar gibbon, deep to the granular prefrontal cortex, showing the distribution of infracortical white matter interstitial cells (WMICs), presumably neurons. (a) Low magnification image of the entire section through the right frontal lobe of the lar gibbon stained with NeuN, showing the presence of numerous cells deep to the cortex. (b) Moderately magnified image of the superior frontal gyrus (from the region indicated by the b in image a), showing the numerous WMICs deep to the cerebral cortex (grey matter, GM) within the infracortical white matter (WM). The approximate boundary of the deep border of cortical layer VI and the WM is marked by a dashed line. (c) High magnification image of the cortical/white matter boundary (marked by a dashed line) of the superior frontal gyrus, showing the WMICs deep to the cerebral cortex within the WM. Arrows in b and c indicate the same neuron for orientation of image location. (d) Moderately magnified image of the fundus of the inferior frontal gyrus (from the region indicated by the d in image a), showing WMICs deep to the cerebral cortex (GM) within the WM. The approximate boundary of the deep border of cortical layer VI and the WM is marked by a dashed line. (e) High magnification image of the cortical/white matter boundary (marked by a dashed line) of the fundus of the inferior frontal gyrus, showing the WMICs deep to the cerebral cortex within the WM. Arrows in d and e indicate the same neuron for orientation of image location. Scale bar in a = 5 mm and applies to a only. Scale bars in b and d = 500 μm and apply to b and d only. Scale bar in e = 250 μm and applies to c and e. In all images dorsal is to the top of the image and medial to the left.
Figure 2:
Figure 2:
Photomicrographs of NeuN immunostaining in a coronal section through the caudal portion of the frontal lobe of the lar gibbon, showing WMICs. All conventions as in Fig. 1. (a) Low magnification image of the entire section through the right frontal lobe of the lar gibbon stained with NeuN, showing the high density of cells within the cerebral cortex and the presence of numerous cells deep to the cortex. (b) Moderately magnified image of the primary motor cortex (from the region indicated by the b in image a), showing the numerous WMICs deep to the cerebral cortex (grey matter, GM) within the infracortical white matter (WM). (c) High magnification image of the cortical/white matter boundary (marked by a dashed line) of the primary motor cortex, showing the WMICs below the cerebral cortex. (d) Moderately magnified image of the base of the WM adjacent to the putamen nucleus (P, from the region indicated by the d in image a), showing WMICs within the deep WM. (e) High magnification image of the P/WM boundary (marked by a dashed line), showing the WMICs in the deep WM. Scale bar in a= 5 mm and applies to a only. Scale bars in b and d = 500 μm and apply to b and d only. Scale bar in e = 250 μm and applies to c and e. In all images dorsal is to the top of the image and medial to the left.
Figure 3:
Figure 3:
Photomicrographs of NeuN immunostaining in a coronal section through the rostral portion of the parietal lobe, the claustrum/insular cortex and the temporal lobe of the lar gibbon, showing the distribution of WMICs. All conventions as in Fig. 1. (a) Low magnification image of the entire section stained with NeuN, showing the high density of cells within the cerebral cortex and the presence of numerous cells deep to the cortex. (b) Moderately magnified image of the somatosensory cortex (from the region indicated by the b in image a), showing the numerous WMICs deep to the cerebral cortex (grey matter, GM). (c) High magnification image of the cortical/white matter boundary (marked by a dashed line) of the somatosensory cortex, showing the WMICs. (d) Moderately magnified image showing the putamen nucleus (P), claustrum (Cl) and insular cortex (GM), from the region indicated by the d in image a, showing WMICs within the deep WM. (e) High magnification image of the claustrum and surrounding white matter, showing the WMICs in the deep WM. (f) Moderately magnified image of the temporal cortex (from the region indicated by the f in image a), showing WMICs deep to the cerebral cortex within the WM. The approximate boundary of the deep border of cortical layer VI and the WM is marked by a dashed line. (g) High magnification image of the cortical/white matter boundary (marked by a dashed line) of the base of the temporal cortex, showing the WMICs deep to the temporal cortex within the WM. Scale bar in a = 5 mm and applies to a only. Scale bars in b and f = 500 μm and applies to b, d and f. Scale bars in c and g = 250 μm and applies to c, e and g. In all images dorsal is to the top of the image and medial to the left.
Figure 3:
Figure 3:
Photomicrographs of NeuN immunostaining in a coronal section through the rostral portion of the parietal lobe, the claustrum/insular cortex and the temporal lobe of the lar gibbon, showing the distribution of WMICs. All conventions as in Fig. 1. (a) Low magnification image of the entire section stained with NeuN, showing the high density of cells within the cerebral cortex and the presence of numerous cells deep to the cortex. (b) Moderately magnified image of the somatosensory cortex (from the region indicated by the b in image a), showing the numerous WMICs deep to the cerebral cortex (grey matter, GM). (c) High magnification image of the cortical/white matter boundary (marked by a dashed line) of the somatosensory cortex, showing the WMICs. (d) Moderately magnified image showing the putamen nucleus (P), claustrum (Cl) and insular cortex (GM), from the region indicated by the d in image a, showing WMICs within the deep WM. (e) High magnification image of the claustrum and surrounding white matter, showing the WMICs in the deep WM. (f) Moderately magnified image of the temporal cortex (from the region indicated by the f in image a), showing WMICs deep to the cerebral cortex within the WM. The approximate boundary of the deep border of cortical layer VI and the WM is marked by a dashed line. (g) High magnification image of the cortical/white matter boundary (marked by a dashed line) of the base of the temporal cortex, showing the WMICs deep to the temporal cortex within the WM. Scale bar in a = 5 mm and applies to a only. Scale bars in b and f = 500 μm and applies to b, d and f. Scale bars in c and g = 250 μm and applies to c, e and g. In all images dorsal is to the top of the image and medial to the left.
Figure 4:
Figure 4:
Photomicrographs of NeuN immunostaining in a coronal section through the occipital lobe of the lar gibbon, showing the distribution of WMICs. All conventions as in Fig. 1. (a) Low magnification image of the entire section through the right occipital lobe of the lar gibbon stained with NeuN, showing the high density of cells within the cerebral cortex and the presence of numerous cells deep to the cortex. (b) Moderately magnified image of the striate cortex, presumably primary visual cortex (from the region indicated by the b in image a), showing the numerous WMICs deep to the cerebral cortex (grey matter, GM) within the infracortical white matter (WM). (c) High magnification image of the cortical/white matter boundary (marked by a dashed line) of the striate cortex, showing the WMICs deep to the cerebral cortex within the WM. (d) Moderately magnified image of the extrastriate cortex, presumably secondary visual cortex (from the region indicated by the d in image a), showing the numerous WMICs deep to the cerebral cortex (grey matter, GM) within the infracortical white matter (WM). (e) High magnification image of the cortical/white matter boundary (marked by a dashed line) of the extrastriate cortex, showing the WMICs deep to the cerebral cortex within the WM. Scale bar in a = 5 mm and applies to a only. Scale bars in b and d = 500 μm and apply to b and d only. Scale bar in e = 250 μm and applies to c and e. In all images dorsal is to the top of the image and medial to the left.
Figure 5:
Figure 5:
Frequency distribution bar plots of somal volumes of WMICs in the brain of the lar gibbon. (a) Volumes of the soma of WMICs immunoreactive to neuronal nuclear marker (NeuN). Note the median volume is 615.9 μm3, with a range from 63.6 to 3 716.6 μm3. (b) Volumes of the soma of WMICs immunoreactive to neuronal nitric oxide synthase (nNOS). Note the median volume is 817.8 μm3, with a range from 110.6 to 2 899.8 μm3. (c) Volumes of the soma of WMICs immunoreactive to calretinin. Note the median volume is 619.4 μm3, with a range from 56.2 to 1 952.7 μm3. In all plots the bin width = 92.9 μm3.
Figure 6:
Figure 6:
Violin plots of the relationship between the spot densities of WMICs immunoreactive to NeuN against the depth in the white matter (a), within the different cortical lobes (b) and in the white matter deep to gyral crowns and sulcal fundi (c). Note (a) the decrease in WMIC densities with increasing depth in the white matter, (b) that the occipital lobe appears to have higher overall densities of WMICs than the other lobes, with the frontal lobe having the lowest overall densities, and (c) that the densities of WMICs are higher beneath gyral crowns than beneath sulcal fundi.
Figure 7:
Figure 7:
Photomicrographs of neuronal nitric oxide synthase (nNOS) immunostaining in the rostral portion of the frontal lobe of the lar gibbon showing the distribution of WMICs immunoreactive to nNOS. (a) Moderately magnified image of the superior frontal gyrus (from the region indicated by the b in Fig. 1a), showing the numerous nNOS-immunoreactive WMICs deep to the cerebral cortex (grey matter, GM, white matter, WM). The approximate boundary of the deep border of cortical layer VI and the WM is marked by a dashed line. (b) High magnification image of the cortical/white matter boundary (marked by a dashed line) of the superior frontal gyrus, showing the nNOS-immunoreactive WMICs deep to the cerebral cortex. Arrows in a and b indicate the same neuron for orientation of image location. (c) Moderately magnified image of the fundus of the inferior frontal gyrus (from the region indicated by the d in Fig. 1a), showing the nNOS-immunoreactive WMICs deep to the cerebral cortex (GM) within the WM. The approximate boundary of the deep border of cortical layer VI and the WM is marked by a dashed line. (d) High magnification image of the cortical/white matter boundary (marked by a dashed line) of the fundus of the inferior frontal gyrus, showing the nNOS-immunoreactive WMICs deep to the cerebral cortex within the WM. Arrows in c and d indicate the same neuron for orientation of image location. Scale bar in c = 500 μm and apply to a and c. Scale bar in d = 250 μm and applies to b and d. In all images dorsal is to the top of the image and medial to the left.
Figure 8:
Figure 8:
Photomicrographs of nNOS immunostaining in the caudal portion of the fronta lobe of the lar gibbon, showing the distribution of WMICs immunoreactive to nNOS. All conventions as in Fig. 7. (a) Moderately magnified image of the primary motor cortex (from the region indicated by the b in Fig. 2a), showing the numerous nNOS-immunoreactive WMICs within the infracortical white matter (WM). (b) High magnification image of the cortical/white matter boundary (marked by a dashed line) of the primary motor cortex, showing the nNOS-immunoreactive WMICs deep to the cerebral cortex. Arrows in a and b indicate the same neuron for orientation of image location. (c) Moderately magnified image of the WM adjacent to the putamen nucleus (P, from the region indicated by the d in Fig. 2a), showing the nNOS-immunoreactive WMICs within the deep WM. (d) High magnification image of the WM adjacent to the putamen nucleus showing the nNOS-immunoreactive WMICs within the deep WM. Arrows in c and d indicate the same neuron for orientation of image location. Scale bar in c = 500 μm and apply to a and c. Scale bar in d = 250 μm and applies to b and d. In all images dorsal is to the top of the image and medial to the left.
Figure 9:
Figure 9:
Photomicrographs of nNOS immunostaining in the rostral portion of the parietal lobe, the claustrum/insular cortex and the temporal lobe of the lar gibbon, showing the distribution of WMICs immunoreactive to nNOS. All conventions as in Fig. 7. (a) Moderately magnified image of the somatosensory cortex (from the region indicated by the b in Fig. 3a), showing the numerous nNOS-immunoreactive WMICs. (b) High magnification image of the cortical/white matter boundary (marked by a dashed line) of the somatosensory cortex, showing the nNOS-immunoreactive WMICs. (c) Moderately magnified image showing the putamen nucleus (P), claustrum (Cl) and insular cortex (GM), from the region indicated by the d in Fig. 3a, showing nNOS immunoreactive WMICs within the deep WM. (d) High magnification image of the claustrum and surrounding white matter, showing the nNOS-immunoreactive WMICs in the deep WM. (e) Moderately magnified image of the temporal cortex (from the region indicated by the f in Fig. 3a), showing nNOS-immunoreactive WMICs. (f) High magnification image of the cortical/white matter boundary (marked by a dashed line) of the base of the temporal cortex, showing the nNOS-immunoreactive WMICs within the WM. Scale bar in e = 500 μm and applies to a, c and e. Scale bar in f = 250 μm and applies to b, d and f. In all images dorsal is to the top of the image and medial to the left.
Figure 10:
Figure 10:
Photomicrographs of nNOS immunostaining in the occipital lobe of the lar gibbon, showing the distribution of WMICs immunoreactive to nNOS. All conventions as in Fig. 7. (a) Moderately magnified image of the striate cortex, presumably primary visual cortex (from the region indicated by the b in Fig. 4a), showing the nNOS-immunoreactive WMICs. (b) High magnification image of the cortical/white matter boundary (marked by a dashed line) of the striate cortex, showing the nNOS-immunoreactive WMICs deep to the cerebral cortex. (c) Moderately magnified image of the extrastriate cortex, presumably secondary visual cortex (from the region indicated by the d in Fig. 4a), showing the numerous nNOS-immunoreactive WMICs. (d) High magnification image of the cortical/white matter boundary (marked by a dashed line) of the extrastriate cortex, showing the nNOS-immunoreactive WMICs. Scale bars in c = 500 μm and applies to a and c. Scale bar in d = 250 μm and applies to b and d. In all images dorsal is to the top of the image and medial to the left.
Figure 11:
Figure 11:
Photomicrographs of calretinin (CR) immunostaining in the rostral portion of the frontal lobe of the lar gibbon showing the distribution of WMICs immunoreactive to CR. (a) Moderately magnified image of the superior frontal gyrus (from the region indicated by the b in Fig. 1a), showing the numerous CR-immunoreactive WMICs. (b) High magnification image of the cortical/white matter boundary (marked by a dashed line) of the superior frontal gyrus, showing the CR-immunoreactive WMICs deep to the cerebral cortex within the WM. Arrows in a and b indicate the same neuron for orientation of image location. (c) Moderately magnified image of the fundus of the inferior frontal gyrus (from the region indicated by the d in Fig. 1a), showing the CR-immunoreactive WMICs. (d) High magnification image of the cortical/white matter boundary of the fundus of the inferior frontal gyrus, showing the CR-immunoreactive WMICs deep to the cerebral cortex. Arrows in c and d indicate the same neuron for orientation of image location. Scale bar in c = 500 μm and apply to a and c. Scale bar in d = 250 μm and applies to b and d. In all images dorsal is to the top of the image and medial to the left.
Figure 12:
Figure 12:
Photomicrographs of CR immunostaining in the caudal portion of the frontal lobe of the lar gibbon, showing the distribution of WMICs immunoreactive to CR. (a) Moderately magnified image of the primary motor cortex (from the region indicated by the b in Fig. 2a), showing the numerous CR-immunoreactive WMICs within the infracortical white matter (WM). (b) High magnification image of the cortical/white matter boundary (marked by a dashed line) of the primary motor cortex, showing the CR-immunoreactive WMICs deep to the cerebral cortex. Arrows in a and b indicate the same neuron for orientation of image location. (c) Moderately magnified image of the WM adjacent to the putamen nucleus (P, from the region indicated by the d in Fig. 2a), showing the CR-immunoreactive WMICs. (d) High magnification image of the WM adjacent to the putamen nucleus showing the CR-immunoreactive WMICs within the deep WM. Arrows in c and d indicate the same neuron for orientation of image location. Scale bar in c = 500 μm and apply to a and c. Scale bar in d = 250 μm and applies to b and d. In all images dorsal is to the top of the image and medial to the left.
Figure 13:
Figure 13:
Photomicrographs of CR immunostaining in the rostral portion of the parietal lobe, the claustrum/insular cortex and the temporal lobe of the lar gibbon, showing the distribution of WMICs immunoreactive to CR. (a) Moderately magnified image of the somatosensory cortex (from the region indicated by the b in Fig. 3a), showing the numerous CR-immunoreactive WMICs. (b) High magnification image of the cortical/white matter boundary (marked by a dashed line) of the somatosensory cortex, showing the CR-immunoreactive WMICs. (c) Moderately magnified image showing the putamen nucleus (P), claustrum (Cl) and insular cortex (GM), from the region indicated by the d in Fig. 3a, showing CR-immunoreactive WMICs within the deep WM. (d) High magnification image of the claustrum and surrounding white matter, showing the CR-immunoreactive WMICs in the deep WM. (e) Moderately magnified image of the temporal cortex (from the region indicated by the f in Fig. 3a), showing CR-immunoreactive WMICs. (f) High magnification image of the cortical/white matter boundary (marked by a dashed line) of the base of the temporal cortex, showing the CR-immunoreactive WMICs. Scale bar in e = 500 μm and applies to a, c and e. Scale bar in f= 250 μm and applies to b, d and f. In all images dorsal is to the top of the image and medial to the left.
Figure 14:
Figure 14:
Photomicrographs of CR immunostaining in the occipital lobe of the lar gibbon, showing the distribution of WMICs immunoreactive to CR. (a) Moderately magnified image of the striate cortex, presumably primary visual cortex (from the region indicated by the b in Fig. 4a), showing the occasional CR-immunoreactive WMIC. (b) High magnification image of the cortical/white matter boundary (marked by a dashed line) of the striate cortex, showing the CR-immunoreactive WMICs deep to the cerebral cortex. (c) Moderately magnified image of the extrastriate cortex, presumably secondary visual cortex (from the region indicated by the d in Fig. 4a), showing the more numerous CR-immunoreactive WMICs. (d) High magnification image of the cortical/white matter boundary (marked by a dashed line) of the extrastriate cortex, showing the CR-immunoreactive WMICs. Scale bar in c = 500 μm and applies to a and c. Scale bar in d = 250 μm and applies to b and d. In all images dorsal is to the top of the image and medial to the left.
Figure 15:
Figure 15:
Photomicrographs of parvalbumin (PV) immunostaining in the white matter of the lar gibbon, showing the distribution of occasional WMICs immunoreactive to PV. (a) White matter (WM) deep to the cortex of the superior frontal gyrus, with an arrow indicating a single PV-immunoreactive WMIC. (b) PV-immunoreactive WMICs were not observed in the white matter deep to the fundus of the inferior frontal sulcus. (c and d) WM deep to the primary motor cortex, with arrows showing two PV-immunoreactive WMICs. (e) PV-immunoreactive WMICs were not observed in the white matter deep to the somatosensory cortex. (f) PV-immunoreactive WMICs were not observed in the deep white matter surrounding the claustrum (Cl). GM – grey matter, P – putamen nucleus. Scale bar in d = 250 μm and applies to d only. Scale bar in f = 500 μm and applies to a, b, c, e and f. In all images dorsal is to the top of the image and medial to the left.
Figure 16:
Figure 16:
Photomicrographs of PV immunostaining in the white matter of the lar gibbon, showing the distribution of occasional WMICs immunoreactive to PV. (a) White matter (WM) deep to the temporal cortex, with an arrow indicating a single PV-immunoreactive WMIC. The inset in a shows this solitary stained neuron at a higher magnification. (b) PV-immunoreactive WMICs were not observed in the white matter deep to the striate cortex. (c) PV-immunoreactive WMICs were not observed in the deep white matter surrounding the extrastriate cortex. Scale bar in c = 500 μm and applies to a, b and c. Scale bar in inset of a = 20 μm and applies to the inset only. In all images dorsal is to the top of the image and medial to the left.

Similar articles

Cited by

References

    1. Adrio F, Rodriguez-Moldes I, & Anadon R (2011). Distribution of glycine immunoreactivity in the brain of the Siberian sturgeon (Acipenser baeri): comparison with γ-aminobutyric acid. Journal of Comparative Neurology, 519, 1115–1142. doi: 10.1002/cne.22556 - DOI - PubMed
    1. Akbarian S, Kim JJ, Potkin SG, Hetrick WP, Bunney WE, & Jones EG (1996). Maldistribution of interstitial neurons in prefrontal white matter of the brains of schizophrenic patients. Archives of General Psychiatry, 53, 425–436. doi: 10.1001/archpsyc.1996.01830050061010 - DOI - PubMed
    1. Amaral DG, Mills Schumann C, & Wu Nordahl C (2008). Neuroanatomy of autism. Trends in Neuroscience, 31, 137–145. doi: 10.1016/j.tins.2007.12.005 - DOI - PubMed
    1. Arion D, Unger T, Lewis DA, & Mirnics K (2007). Molecular markerss distinguishing supragranular and infragranular layers in the human prefrontal cortex. European Journal of Neuroscience, 25, 1843–1854. doi: 10.1111/j.1460-9568.2007.05396.x - DOI - PubMed
    1. Aston-Jones G, & Cohen JD (2005). An integrative theory of locus coeruleus-norepinephrine function: adaptive gain and optimal performance. Annual Review of Neuroscience, 28, 403–450. doi: 10.1146/annurev.neuro.28.061604.135709 - DOI - PubMed

Publication types

Supplementary concepts