. 2018 Dec;66(12):2719-2736.
doi: 10.1002/glia.23523. Epub 2018 Oct 30.

Traumatic brain injury-induced neuronal damage in the somatosensory cortex causes formation of rod-shaped microglia that promote astrogliosis and persistent neuroinflammation

Affiliations

Traumatic brain injury-induced neuronal damage in the somatosensory cortex causes formation of rod-shaped microglia that promote astrogliosis and persistent neuroinflammation

Kristina G Witcher et al. Glia. 2018 Dec.

Abstract

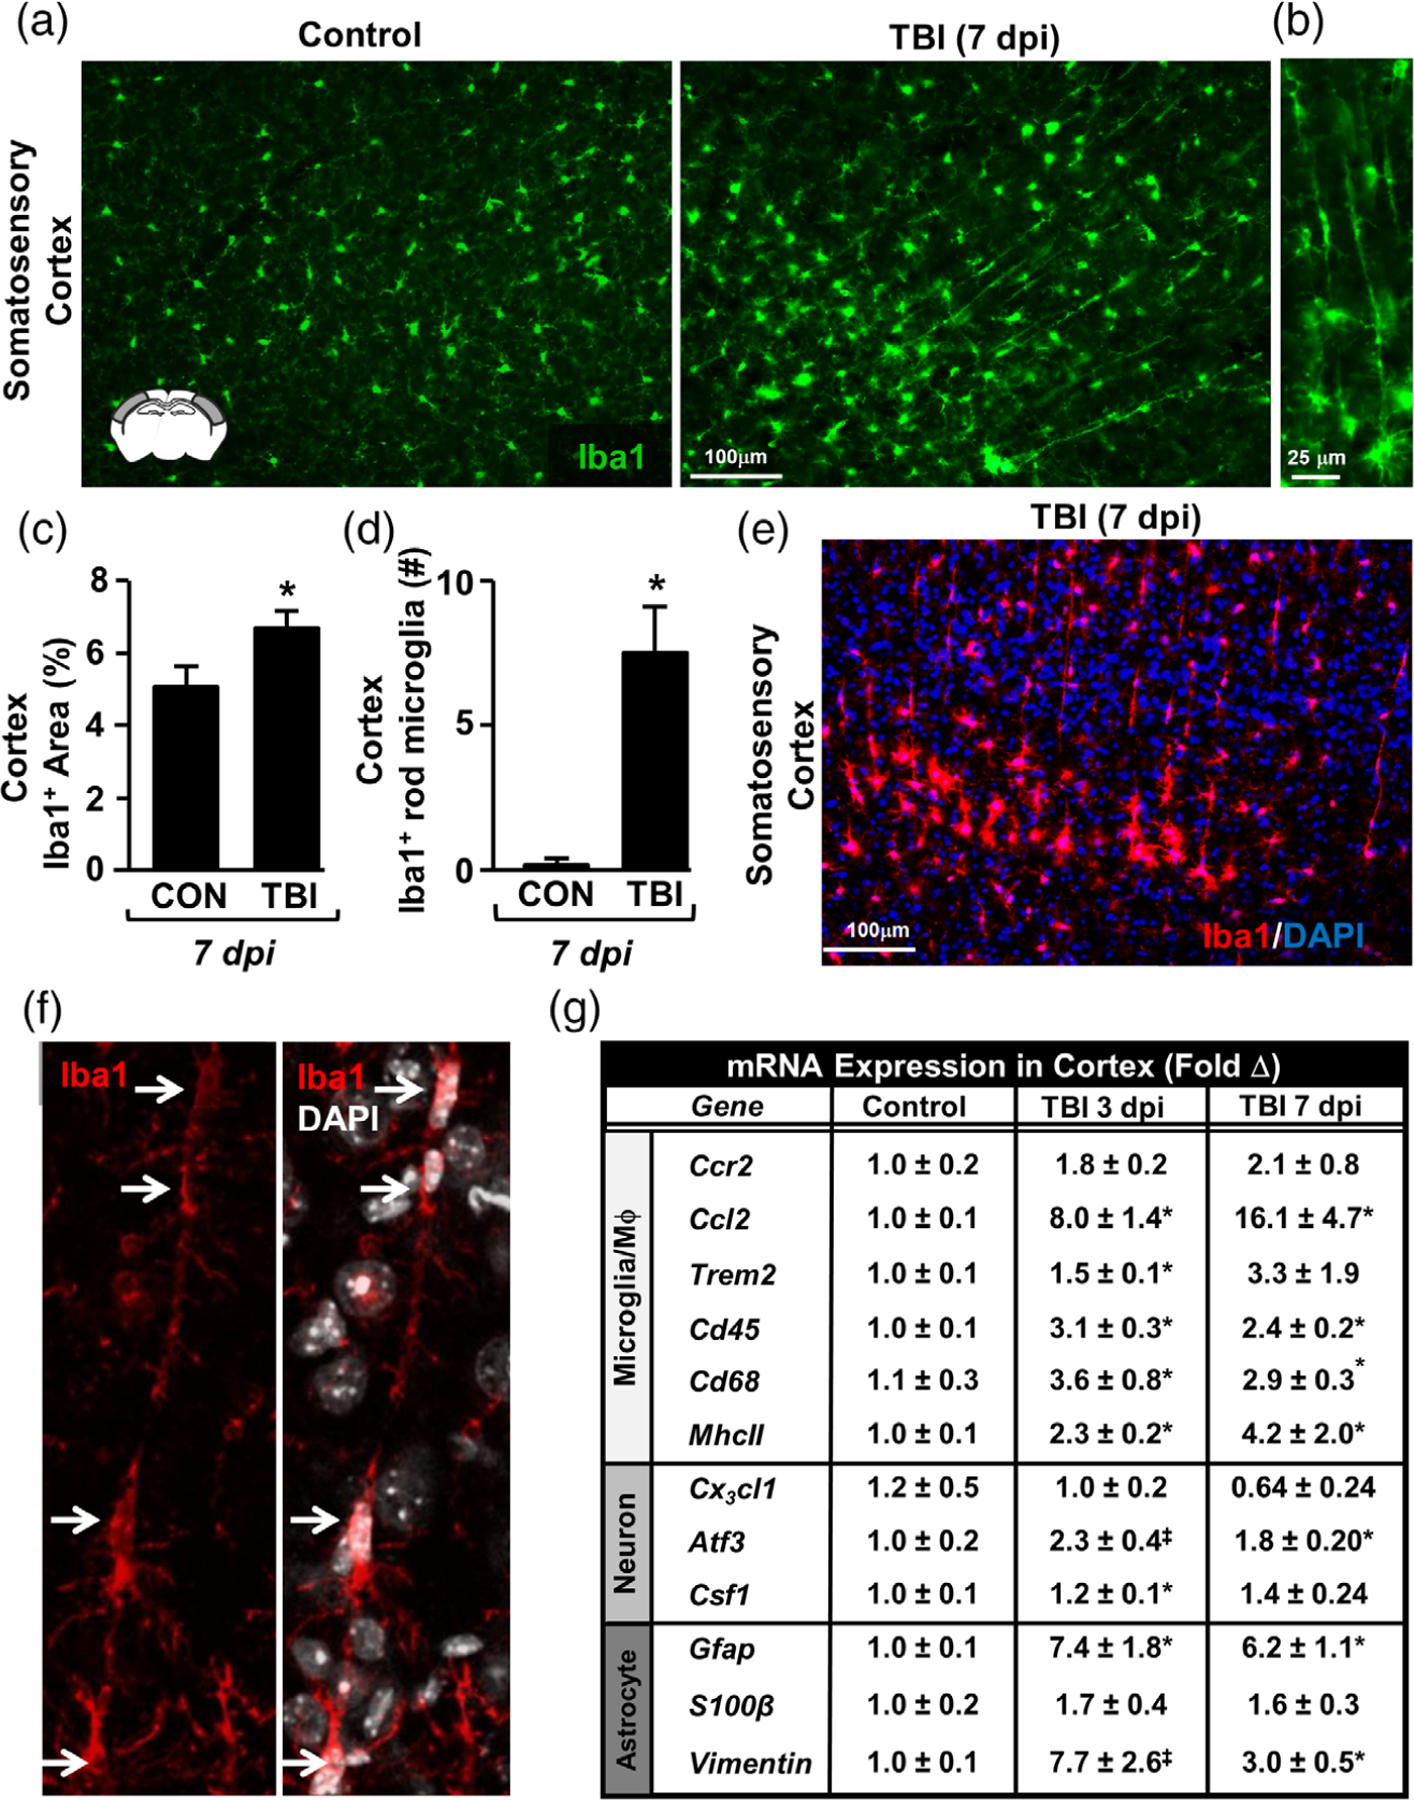
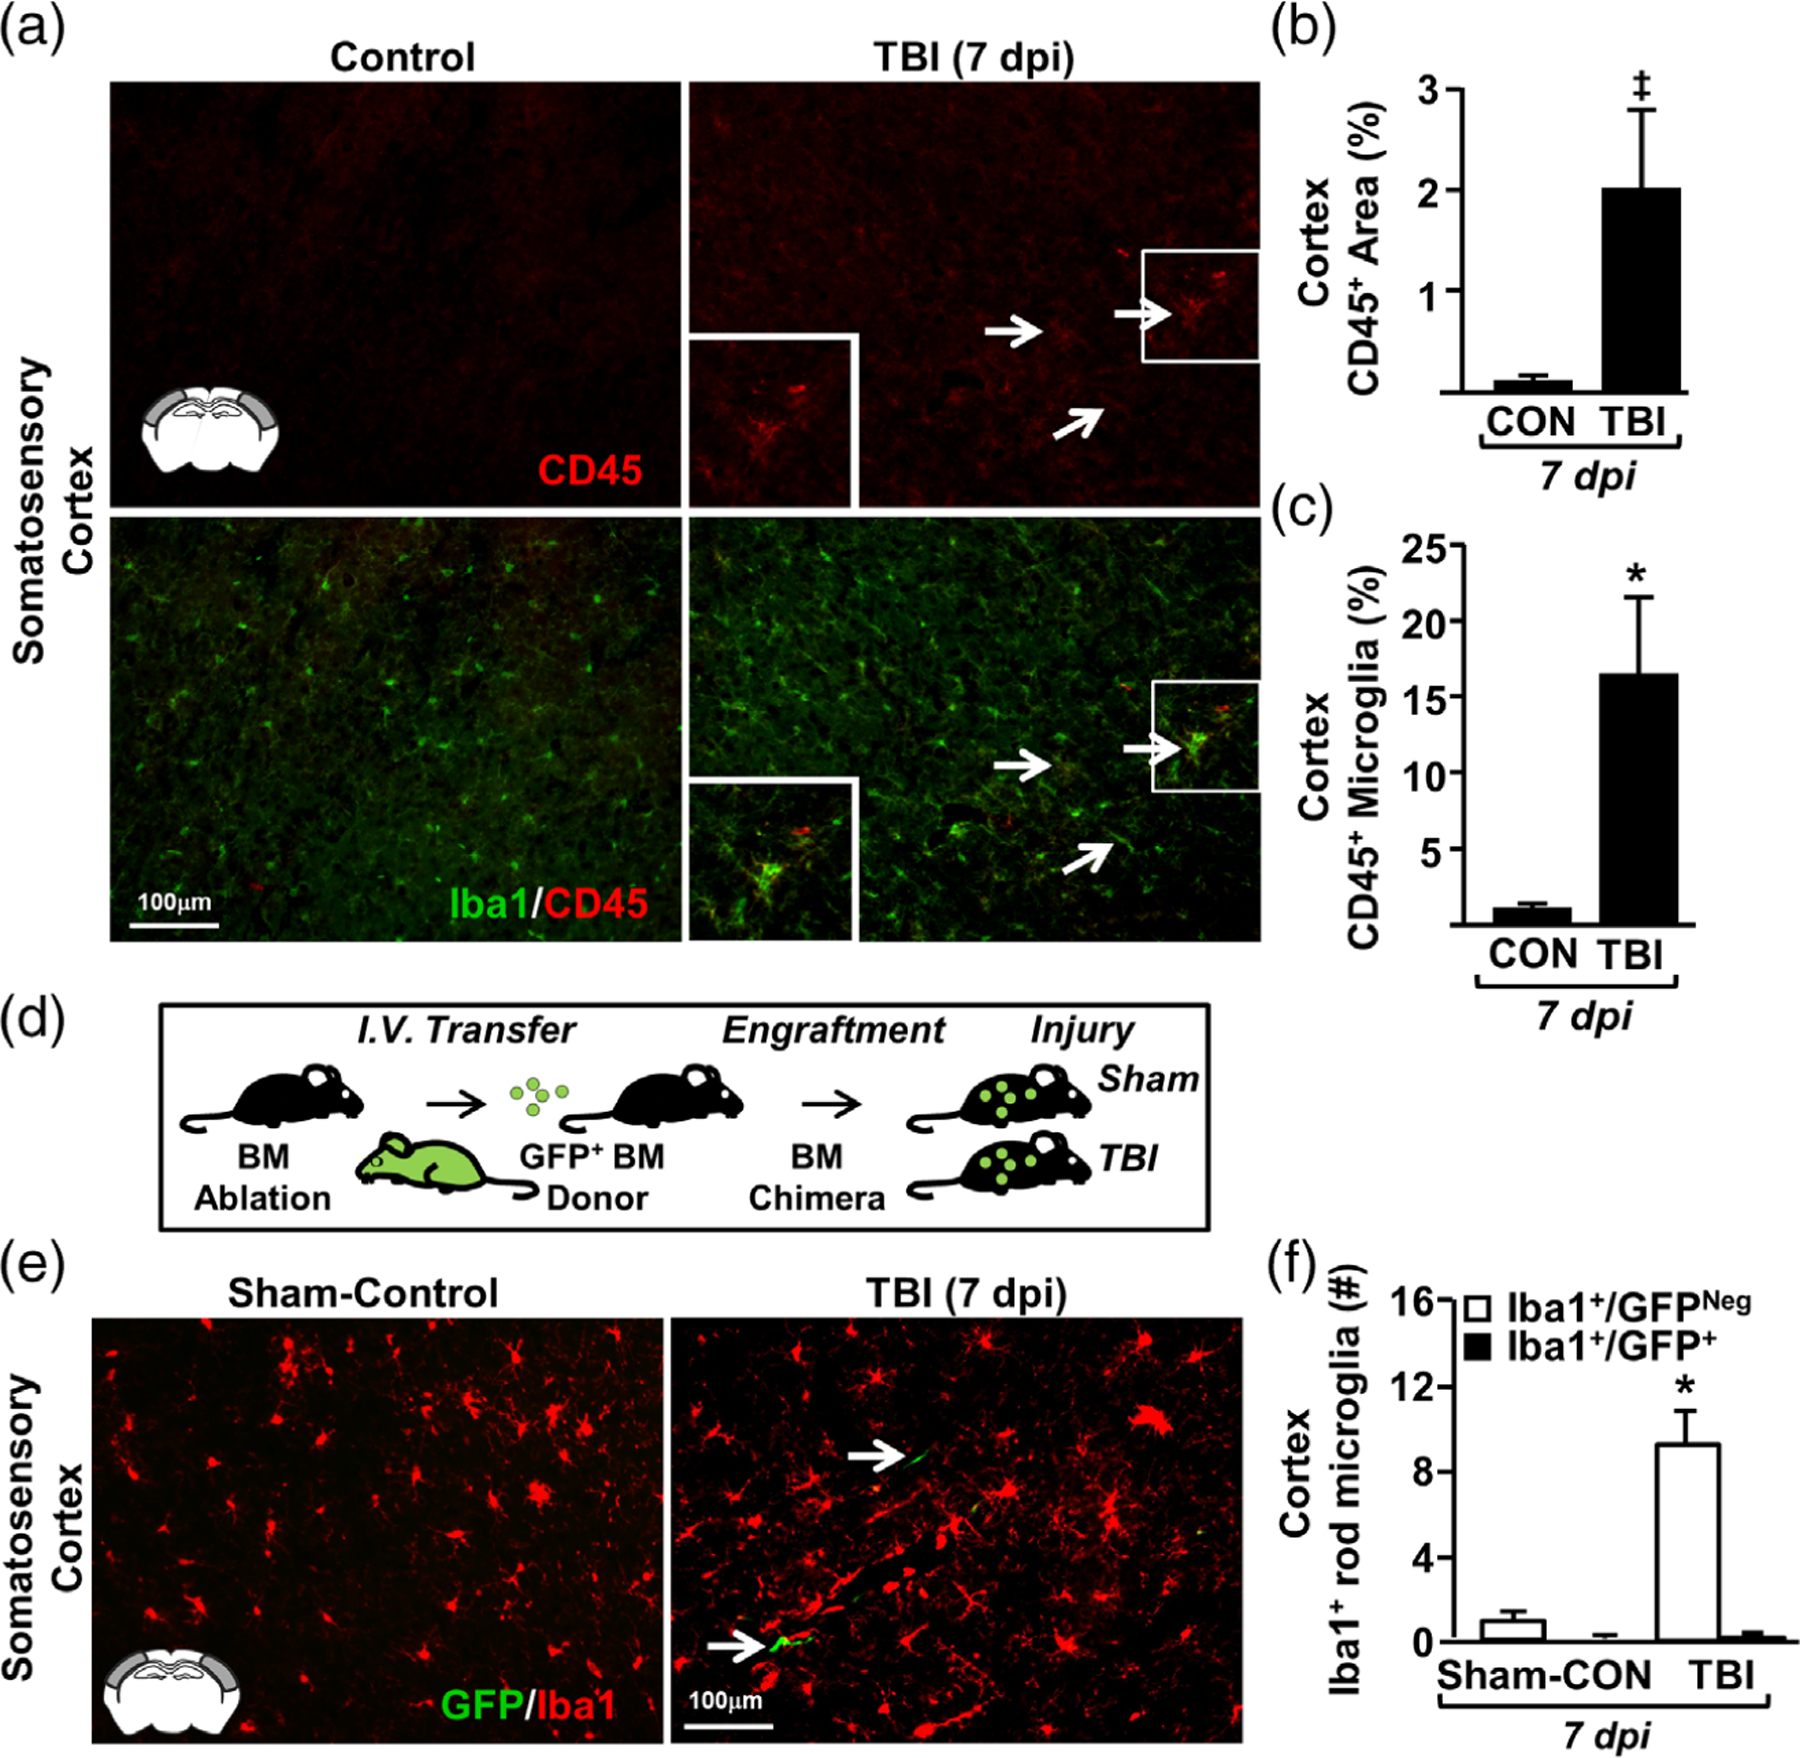
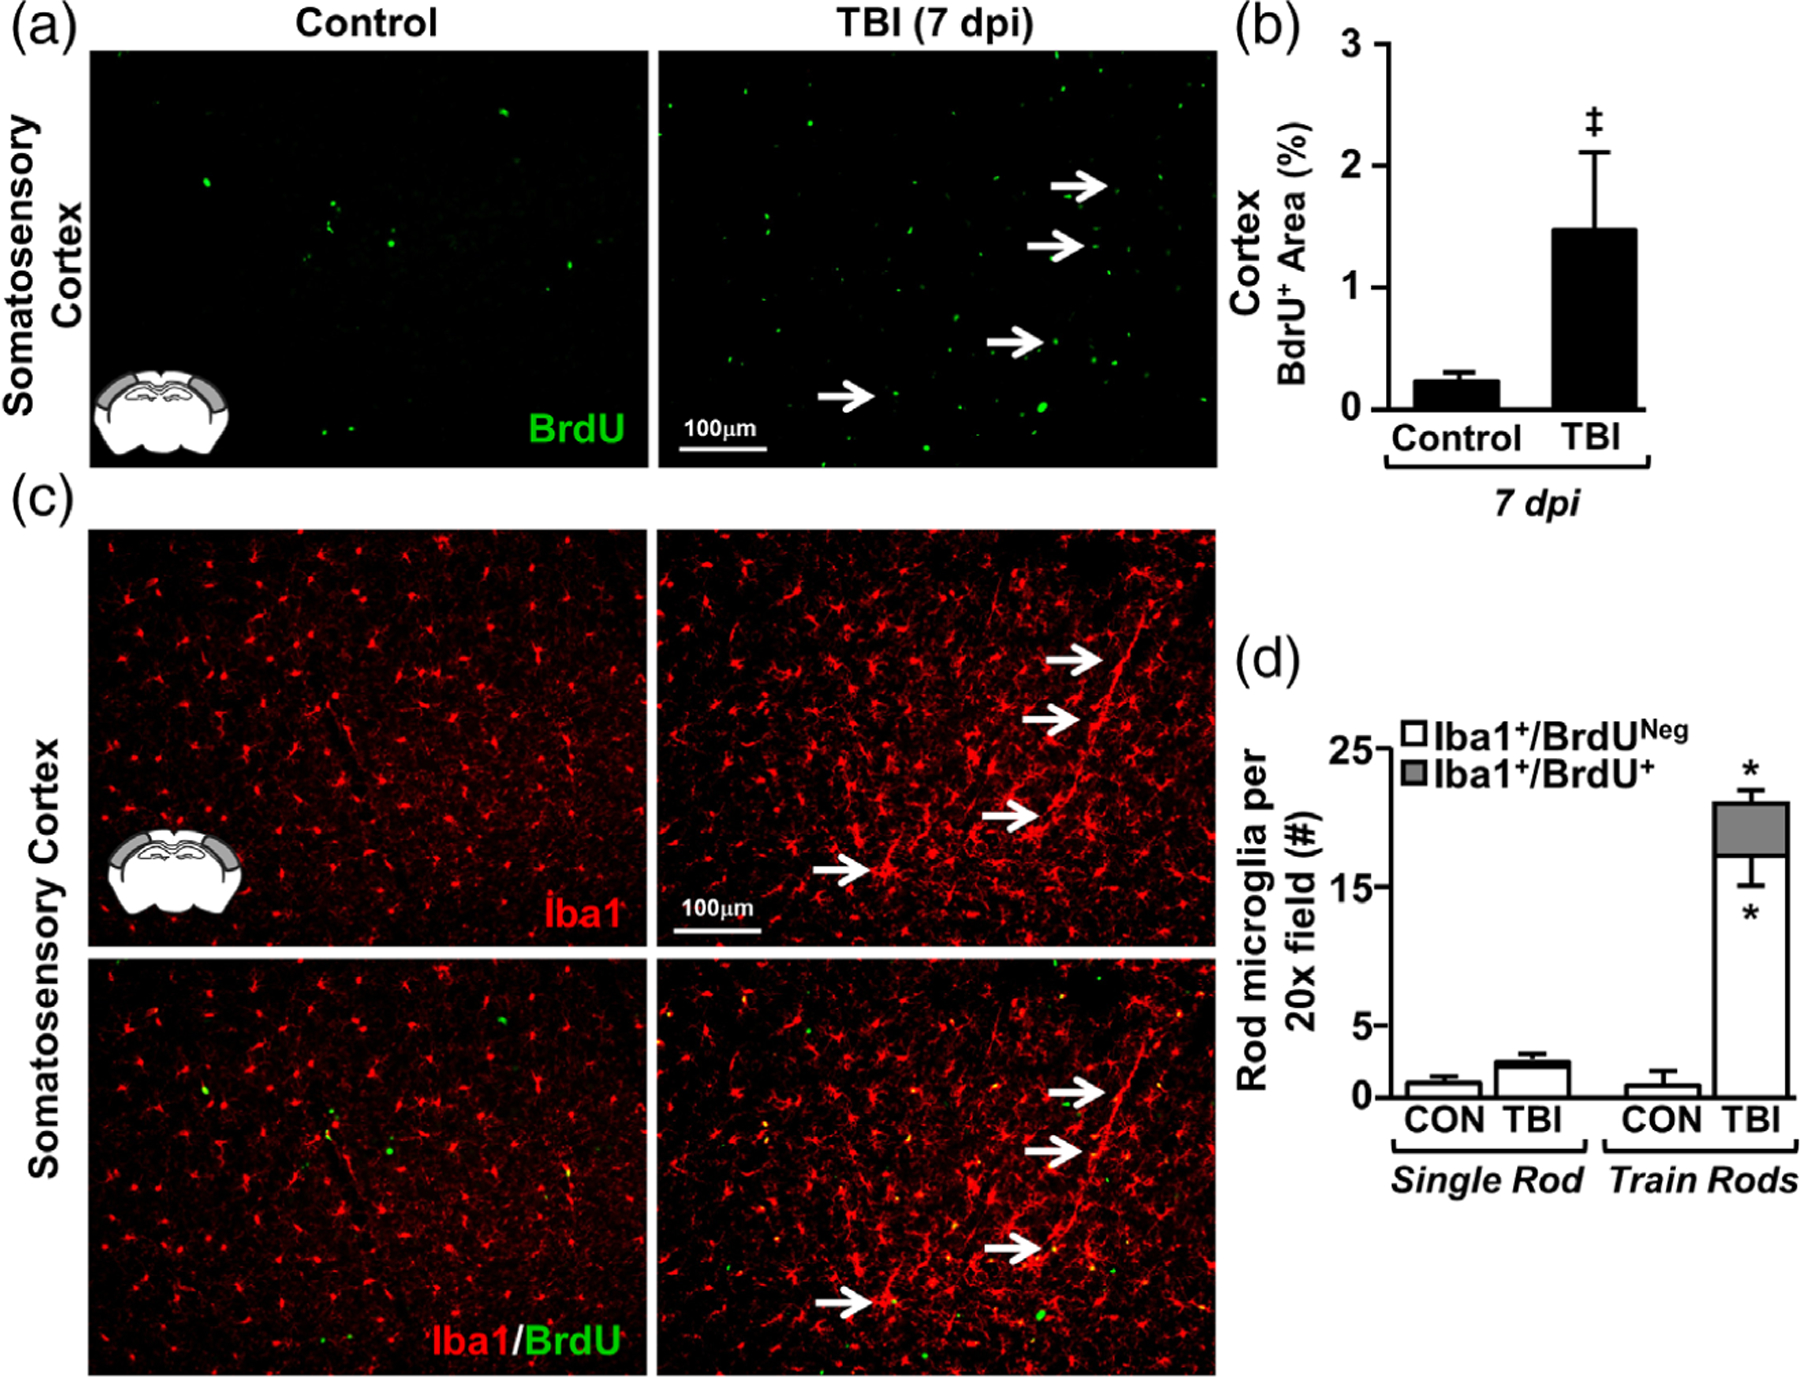
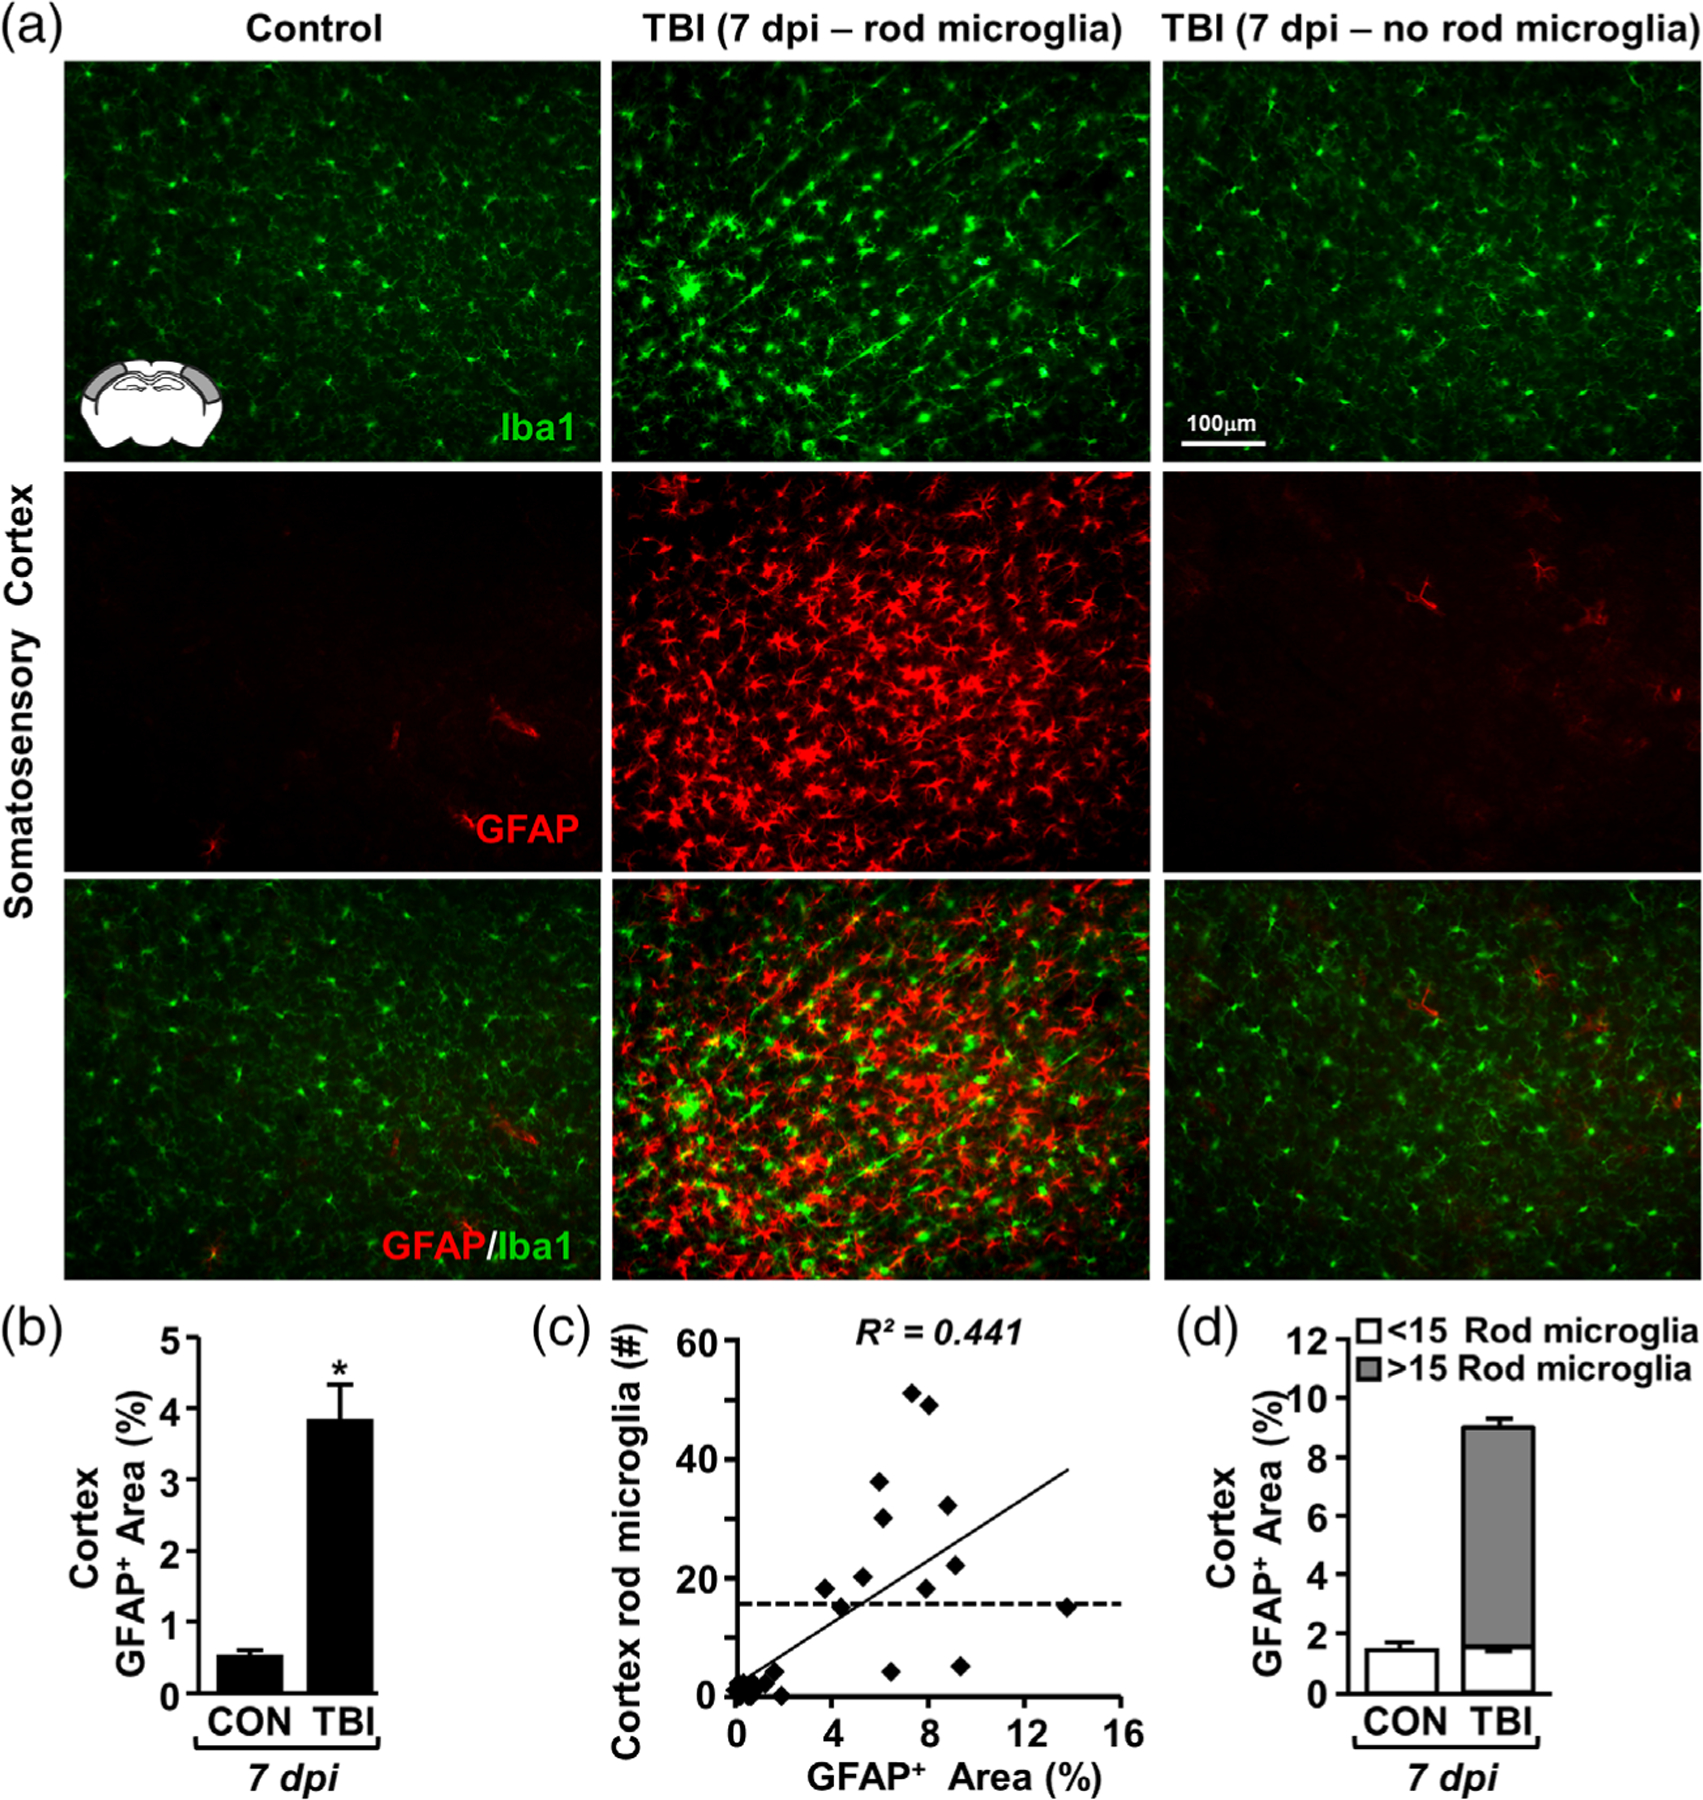
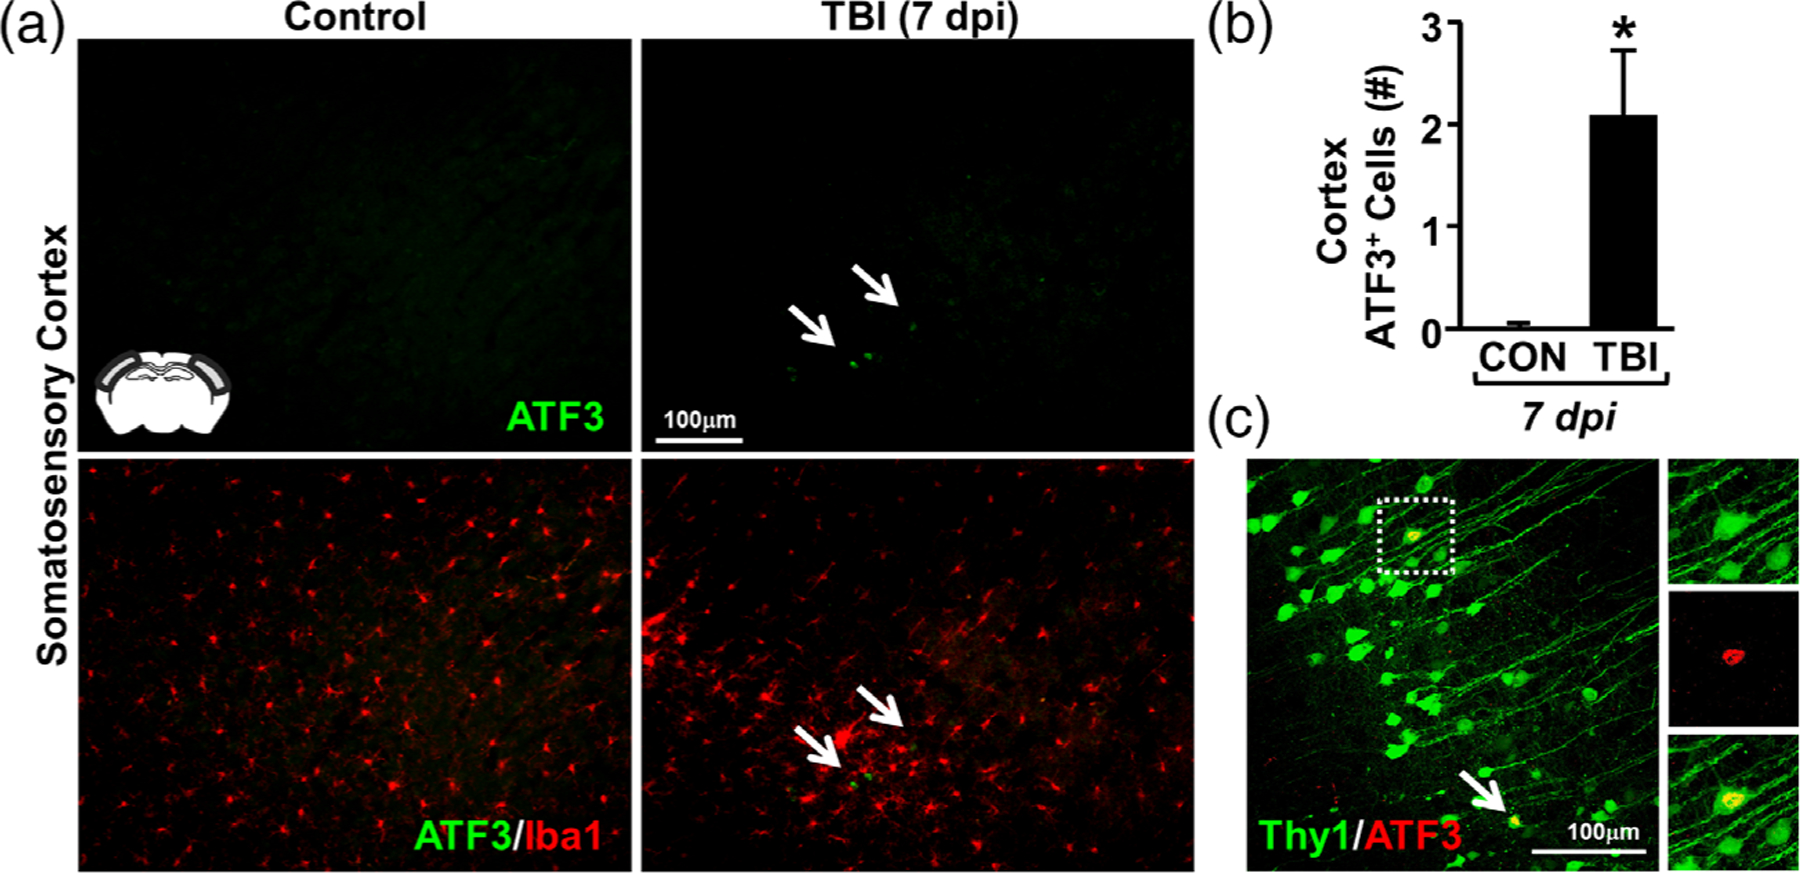
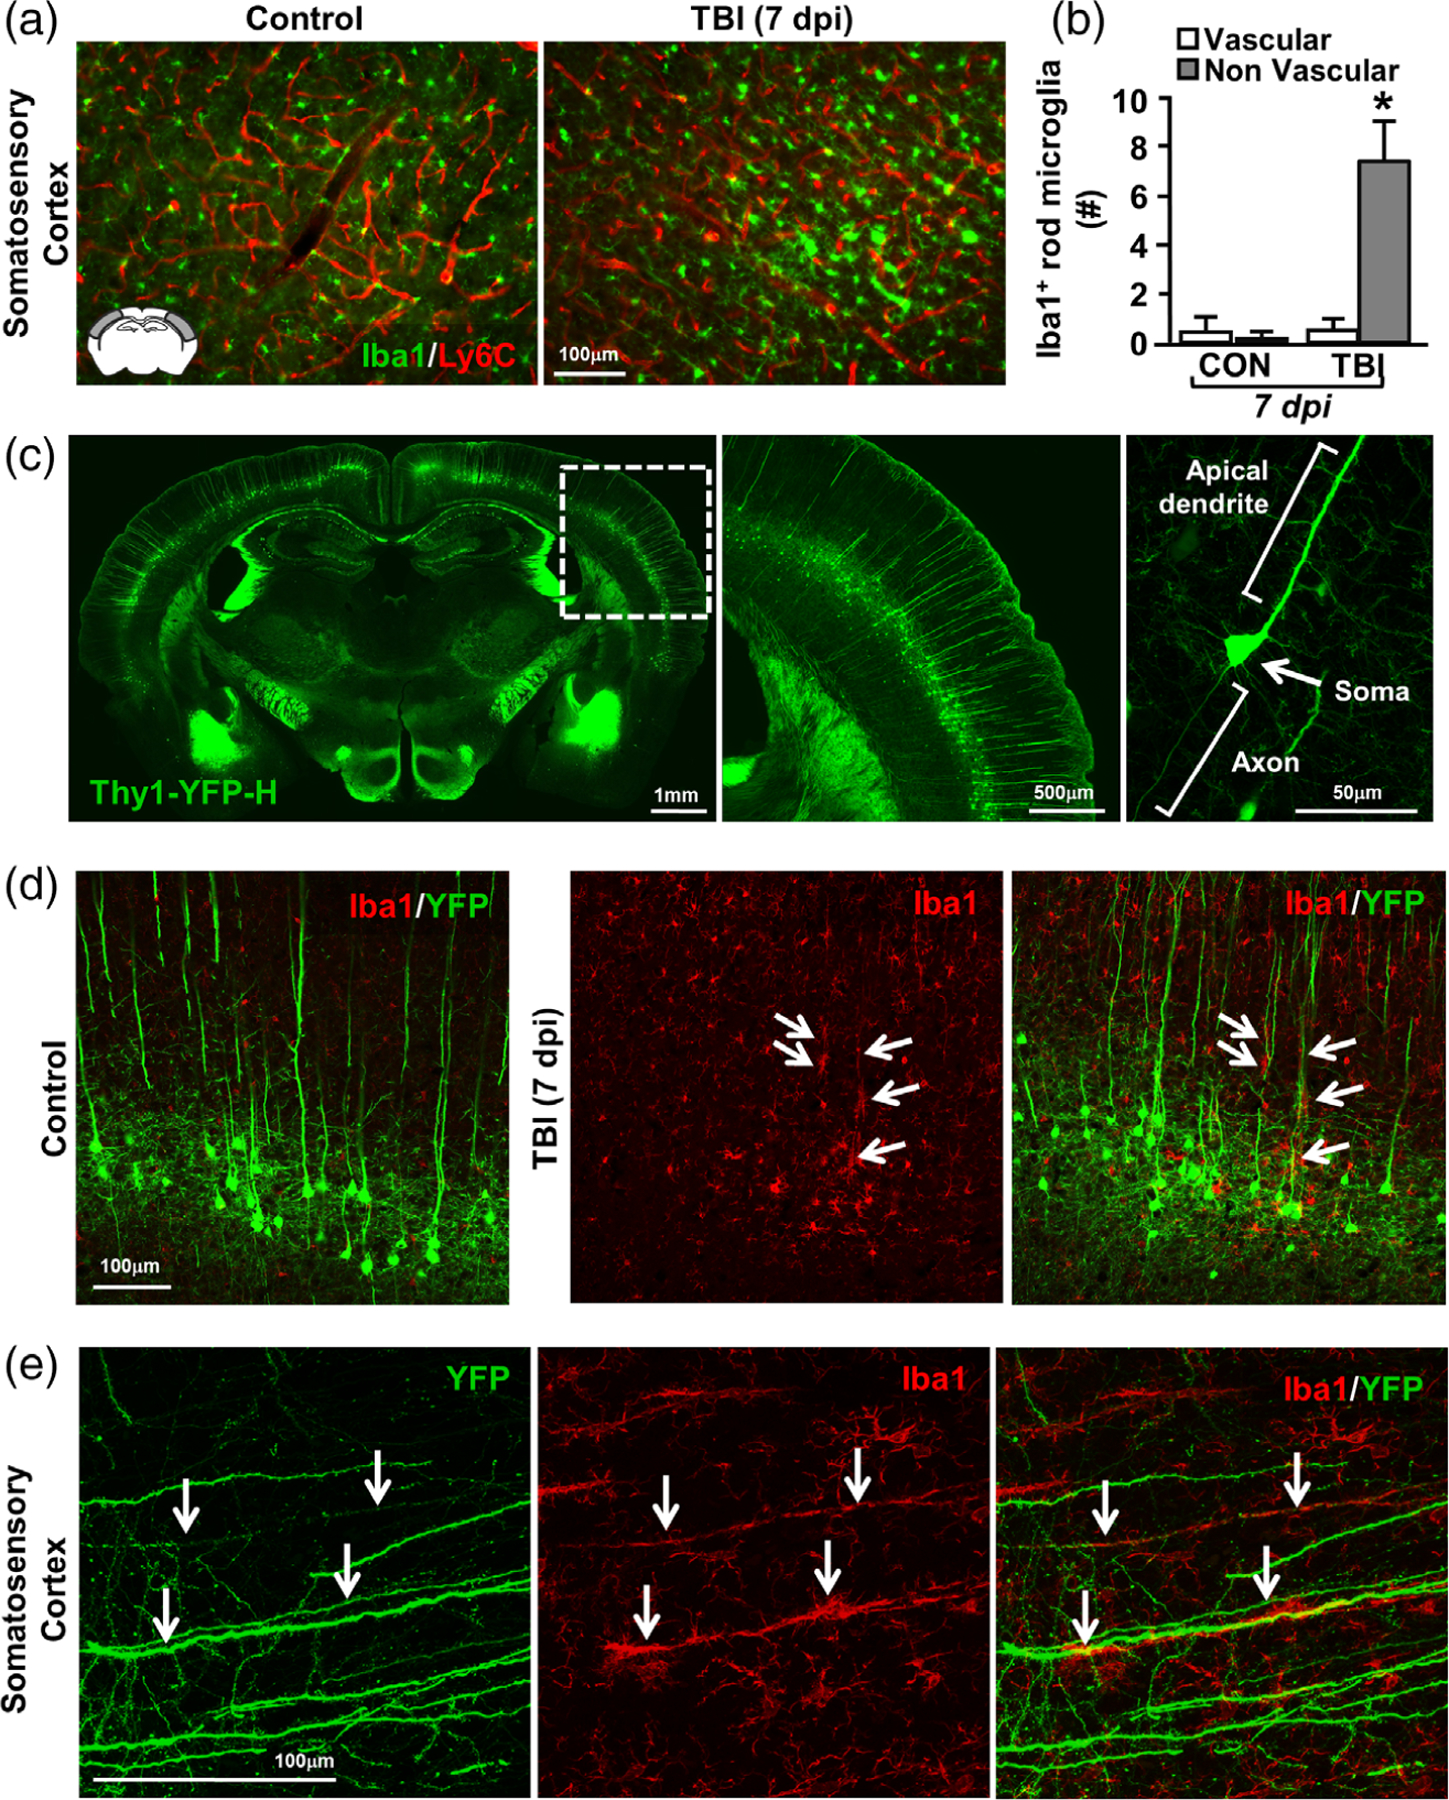
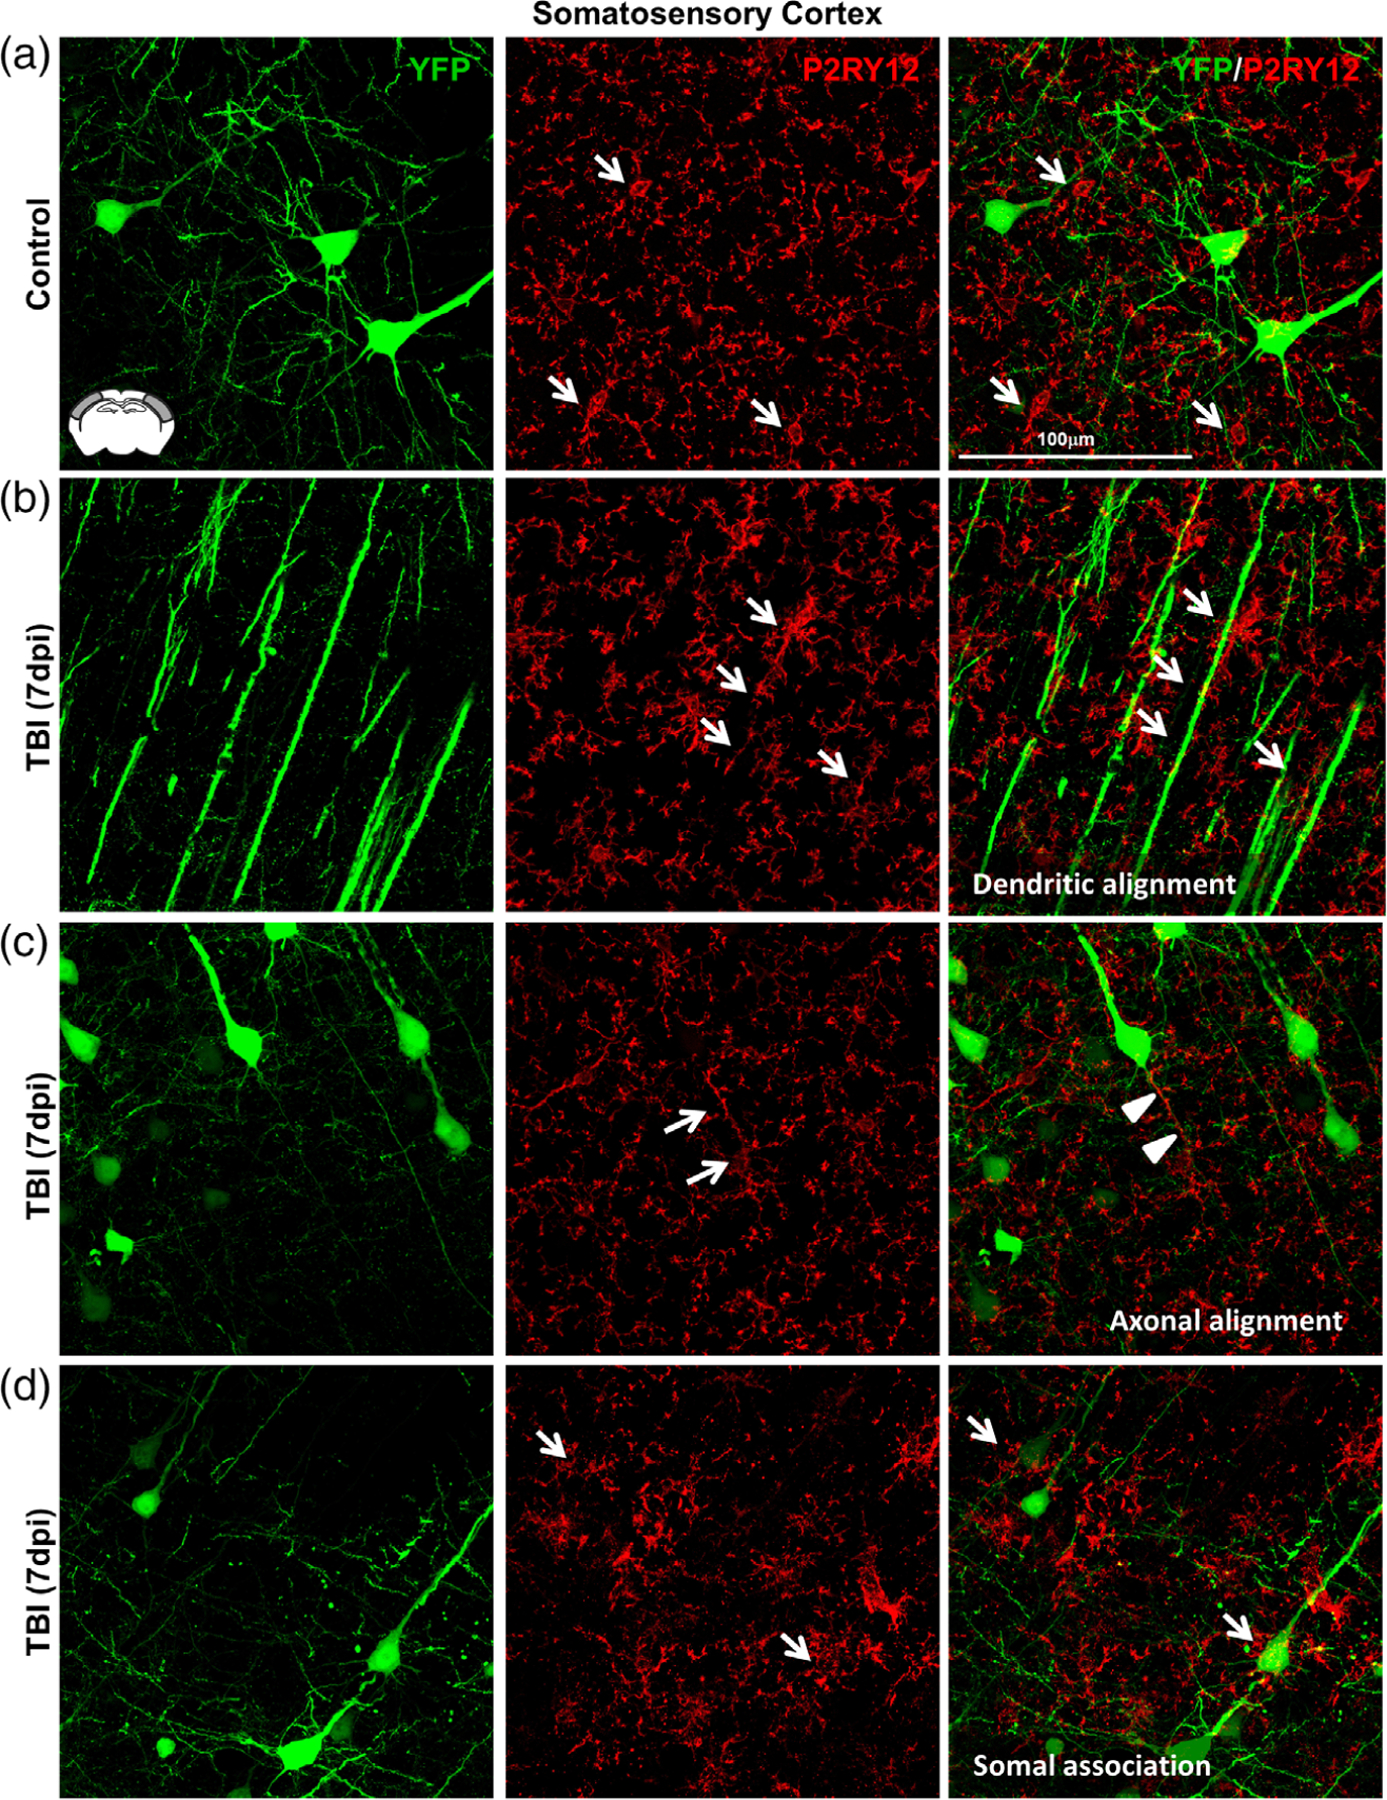
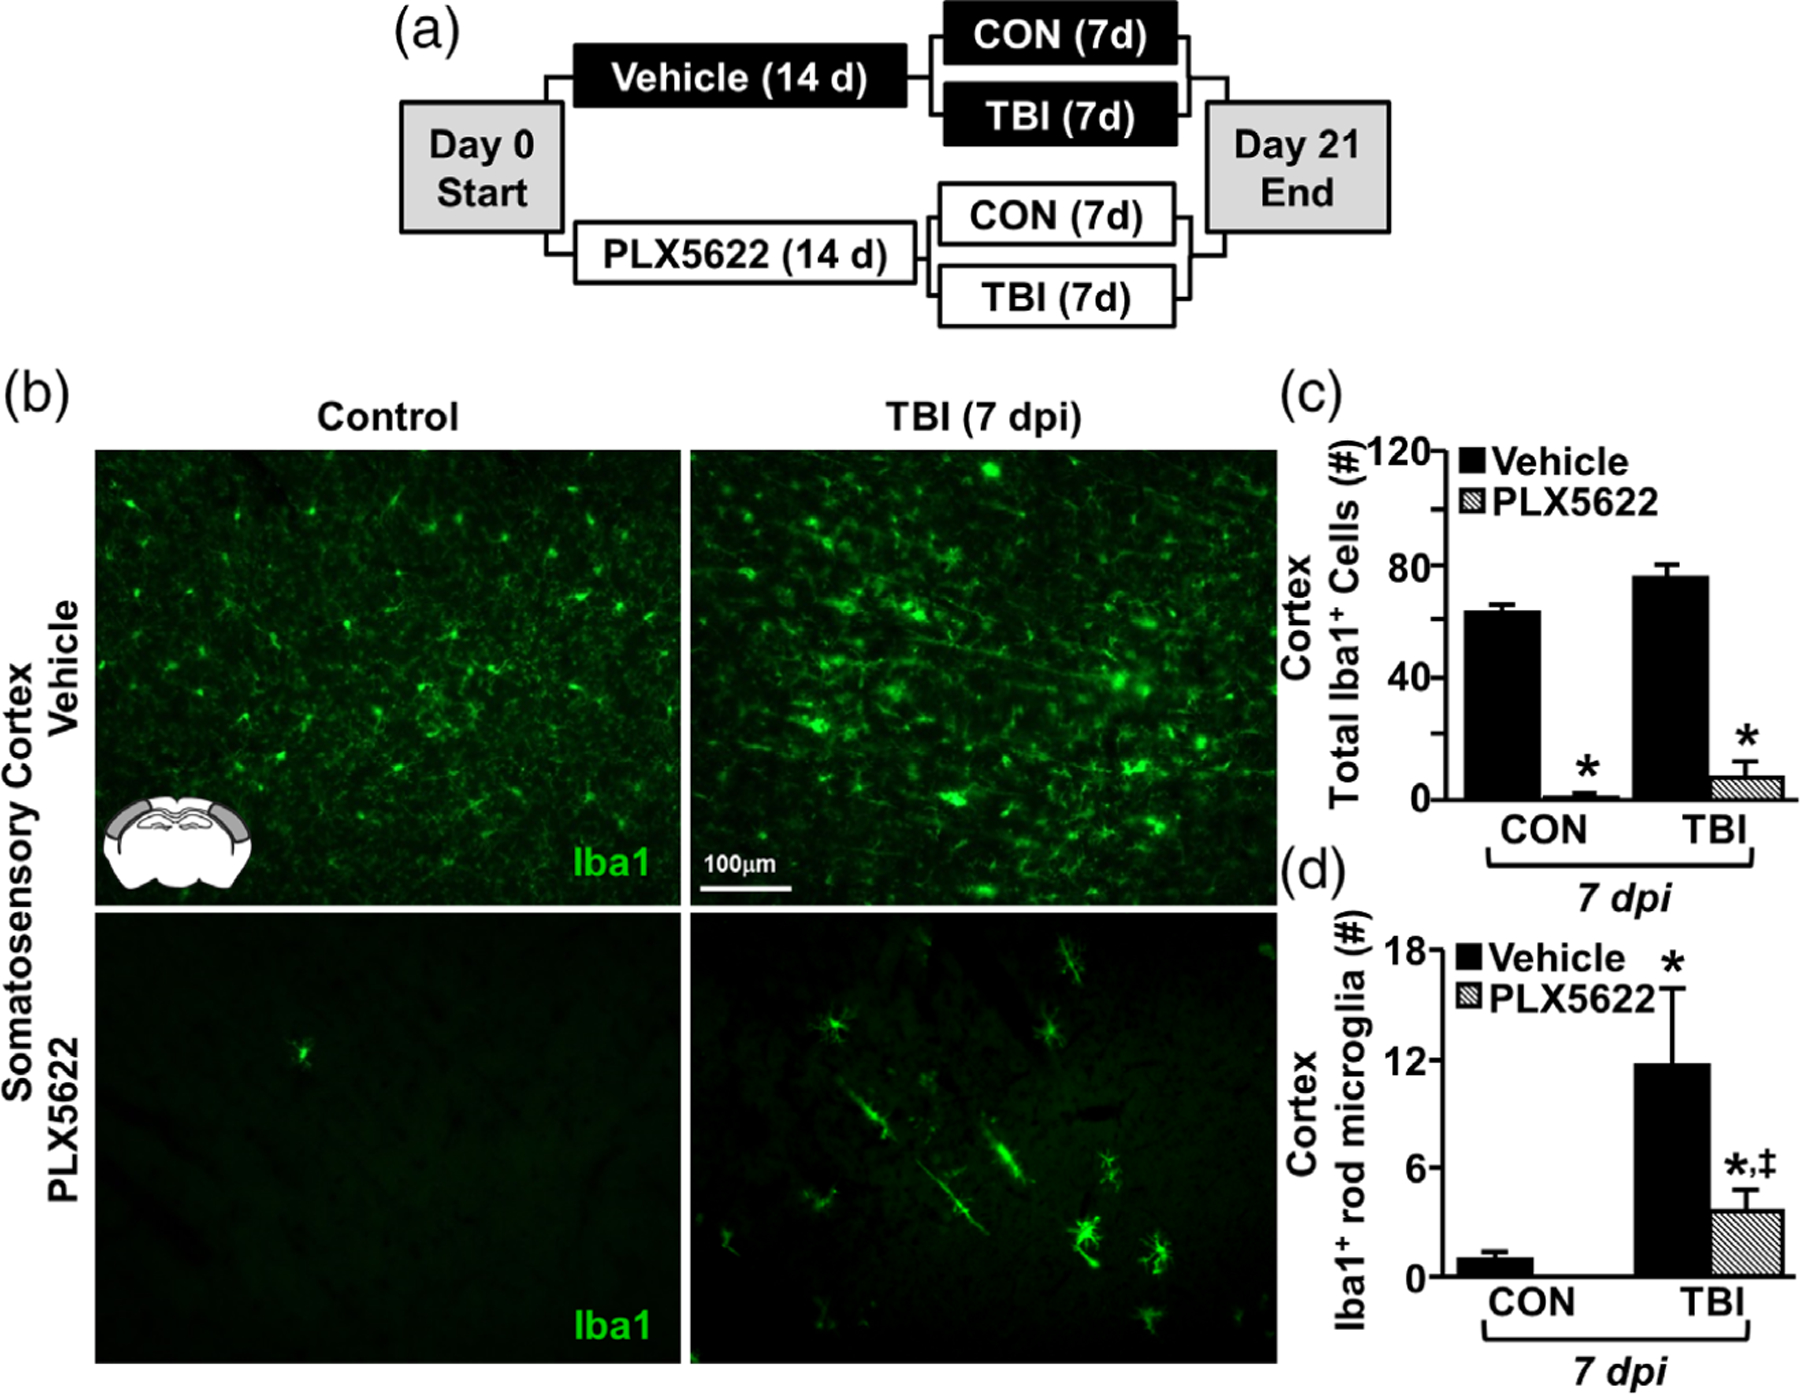
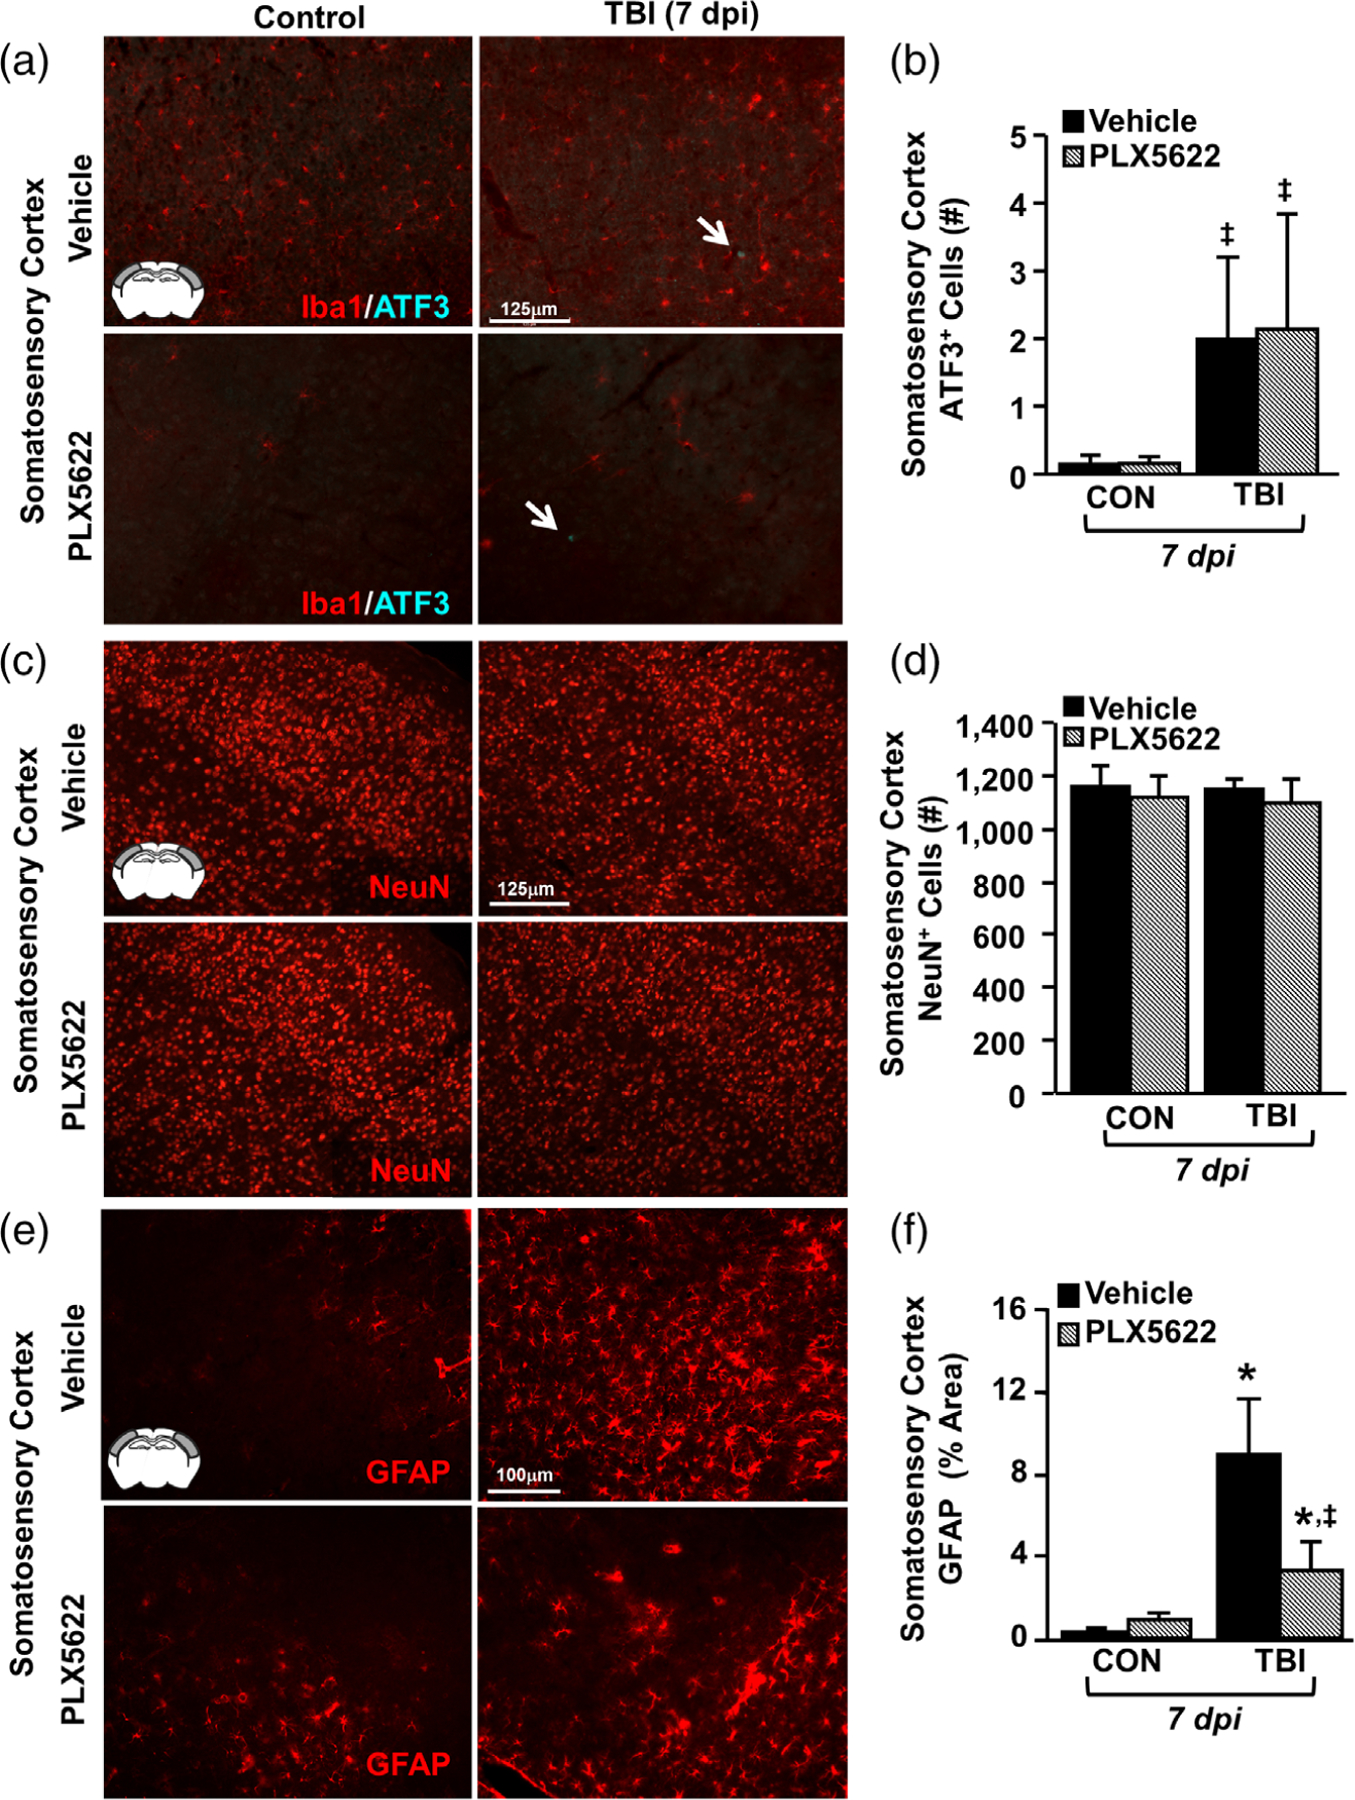
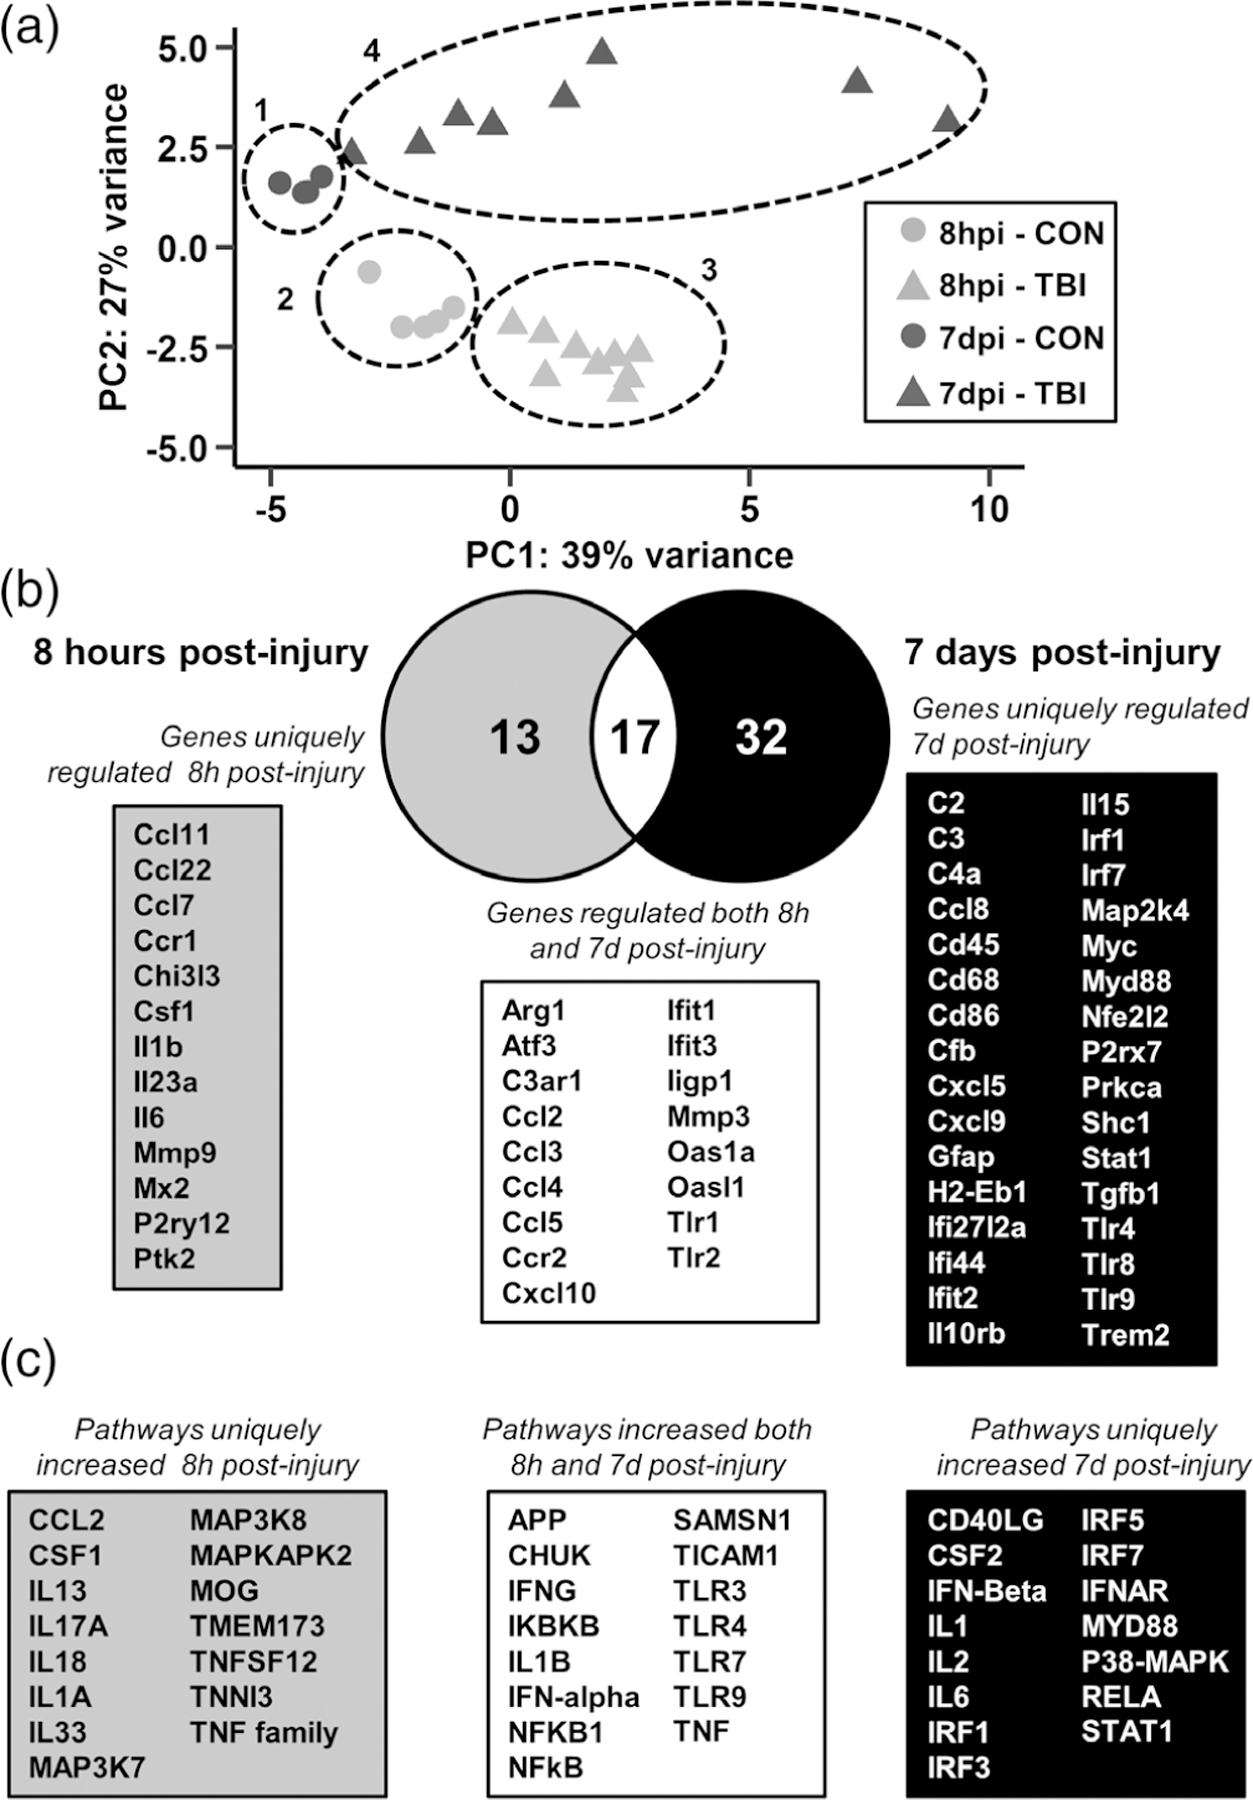
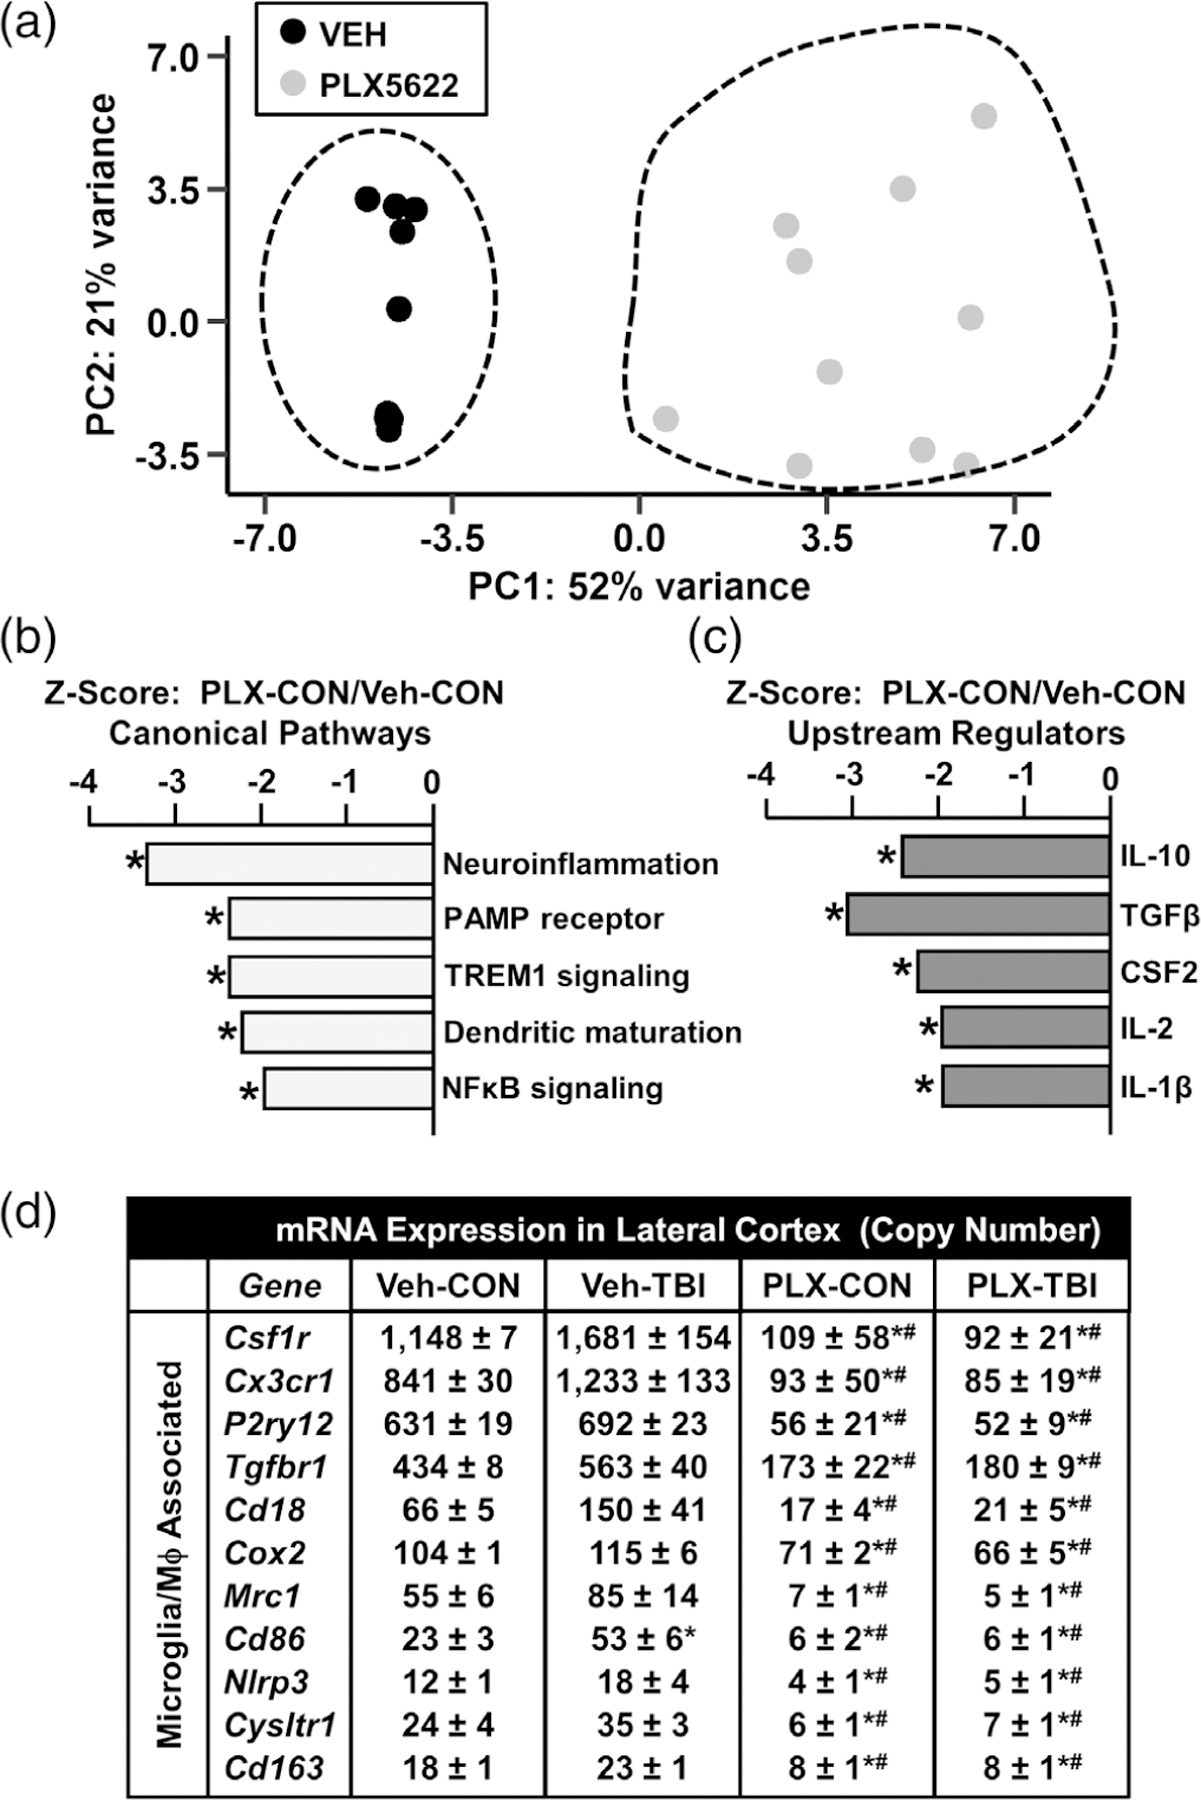
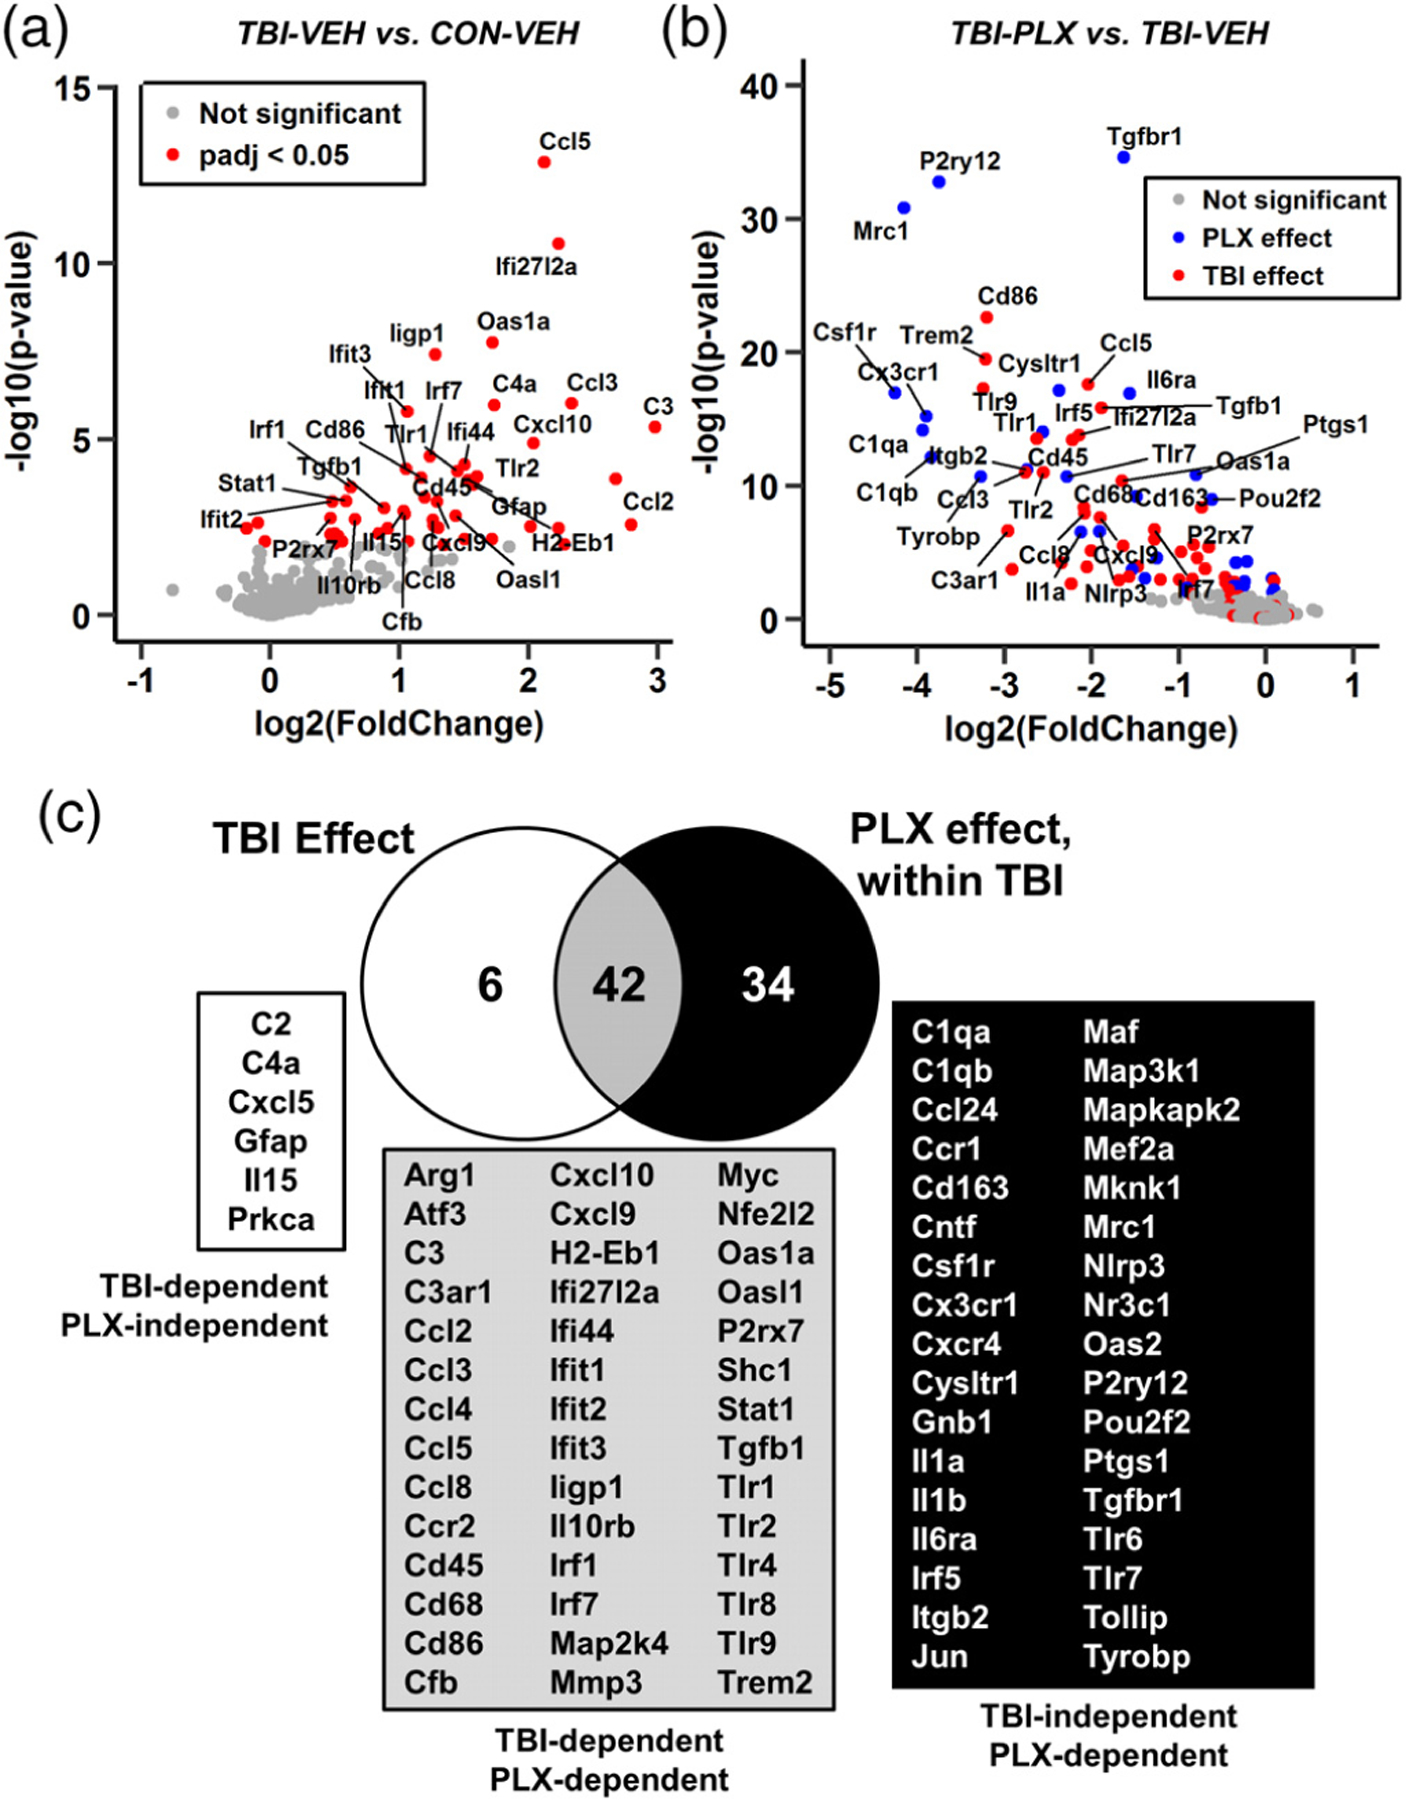
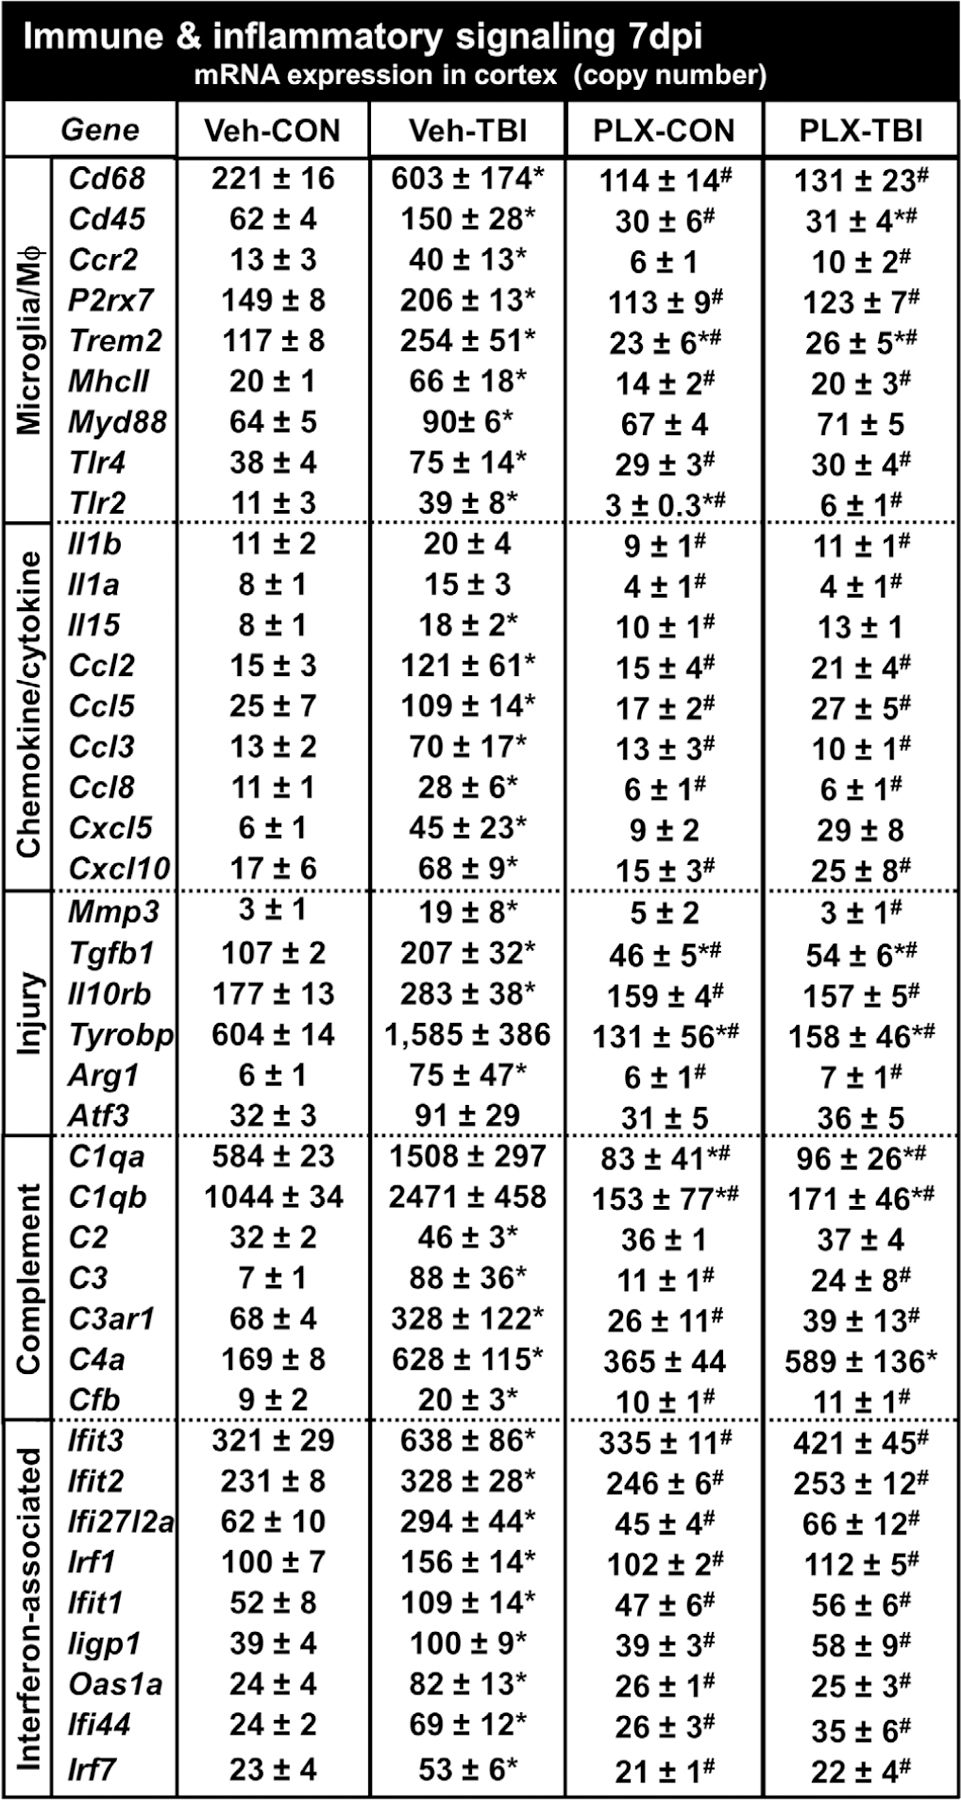
Microglia undergo dynamic structural and transcriptional changes during the immune response to traumatic brain injury (TBI). For example, TBI causes microglia to form rod-shaped trains in the cerebral cortex, but their contribution to inflammation and pathophysiology is unclear. The purpose of this study was to determine the origin and alignment of rod microglia and to determine the role of microglia in propagating persistent cortical inflammation. Here, diffuse TBI in mice was modeled by midline fluid percussion injury (FPI). Bone marrow chimerism and BrdU pulse-chase experiments revealed that rod microglia derived from resident microglia with limited proliferation. Novel data also show that TBI-induced rod microglia were proximal to axotomized neurons, spatially overlapped with dense astrogliosis, and aligned with apical pyramidal dendrites. Furthermore, rod microglia formed adjacent to hypertrophied microglia, which clustered among layer V pyramidal neurons. To better understand the contribution of microglia to cortical inflammation and injury, microglia were eliminated prior to TBI by CSF1R antagonism (PLX5622). Microglial elimination did not affect cortical neuron axotomy induced by TBI, but attenuated rod microglial formation and astrogliosis. Analysis of 262 immune genes revealed that TBI caused profound cortical inflammation acutely (8 hr) that progressed in nature and complexity by 7 dpi. For instance, gene expression related to complement, phagocytosis, toll-like receptor signaling, and interferon response were increased 7 dpi. Critically, these acute and chronic inflammatory responses were prevented by microglial elimination. Taken together, TBI-induced neuronal injury causes microglia to structurally associate with neurons, augment astrogliosis, and propagate diverse and persistent inflammatory/immune signaling pathways.

Keywords: CSF1R antagonist; astrocytes; fluid percussion injury; microglia; neuroinflammation; traumatic brain injury.


Conflict of interest statement

The authors declare no competing financial interests.

Figures

FIGURE 1
FIGURE 1
Diffuse TBI caused formation of rod-shaped microglia in the somatosensory cortex 7 dpi. Adult C57BL/6 mice were uninjured (control) or were subjected to midline fluid percussion injury (TBI). At 7 days post-injury (dpi), brains were perfused, fixed, sectioned, and labeled for Iba1. (a) Representative images of Iba1 labeling (20×) in the lateral cortex of control and TBI mice. Inset shows the brain region used for analysis. (b) Representative image (40×) of Iba1+ rod microglia after TBI. (c) Percent-area of Iba1 labeling in the cortex 7 dpi (n = 5). (d) Number of Iba1+ rod microglia per 20× field in the cortex (n = 5). (e) Representative image of merged Iba1 (red) and DAPI (blue) labeling in the somatosensory cortex 7 dpi. (f ) Representative confocal image of Iba1+/DAPI+ rod microglia aligned linearly. Arrows highlight that several separate microglia align to form a “train” of rod microglia. In a separate experiment, mice were uninjured (control) or were subjected to midline fluid percussion injury. (g) At 3 or 7 dpi, RNA was collected from the cortex and mRNA levels of several genes were determined (n = 4). These genes are associated with microglia/macrophages (Ccr2, Ccl2, Trem2, Cd45, Cd68, MhcII), neurons (Cx3cl1, Atf3, Csf1), or astrocytes (Gfap, S100β, Vimentin). Graphs represent mean ± SEM. Means with (*) are significantly different from controls (p < .05) and means with (‡) tend to be different from controls (p = .06–.10)
FIGURE 2
FIGURE 2
Resident microglia formed rod microglia in the somatosensory cortex following TBI. Adult C57BL/6 mice were uninjured (control) or were subjected to midline fluid percussion injury (TBI). At 7 days postinjury (dpi), brains were perfused, fixed, sectioned, and labeled for Iba1. (a) Representative merged images of Iba1 (green) and CD45 (red) labeling (20×) from the somatosensory of control and TBI mice. Arrows show cells that are both Iba1+ and CD45+. (b) Percent-area of CD45 labeling in the cortex (n = 3). (c) Percent-area of double-positive Iba1 and CD45 labeling (n = 3). (d) In a separate experiment, green fluorescent protein (GFP) bone marrow (BM) chimeras were established by chemical BM ablation and engraftment of GFP+ bone marrow cells. GFP+ BM-chimera mice were sham-injured (controls) or subjected to TBI. At 7 dpi, brains were removed, post-fixed, sectioned, and labeled with Iba1. (e) Representative merged images (20×) of Iba1 labeling and GFP expression in the somatosensory cortex of control and TBI mice. (f ) Number of Iba1+/GFPneg and Iba1+/GFP+ rod microglia in the somatosensory cortex control and TBI mice (n = 6). Bars represent the mean ± SEM. Means with (*) are significantly different from controls (p < .05)
FIGURE 3
FIGURE 3
TBI-induced formation of rod microglia was associated with limited microglial proliferation. Adult C57BL/6 mice were uninjured (control) or were subjected to midline fluid percussion injury (TBI). Following TBI, mice were provided ad libitum access to drinking water containing 0.8 mg/ml 5-bromo-2-deoxyuridine (BrdU) for 7 days. Mice were also injected with BrdU (50 mg/kg) at 0900 and 1400 (light phase). At 7 days postinjury (dpi), brains were perfused, fixed, sectioned, and labeled for Iba1 and BrdU. (a) Representative images of BrdU labeling (20×) in the somatosensory cortex of control and TBI mice. Inset indicates region used for analysis. (b) Percent-area of BrdU labeling in the somatosensory cortex (n = 4). (c) Representative images (20×) of Iba1 labeling (top) and merged BrdU labeling (bottom). Arrows highlight the Iba+/BrdU+ rod microglia. (d) Number of Iba1+ rod microglia that were either BrdU+ or BrdUneg (n = 3). Bars represent mean ± SEM. Means with (*) are significantly different from controls (p < .05) and means with (‡) tend to be different from controls (p = .1)
FIGURE 4
FIGURE 4
TBI-induced formation of rod microglia was spatially associated with astrogliosis. Adult C57BL/6 mice were uninjured (control) or were subjected to midline fluid percussion injury (TBI). At 7 dpi, brains were perfused, fixed, sectioned, and labeled for Iba1 (green) and GFAP (red). (a) Representative image of Iba1 (top), GFAP (middle), and merged (bottom) labeling from the somatosensory cortex of control and TBI mice either with (center) or without (right) rod microglia. (b) Percent-area of GFAP labeling in the cortex (n = 4). (c) Linear regression (R2 = 0.44) of GFAP+ area and the number of Iba1+ rod microglia per 20× field (n = 4). d) Post-hoc quantification of GFAP+ area (percent) in the presence of rod microglia (<15 or >15 rod microglia, n = 28 images). Bars represent the mean ± SEM. Means with (*) are significantly different from controls (p < .05)
FIGURE 5
FIGURE 5
Rod microglia formed in close proximity to ATF3+ neurons in the somatosensory cortex after TBI. Adult C57BL/6 mice were uninjured (control) or were subjected to midline fluid percussion injury (TBI). At 7 dpi, brains were perfused, fixed, sectioned, and labeled for activating transcription factor 3 (ATF3, green) and Iba1 (red). (a) Representative images (20×) of ATF3 labeling (top) and merged images of ATF3 and Iba1 labeling (bottom). Inset indicates region used for analysis. Arrows highlights clustering of ATF3+ cells in the cortex 7 dpi. (b) Number of ATF3+ cells per 20× field in the somatosensory cortex of mice subjected to control or TBI (n = 4). (c) Representative confocal image (40×) shows Thy1-YFP+/ATF3+ neurons in the somatosensory cortex 7 dpi. Arrow highlights ATF3+ neuron and inset shows single-color images of YFP+/ATF3+ neuron. Bars represent the mean ± SEM. Means with (*) are significantly different from controls (p < .05)
FIGURE 6
FIGURE 6
Rod microglia aligned with apical dendrites of injured neurons after TBI. Adult C57BL/6 mice were uninjured (control) or were subjected to midline fluid percussion injury (TBI). At 7 dpi, brains were perfused, fixed, sectioned, and labeled for Iba1 (green) and Ly6C (vasculature, red). (a) Representative merged images of Iba1 and Ly6C labeling in mice subjected to control or TBI. Inset indicates region used for analysis. (b) Number of Iba1+ rod microglia that were aligned with Ly6C+ vasculature or not. Bars represent the mean ± SEM. Means with (*) are significantly different from controls. In a separate experiment, Thy1-YFP-H mice were used to visualize the interaction between neurons and rod microglia. Bars represent the mean ± SEM. Means with (*) are significantly different from controls. (c) Representative images of control Thy1-YFP-H mice showing whole brain distribution of YFP (left), inset showing cortical distribution (middle), and detail of a single neuron (right). Next, Thy1-YFP-H mice were uninjured (control) or were subjected to midline fluid percussion injury (TBI). At 7 dpi, brains were perfused, fixed, sectioned, and labeled for 1ba-1. (d) Representative images (20×) of Iba1 (red) and YFP expression (green) from the somatosensory cortex of control and TBI mice 7 dpi. (e) Representative merged images (63×) of Iba1 (red) and YFP expression (green) from the somatosensory cortex of TBI mice 7 dpi. Arrows highlight Iba1+ rod microglia aligned with YFP+ apical dendrites
FIGURE 7
FIGURE 7
Microglia–neuronal interactions were heterogeneous in the somatosensory cortex 7 dpi. Thy1-YFP-H mice were uninjured (control) or were subjected to midline fluid percussion injury (TBI). At 7 dpi, brains were perfused, fixed, sectioned, and labeled for P2RY12 (red). Confocal imaging was used to visualize P2RY12 labeling and YFP expression (green). (a) Representative merged images (63×) of P2RY12 (red) and YFP expression (green) from the somatosensory cortex of control mice. Arrows show small P2RY12+ microglia (arrows) near YFP+ neurons. (b) Representative merged images (63×) of P2RY12 (red) and YFP expression (green) from the somatosensory cortex of TBI mice 7 days after injury. Arrows depict the alignment of P2RY12+ rod microglia with YFP+ apical dendrites. (c) Representative merged images (63×) of P2RY12 (red) and YFP expression (green) from the somatosensory cortex of TBI mice 7 days after injury. Arrows highlight rod microglia aligned with YFP+ axons of pyramidal neurons. (d) Representative merged images (63×) of P2RY12 (red) and YFP expression (green) from the somatosensory cortex of TBI mice 7 days after injury. Arrows denote microglia surrounding the soma of YFP+ neurons in cortical layer V
FIGURE 8
FIGURE 8
Elimination of microglia with the CSF1R antagonist PLX5622 attenuated rod microglial formation in the somatosensory cortex after TBI. (a) Adult C57BL/6 mice were provided diets formulated with either vehicle (Veh) or PLX5622 (PLX) for 14 days. Next, mice were uninjured (control) or were subjected to midline fluid percussion injury (TBI). At 7 dpi (21d of Veh or PLX diet), brains were perfused, fixed, sectioned, and labeled for 1ba1 (green). (b) Representative images of Iba1 labeling (20×) in the somatosensory cortex 7 dpi. Inset indicates region used for analysis. (c) Total number of Iba1+ cells per 20× field in the somatosensory cortex of mice subjected to control or TBI on Veh or PLX diet (n = 4). (d) Number of Iba1+ rod microglia per 20× field in the somatosensory cortex of mice subjected to control or TBI on Veh or PLX diet (n = 4). Bars represent the mean ± SEM. Means with (*) are significantly different from controls
FIGURE 9
FIGURE 9
Elimination of microglia did not affect neuronal damage after TBI but attenuated astrogliosis. Adult C57BL/6 mice were provided diets formulated with either vehicle or PLX5622 for 14 days. Next, mice were uninjured (control) or were subjected to midline fluid percussion injury (TBI). At 7 dpi (21d of Veh or PLX diet), brains were perfused, fixed, sectioned, and labeled for 1ba1, ATF3, NeuN, or GFAP. (a) Representative merged images of Iba1 (red) and ATF3 (cyan) labeling (20×) in the somatosensory cortex 7 dpi. Inset indicates region used for analysis. (b) Number of ATF3+ cells per 20× field in the somatosensory cortex 7 dpi (n = 4). Arrow indicates an ATF3+ cell. (c) Representative images of NeuN labeling (20×) in the somatosensory cortex 7 dpi. (d) Number of NeuN+ cells per 20× field in the somatosensory cortex 7 dpi (n = 4). (e) Representative images of GFAP labeling (20×) in the somatosensory cortex 7 dpi. (f ) Percent-area of GFAP labeling in the somatosensory cortex 7 dpi (n = 4). Bars represent the mean ± SEM. Means with (*) are significantly different from Veh-CON (p < .05) and means with (‡) tend to be different than Veh-CON (p = .06)
FIGURE 10
FIGURE 10
Distinct inflammatory pathways remained elevated in the lateral cortex 7 dpi compared to 8 hpi. Adult C57BL/6 mice were provided diets formulated with either vehicle or PLX5622 for 14 days. Next, mice were sham-injured (CON) or were subjected to midline fluid percussion injury (TBI). At either 8 hpi or 7 dpi (14–21 days of Veh or PLX diet), the cortex was dissected, flash-frozen, and RNA was extracted. mRNA copy number of 262 genes was determined by NanoString nCounter mouse inflammation v2 panel plus. (a) Principle component analysis of mice fed vehicle diet and sacrificed either 8 hr or 7 days postinjury (8 hpi-CON, 8 hpi-TBI, 7 dpi-CON, and 7 dpi-TBI). Circles denote sample clustering. (a) Differentially expressed gene lists for the 8hpi-TBI versus 8hpi-CON and 7dpi-TBI versus 7dpi-CON comparisons were compared by Venn diagram. (c) Differentially expressed genes for each comparison were used for Ingenuity Pathway Analysis (IPA) and the top 30 increased upstream regulators at 8 hpi, 7 dpi, or both are shown
FIGURE 11
FIGURE 11
Distinct inflammatory signaling pathways were ablated in the lateral cortex by microglial elimination. As above, mice were provided diets formulated with either vehicle or PLX5622 for 14 days. Next, mice were sham-injured (control) or were subjected to midline fluid percussion injury (TBI). At either 8 hpi or 7 dpi (14–21 days of Veh or PLX diet), the cortex was dissected, flash-frozen, and RNA was extracted. mRNA copy number of 262 genes was determined by NanoString nCounter mouse inflammation v2 panel plus. (a) Principle component analysis of control mice fed either vehicle or PLX5622. Ingenuity Pathway Analysis (IPA) was used to determine significantly altered (b) canonical pathways and (c) upstream regulators for differentially expressed genes in the PLX-CON versus Veh-CON comparison 7 dpi. Bars represent pathway z-score and (*) denotes p < .05. (d) mRNA counts for genes associated with microglia/macrophages from the cortex 7 dpi. Data are presented as mean copy number ± SEM. Means with (*) are significantly different from Veh-CON (p-adj < .05) and means with (#) are significantly different from Veh-TBI (p-adj < .05)
FIGURE 12
FIGURE 12
Inflammatory gene expression in the lateral cortex was influenced by TBI and PLX. Adult C57BL/6 mice were provided diets formulated with either vehicle or PLX5622 for 14 days. Next, mice were sham-injured (control) or were subjected to midline fluid percussion injury (TBI). At 7 dpi (21 days of Veh or PLX diet), the cortex was dissected, flash-frozen, and RNA was extracted. mRNA copy number of 262 genes was determined by NanoString nCounter mouse inflammation v2 panel (n = 4–8). a) Volcano plot of mRNA counts from Veh-TBI versus Veh-CON comparisons. Red points indicate genes with significant differential expression (p-adj < .05). (b) Volcano plot of mRNA counts from PLX-TBI versus Veh-TBI. Here, red points indicate genes increased by TBI (a) and blue points indicate other differentially expressed genes (p-adj < .05). (c) Venn diagram of differentially expressed genes in Veh-TBI versus Veh-CON and PLX-TBI versus Veh-TBI comparisons
FIGURE 13
FIGURE 13
Prolonged neuroinflammation after TBI (7 dpi) was abrogated by microglial elimination. As above, mice were provided diets formulated with either vehicle or PLX5622 for 14 days and were sham-injured (control) or were subjected to midline fluid percussion injury (TBI). At 7 dpi (21d of Veh or PLX diet), the cortex was dissected, flash-frozen, and RNA was extracted. mRNA copy number of 262 genes was determined by NanoString nCounter mouse inflammation v2 panel plus (n = 4–8). Genes associated with microglia, chemokines/cytokines, injury, complement, or interferon are represented. Data are presented as average copy number ± SEM. Means with (*) are different from Veh-CON (p-adj < .05) and means with means with (#) are significantly different from Veh-TBI (p-adj < .05)

Similar articles

Cited by

References

    1. Alway Y, Gould KR, Johnston L, McKenzie D, & Ponsford J (2016). A prospective examination of Axis I psychiatric disorders in the first 5 years following moderate to severe traumatic brain injury. Psychological Medicine, 46(6), 1331–1341. 10.1017/S0033291715002986 - DOI - PubMed
    1. Bachstetter AD, Ighodaro ET, Hassoun Y, Aldeiri D, Neltner JH, Patel E, … Nelson PT (2017). Rod-shaped microglia morphology is associated with aging in 2 human autopsy series. Neurobiology of Aging, 52, 98–105. 10.1016/j.neurobiolaging.2016.12.028 - DOI - PMC - PubMed
    1. Bachstetter AD, Rowe RK, Kaneko M, Goulding D, Lifshitz J, & Van Eldik LJ (2013). The p38alpha MAPK regulates microglial responsiveness to diffuse traumatic brain injury. The Journal of Neuroscience, 33(14), 6143–6153. 10.1523/JNEUROSCI.5399-12.2013 - DOI - PMC - PubMed
    1. Cherry JD, Tripodis Y, Alvarez VE, Huber B, Kiernan PT, Daneshvar DH, … Stein TD (2016). Microglial neuroinflammation contributes to tau accumulation in chronic traumatic encephalopathy. Acta Neuropathologica Communications, 4(1), 112 10.1186/s40478-016-0382-8 - DOI - PMC - PubMed
    1. Coughlin JM, Wang Y, Minn I, Bienko N, Ambinder EB, Xu X, … Pomper MG (2016). Imaging of glial cell activation and white matter integrity of brains of active and recently retired National Football League players. JAMA Neurology, 74(1), 67–74. - PMC - PubMed

Publication types

MeSH terms