. 2019 Jan;37(1):65-76.
doi: 10.1002/stem.2931. Epub 2018 Oct 31.

Step-Wise Chondrogenesis of Human Induced Pluripotent Stem Cells and Purification Via a Reporter Allele Generated by CRISPR-Cas9 Genome Editing

Affiliations

Step-Wise Chondrogenesis of Human Induced Pluripotent Stem Cells and Purification Via a Reporter Allele Generated by CRISPR-Cas9 Genome Editing

Shaunak S Adkar et al. Stem Cells. 2019 Jan.

Abstract

The differentiation of human induced pluripotent stem cells (hiPSCs) to prescribed cell fates enables the engineering of patient-specific tissue types, such as hyaline cartilage, for applications in regenerative medicine, disease modeling, and drug screening. In many cases, however, these differentiation approaches are poorly controlled and generate heterogeneous cell populations. Here, we demonstrate cartilaginous matrix production in three unique hiPSC lines using a robust and reproducible differentiation protocol. To purify chondroprogenitors (CPs) produced by this protocol, we engineered a COL2A1-GFP knock-in reporter hiPSC line by CRISPR-Cas9 genome editing. Purified CPs demonstrated an improved chondrogenic capacity compared with unselected populations. The ability to enrich for CPs and generate homogenous matrix without contaminating cell types will be essential for regenerative and disease modeling applications. Stem Cells 2019;37:65-76.

Keywords: CRISPR-Cas9; Chondrocyte; Chondrogenesis; Differentiation; Genome editing; iPSC.


Conflict of interest statement

Disclosure

V.W. and F. G. discloses employment/leadership position with Cytex Therapeutics Inc. All other authors declared not conflict of interest.

Figures

Figure 1.
Figure 1.. Chondrogenesis of hiPSCs through the Paraxial Mesoderm Lineage
(A) Stepwise of differentiation of hiPSCs toward of paraxial mesoderm and chondrocyte-like cells. Gene expression levels of major transcriptional factors for (B) Pluripotency, (C) Anterior PS, (D) Paraxial mesoderm, (E) Early somite, (F) Sclerotome, and (G) Chondroprogenitor cells. (H) Heat map of representative surface marker expression of hiPSC and Chondroprogenitor (CP) cells of RVR cell line. (B-G) n = 3–4 experiments per cell stages per cell line (N=3 lines). Mean ± SEM. One-way ANOVA for each cell line using differentiation stage as factor. *p < 0.05 and †p < 0.01 compared to hiPSC stage. For MSGN1 expression level at paraxial mesoderm stage, only the RVR-iPSC line is significantly different from its hiPSC stage. For ACAN expression level at chondroprogenitor stage, only RVR is not significantly different from its hiPSC stage. PS: primitive streak. Data points represent means and error bars signify SEM.
Figure 2.
Figure 2.. Pellet Culture Time Course of Unpurified CPs.
Gene Expression Profiles of (A)SOX9, (B) COL2A1, (C) ACAN, (D) COL1A1, and (E) COL10A1 and (F) GAG/DNA ratio of the pellets at various time points during 28 day chondrogenic pellet culture at various time points during 28 day chondrogenic pellet culture. n = 3–4 each time point per cell line. Mean ± SEM. One-way ANOVA for each cell line using differentiation stage as factor. *p < 0.05 and †p < 0.01 compared to hiPSC stage.
Figure 3.
Figure 3.. Type II Collagen and Glycosaminoglycan Content of Unpurified CP Pellet Culture.
Representative safranin-O (Saf-O) and Type II collagen staining images of day 28 pellets for (A) BJFF (B) ATCC, and (C) RVR cell line. (D) Human osteochondral tissue was used as positive control for both staining. The area of the white dash-square was magnified to reveal chondrocyte-like cell morphology within the pellet for each cell line. Scale bar = 0.4 mm and 0.2 mm for left and right panel, respectively.
Figure 4.
Figure 4.. CRISPR-Cas9 Mediated Knock-in of EGFP Reporter at the COL2A1 Locus in hiPSCs
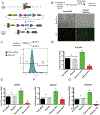
(A) Schematic depicting generation of the reporter line. A gRNA overlapping the COL2A1 stop codon directed Cas9 to generate a double-strand break, which was repaired with a targeting vector containing the 2A-EGFP reporter and a puromycin resistance cassette (PUROR) flanked by ~700 bp homology arms upstream and downstream of the stop codon. After selection of clones with Puromycin, a CRE recombinase expression plasmid was transfected to excise the PUROR cassette, leaving a residual loxP scar. (B) Brightfield and fluorescence imaging of reporter line after SOX9-mediated activation of COL2A1. Scale bar = 100 μm (C) FACS sorting of GFP+/− populations after COL2A1 activation in the reporter line and unmodified controls. (D) Fold-change of COL2A1 expression in unmodified, reporter, GFP+, and GFP-populations relative to expression in hiPSC controls. (E-G) Fold-change of chondrocyte markers (E) ACAN, (F) TRPV4, and (G) COL9A1 in unmodified, reporter, GFP+, and GFP-populations relative to expression in hiPSC controls. Groups not sharing the same letter are statistically different by one-way ANOVA (p<0.05). Error bars represent mean ± SEM (n=3 independent experiments). LHA, RHA: Left Homology Arm, Right Homology Arm
Figure 5.
Figure 5.. Time course of Directed Differentiation Applied to Reporter Line
(A) FACS sorting of GFP+/− population at several time points. Beginning at D6 the top (GFPtop) and bottom (GFPbottom) 10th percentiles of GFP+ cells were sorted (shaded orange and blue, respectively). (B) Differential COL2A1 transcript enrichment in various GFP populations over the course of differentiation. (C) Scatter plot showing correlation of COL2A1 transcript enrichment and change in mean fluorescence intensity (MFI) in GFPtop samples compared to MFI of undifferentiated population (r2 > 0.91, p<0.0001). Curves peripheral to trendline represent 95% confidence intervals. (D,E) Differential ACAN and SOX9 transcript enrichment in GFP populations over the course of differentiation. Two-way ANOVA with Tukey’s post hoc comparison for each chondrogenic marker demonstrated significance along both time and population factors (p<0.05). Asterisks (*) represent significant enrichment (p<0.05) of GFPhigh compared to each other population at a given time point. Error bars represent mean ± SEM (n=3 independent experiments).
Figure 6.
Figure 6.. Evaluation of Chondrogenic Differentiation Capacity of Purified Chondroprogenitors
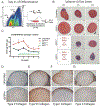
(A) Schematic of Experimental Design. D21 GFPhigh/low/mid populations were isolated and cultured as pellets or seeded for expansion. Pellets were generated from expanded cells at each passage up to 5 passages. (B) Safranin-O/Fast Green stain of pellets from unsorted and GFP populations after FACS (P0) and 1 or 2 passages (P1 and P2, respectively) Scale bar (200 μm) (C) Biochemical analysis of GAG content normalized to DNA content in unsorted and GFP populations. Two-way ANOVA with Tukey’s post hoc comparisons for each chondrogenic marker demonstrated significance along both time and population factor (p<0.05). Asterisks (*) represent significant enrichment (p<0.05) of GFPhigh compared to each other population at a given passage. Error bars represent mean ± SEM (n=3 independent experiments). (D-G) Type II Collagen (D), Type VI Collagen (E), and Type I Collagen (F), and Type X Collagen (G) immunohistochemistry (IHC) of pellets derived from unsorted cells and GFPhigh cells at P0-P5. Scale Bar (200 μm)

References

    1. van der Kraan PM, van den Berg WB. Chondrocyte hypertrophy and osteoarthritis: role in initiation and progression of cartilage degeneration? Osteoarthritis and Cartilage. 2012;20:223–32. - PubMed
    1. Tonge DP, Pearson MJ, Jones SW. The hallmarks of osteoarthritis and the potential to develop personalised disease-modifying pharmacological therapeutics Osteoarthritis and Cartilage. Elsevier Ltd; 2014;22:1–13. - PubMed
    1. Martel-Pelletier J, Barr AJ, Cicuttini FM, Conaghan PG, Cooper C, Goldring MB, et al. Osteoarthritis. Nat. Rev. Dis. Primers 2016;2:16072. - PubMed
    1. Katz J Total joint replacement in osteoarthritis. Best Pract Res Cl Rh. 2006;20:145–53. - PubMed
    1. Brittberg M, Lindahl A, Nilsson A, Ohlsson C, Isaksson O, Peterson L. Treatment of deep cartilage defects in the knee with autologous chondrocyte transplantation. N. Engl. J. Med 1994;331:889–95. - PubMed

Publication types