. 2019 Jan 1;121(1):61-73.
doi: 10.1152/jn.00329.2018. Epub 2018 Oct 31.

A muscle-activity-dependent gain between motor cortex and EMG

Affiliations

A muscle-activity-dependent gain between motor cortex and EMG

Stephanie Naufel et al. J Neurophysiol. .

Abstract

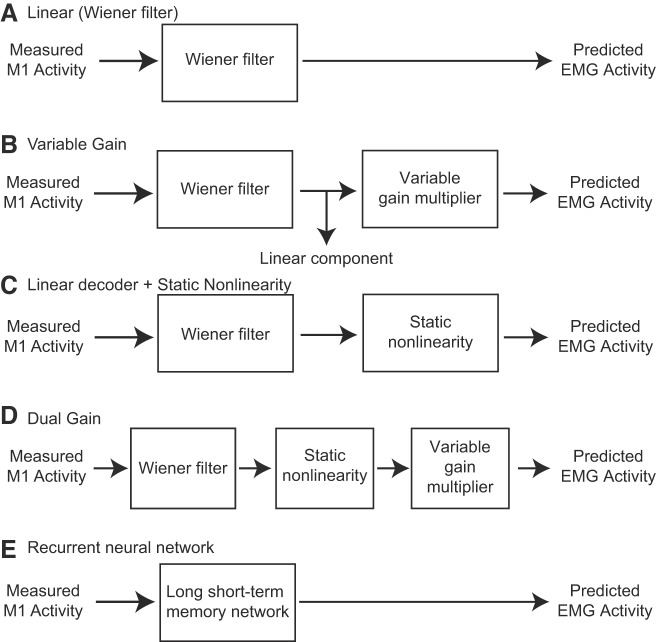
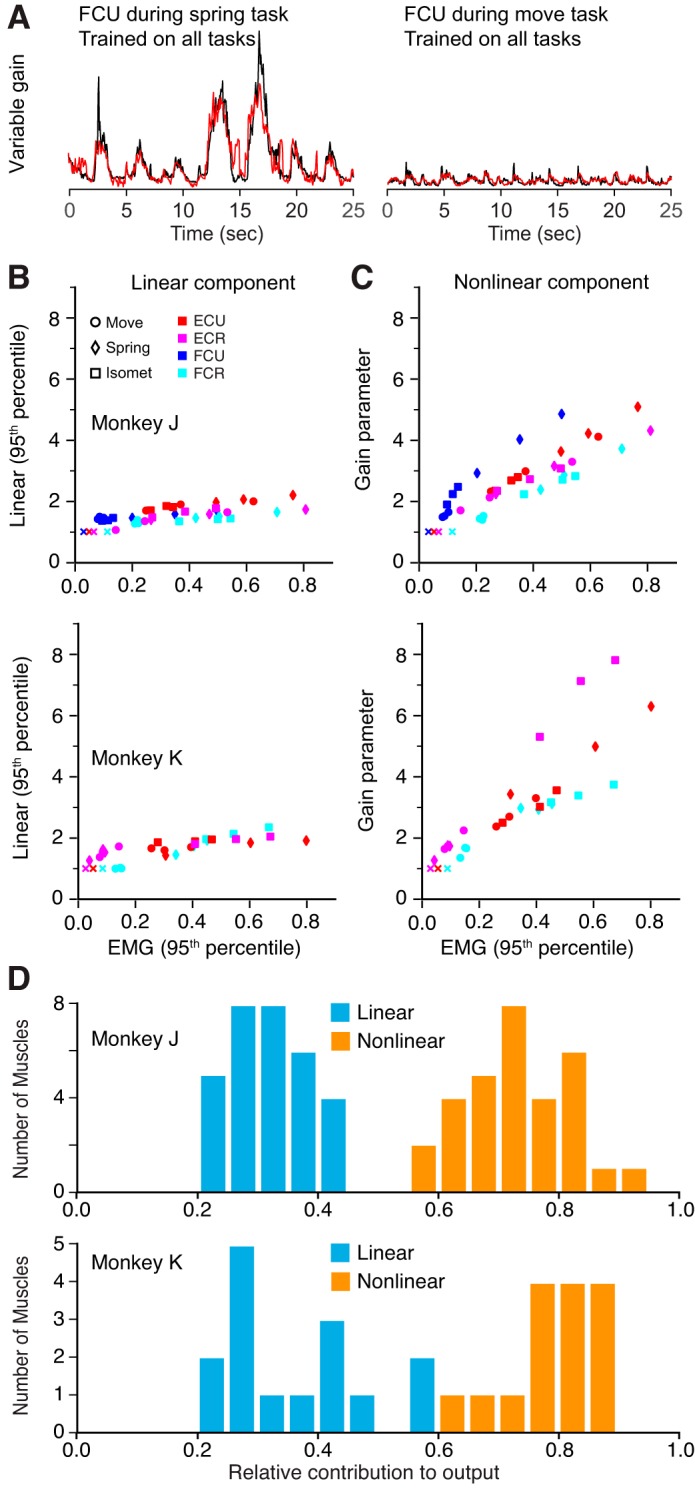
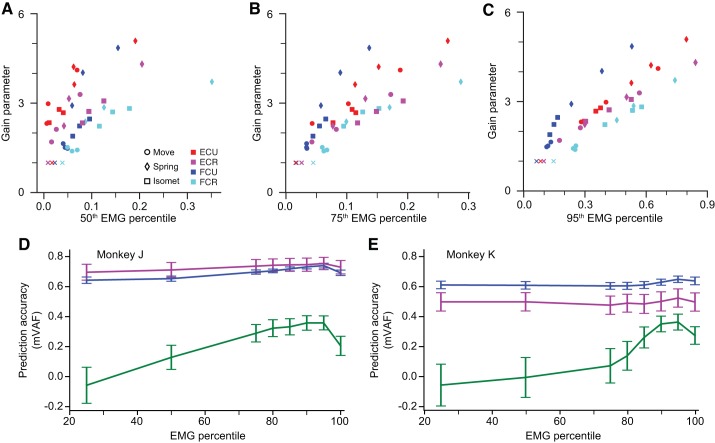
Whether one is delicately placing a contact lens on the surface of the eye or lifting a heavy weight from the floor, the motor system must produce a wide range of forces under different dynamical loads. How does the motor cortex, with neurons that have a limited activity range, function effectively under these widely varying conditions? In this study, we explored the interaction of activity in primary motor cortex (M1) and muscles (electromyograms, EMGs) of two male rhesus monkeys for wrist movements made during three tasks requiring different dynamical loads and forces. Despite traditionally providing adequate predictions in single tasks, in our experiments, a single linear model failed to account for the relation between M1 activity and EMG across conditions. However, a model with a gain parameter that increased with the target force remained accurate across forces and dynamical loads. Surprisingly, this model showed that a greater proportion of EMG changes were explained by the nonlinear gain than the linear mapping from M1. In addition to its theoretical implications, the strength of this nonlinearity has important implications for brain-computer interfaces (BCIs). If BCI decoders are to be used to control movement dynamics (including interaction forces) directly, they will need to be nonlinear and include training data from broad data sets to function effectively across tasks. Our study reinforces the need to investigate neural control of movement across a wide range of conditions to understand its basic characteristics as well as translational implications. NEW & NOTEWORTHY We explored the motor cortex-to-electromyogram (EMG) mapping across a wide range of forces and loading conditions, which we found to be highly nonlinear. A greater proportion of EMG was explained by a nonlinear gain than a linear mapping. This nonlinearity allows motor cortex to control the wide range of forces encountered in the real world. These results unify earlier observations and inform the next-generation brain-computer interfaces that will control movement dynamics and interaction forces.

Keywords: brain-computer interface; decoder; force; monkey; movement.


Figures

Fig. 1.
Fig. 1.
Raw experimental data. Data were collected during 5 sequential spring task trials for both flexion and extension forces. Top: the raster plot displays normalized neural firing rates across all neurons (y-axis), with neurons primarily active during extension at the top and flexion at the bottom. Middle: corresponding electromyographic (EMG) activity during the task for all 4 of the wrist muscles [flexor carpi ulnaris (FCU), flexor carpi radialis (FCR), extensor carpi ulnaris (ECU), and extensor carpi radialis (ECR)] is also shown, colored to represent extension (red) and flexion (blue). Bottom: applied force and the appearance and disappearance of force targets (shown as open boxes). The vertical size of the open boxes corresponds to the upper and lower force limits of the target. The relative locations of all targets are indicated by closed squares at right.
Fig. 2.
Fig. 2.
Decoder diagrams. Block diagrams depict the general structure of the decoders used for data analysis. A: linear Wiener filter with no modifications. B: variable gain decoder that includes a gain multiplier determined either by the task and target or by the electromyographic (EMG) magnitude for a given trial. C: linear Wiener filter followed by a static nonlinearity, also known as a Wiener cascade. D: dual gain decoder, which includes the Wiener cascade in addition to a gain multiplier that is target specific. E: recurrent neural network, specifically a long short-term memory network. M1, primary motor cortex.
Fig. 3.
Fig. 3.
Cortical vs. muscle activity range. Average primary motor cortex (M1; ×) and electromyographic (EMG; ●) activity for the full range of targets for each task. EMG was averaged for either an extensor or flexor muscle when the monkey was holding in the corresponding targets, and M1 activity was averaged across the 10 most modulated neurons during either extension or flexion. The data were normalized relative to the values for the middle targets in extension (pink) and flexion (blue). The x-axis denotes the target, and the y-axis denotes the change in activity relative to the middle targets, which is set at 1. Black symbols indicate the corresponding activity in the center-hold period. For all tasks, the range of neural activity across targets was smaller for M1 neurons than for muscle activity.
Fig. 4.
Fig. 4.
Linear decoder performance. A: example of within-task predictions made for flexor carpi ulnaris (FCU) using the linear decoder. Predictions (red) from spring task data (left) and predictions from movement task data (right) are shown. The actual electromyographic (EMG) signal is shown in black. B: example of cross-task predictions for the FCU muscle. For comparison, these and all later examples use the same EMG data as those shown in A. Predictions made with a decoder trained on spring task data and tested on movement task data (left) and predictions made with a decoder trained on movement task data and tested on spring task data (right) are shown. Cyan traces show the best match for scaled versions of the predictions. C: example predictions for the FCU muscle using a linear decoder trained on all tasks. D: summary of predictions made from linear decoders trained using data from a single task (colored circles) or all tasks (black offset circles). The x-axis represents the tested task (M, movement; S, spring; I, isometric), and the colors depict the training task. Negative variance accounted for (VAF) results are depicted by symbols at the bottom of the graphs.
Fig. 5.
Fig. 5.
Variable gain decoder results. A: example predictions (red) and measured electromyography (EMG; black) using the variable gain decoder with task- and target-specific gain parameter. Both examples are the same as those in Fig. 4. B: linear component (95th percentile) for a given target/task plotted vs. the 95th percentile of EMG of that target/task. Each symbol represents a different target, including all task conditions, colored by muscle. For flexor muscles, only flexion targets were included, and for extension muscles, only extensor targets were included. The small × symbols near the origin indicate activity in the center-hold period (averaged across tasks), which was used to normalize the data. The top example is from a session with monkey J and the bottom example from a session with monkey K. C: gain parameter, the nonlinear component, plotted vs. the 95th percentile of EMG, normalized during the center-hold period. All conventions are the same as in B. D: from the model fits, we computed the proportion of the EMG change from center-hold to maximal EMG that was due to changes in the linear component (blue) and nonlinear gain (orange) across all muscles and sessions. Note that the relative contributions of the linear and nonlinear components do not sum exactly to 1 because they were calculated on the basis of 95th percentiles of EMG and the linear component.
Fig. 6.
Fig. 6.
Gain as a function of electromyogram (EMG) percentile. A–C: as in Fig. 4, we fit the variable gain decoder and analyzed how the nonlinear gain component changed across targets requiring different EMGs. We plotted gain parameters as a function of different percentiles of EMG magnitude for each task/target. All conventions are the same as in Fig. 5, B and C. The example session shown is the same as in the top panel in Fig. 5B. D and E: we fit decoders in which the gain for each trial was proportional to a particular percentile of the EMG magnitude (x-axis value) for that trial (see methods). The values for multivariate variance accounted for (mVAF) were computed on a held-out test set.
Fig. 7.
Fig. 7.
Dual gain decoder performance. A and B: comparison of the goodness of fit (multivariate variance accounted for, mVAF) on a held-out test set for several different decoders. “Linear” refers to the linear Wiener filter with no additional gain component (Fig. 2A). “Static” refers to a decoder with a linear Wiener filter followed by a static nonlinearity shared for all tasks/targets (Fig. 2C). “Variable” refers to the variable gain decoder, in which a linear Wiener filter that is shared for all tasks/targets is followed by a target-specific gain (Fig. 2B). “Dual” refers to the dual gain decoder, with the Wiener filter followed by a shared static nonlinearity followed by a target-specific gain (Fig. 2D). C: for an example session (same as the top row in Fig. 5B), we fit the dual gain decoder and plotted the gain associated with the static nonlinearity as a function of the linear component (the input to the static nonlinearity). The gain was defined as the output of the static nonlinearity divided by the input. For each muscle, values are normalized to the gain of the center-hold conditions. The initial x-value of each trace is the average linear component associated with the center-hold condition, and the final x-value of each trace is the 99th percentile of the linear component. D: target-specific gains as a function of the 95th percentile of the electromyogram (EMG) for that target for the same dual gain model fit in C. All conventions are the same as in Fig. 5C. E: histograms, across all sessions and muscles, for each monkey, of the relative change in gain for the static nonlinearity (blue) and the target-specific gain (orange). The relative change in gain describes the change from the center-hold to the maximum-EMG target relative to the change in the 95th percentile of EMG from the center-hold to the maximum-EMG target (see methods).
Fig. 8.
Fig. 8.
Performance of nonlinear long short-term memory (LSTM) cross-task predictions. A: lack of cross-task generalization. Conventions are as in Fig. 4A. B: the performance accuracy (multivariate variance accounted for, mVAF) for the LSTM decoder trained on one task and tested on another task. As in Fig. 4B, symbol colors represent the task used for training, with tested tasks separated across the x-axis. Note that decoders trained on the spring and isometric tasks and tested on the movement task had negative mVAF values, as shown at the bottom of the graphs.
Fig. 9.
Fig. 9.
Performance of linear and nonlinear decoders with weighted, multitask training. A: electromyogram (EMG) predictions of a task-weighted linear filter decoder (red) when trained on data from all tasks and tested on data from the spring (left) and movement (right) tasks. Actual EMG values are in black. B: same as A, but using a task-weighted long short-term memory (LSTM) decoder. C: the performance accuracy (multivariate variance accounted for, mVAF) of all decoders trained on all tasks (black) and tested on one task, for both the linear decoder (closed circles) and nonlinear LSTM (open circles). For reference, the colors (green, blue, pink) represent the performance when the decoder is trained and tested on the same task. In all panels, for the multitask decoder optimization, tasks are weighted inversely to their EMG variance so that tasks with small EMGs are not ignored.

Similar articles

Cited by

References

    1. Ajiboye AB, Willett FR, Young DR, Memberg WD, Murphy BA, Miller JP, Walter BL, Sweet JA, Hoyen HA, Keith MW, Peckham PH, Simeral JD, Donoghue JP, Hochberg LR, Kirsch RF. Restoration of reaching and grasping movements through brain-controlled muscle stimulation in a person with tetraplegia: a proof-of-concept demonstration. Lancet 389: 1821–1830, 2017. doi:10.1016/S0140-6736(17)30601-3. - DOI - PMC - PubMed
    1. Baker SN. The primate reticulospinal tract, hand function and functional recovery. J Physiol 589: 5603–5612, 2011. doi:10.1113/jphysiol.2011.215160. - DOI - PMC - PubMed
    1. Bouton CE, Shaikhouni A, Annetta NV, Bockbrader MA, Friedenberg DA, Nielson DM, Sharma G, Sederberg PB, Glenn BC, Mysiw WJ, Morgan AG, Deogaonkar M, Rezai AR. Restoring cortical control of functional movement in a human with quadriplegia. Nature 533: 247–250, 2016. doi:10.1038/nature17435. - DOI - PubMed
    1. Cheney PD, Fetz EE. Functional classes of primate corticomotoneuronal cells and their relation to active force. J Neurophysiol 44: 773–791, 1980. doi:10.1152/jn.1980.44.4.773. - DOI - PubMed
    1. Cherian A, Krucoff MO, Miller LE. Motor cortical prediction of EMG: evidence that a kinetic brain-machine interface may be robust across altered movement dynamics. J Neurophysiol 106: 564–575, 2011. doi:10.1152/jn.00553.2010. - DOI - PMC - PubMed

Publication types

LinkOut - more resources