. 2019 Jan 1;30(1):131-145.
doi: 10.1091/mbc.E18-04-0204. Epub 2018 Oct 31.

Nuclear envelope expansion in budding yeast is independent of cell growth and does not determine nuclear volume

Affiliations

Nuclear envelope expansion in budding yeast is independent of cell growth and does not determine nuclear volume

Alison D Walters et al. Mol Biol Cell. .

Abstract

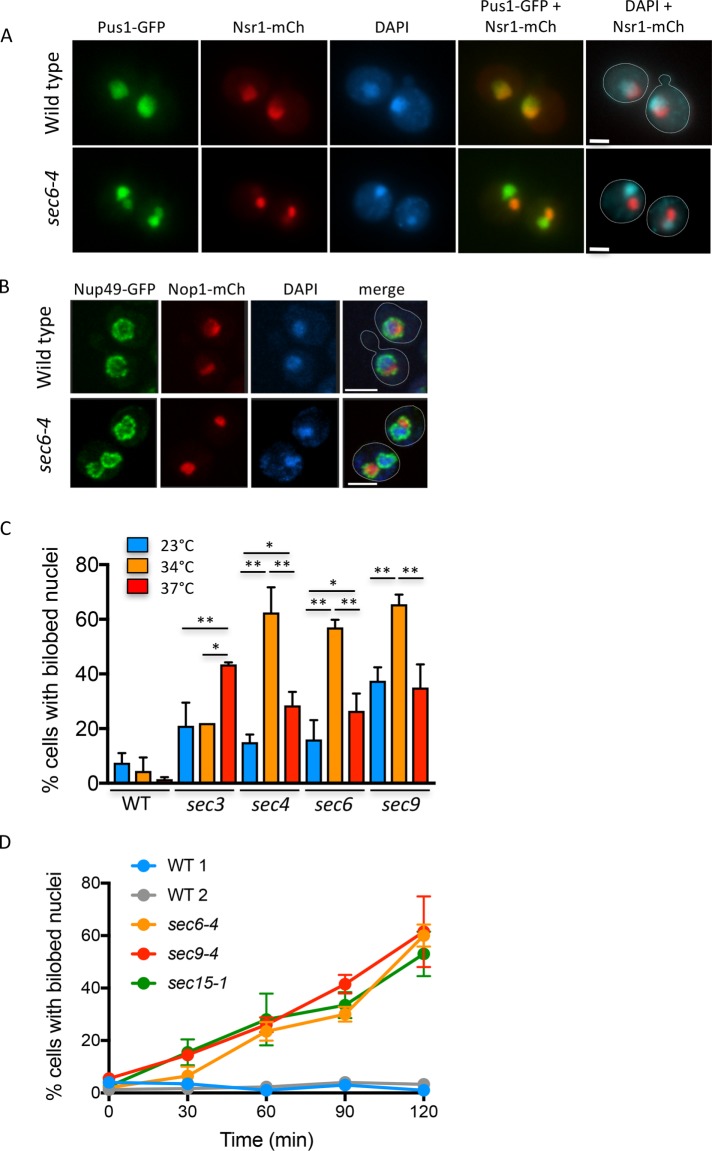
Most cells exhibit a constant ratio between nuclear and cell volume. The mechanism dictating this constant ratio and the nuclear component(s) that scale with cell size are not known. To address this, we examined the consequences to the size and shape of the budding yeast nucleus when cell expansion is inhibited by down-regulating components of the secretory pathway. We find that under conditions where cell size increase is restrained, the nucleus becomes bilobed, with the bulk of the DNA in one lobe and the nucleolus in the other. The formation of bilobed nuclei is dependent on fatty acid and phospholipid synthesis, suggesting that it is associated with nuclear membrane expansion. Bilobed nuclei appeared predominantly after spindle pole body separation, suggesting that nuclear envelope expansion follows cell-cycle cues rather than cell size. Importantly, cells with bilobed nuclei had the same nuclear:cell volume ratio as cells with round nuclei. Therefore, the bilobed nucleus could be a consequence of continued NE expansion as cells traverse the cell cycle without an accompanying increase in nuclear volume due to the inhibition of cell growth. Our data suggest that nuclear volume is not determined by nuclear envelope availability but by one or more nucleoplasmic factors.


Figures

FIGURE 1:
FIGURE 1:
Possible outcomes of nuclear size and shape when cell growth is inhibited. See the text for more details.
FIGURE 2:
FIGURE 2:
The sec mutants used in this study display a normal ER. Shown are the percentages of ER in the form of sheets in wild type, various sec mutants, and spo7∆ cells. Images of live cells were acquired 2 h after the shift to 34°C. n = 86 (WT, S288c), 70 (sec3, S288c), 50 (sec4, S288c), 78 (sec6, S288c), 71 (sec9, S288c), 110 (spo7∆, S288c), 80 (WT, W303), 80 (sec6, W303), 80 (sec15, W303), and 80 (spo7∆, W303) from two to three biological replicates. Error bars represent SD. Statistical analyses were done using ordinary one-way ANOVA (analysis of variance). Representative images are shown in Supplemental Figure S2.
FIGURE 3:
FIGURE 3:
Inactivation of the secretory pathway results in the formation of bilobed nuclei. (A) Fluorescence images of wild-type and sec6-4 cells expressing Pus1-GFP (nucleoplasm; green) and Nsr1-mCherry (nucleolus; red) that were grown at 34°C for 2 h. Cells were stained with 4’,6-diamidino-2-phenylindole (DAPI) to visualize DNA (blue). Dashed white lines outline cells. Scale bar is 2 µm. (B) Fluorescence images of wild-type and sec6-4 cells expressing Nup49-GFP (NE; green) and Nop1-mCherry (nucleolus; red) were treated as described in A. Scale bar is 3 µm. (C) Quantification of nuclear phenotypes for WT and the indicated sec mutant cells shifted to 23°, 34°, or 37°C for 2 h. Nuclear phenotypes were scored using Pus1-GFP and DAPI. For each condition n = 200 from two biological replicates. *p < 0.05, **p < 0.001. Statistical analyses were done using Fisher's exact test. Error bars represent SD. (D) Kinetics of bilobed nuclei accumulation in wild-type, sec6-4, sec9-4, and sec15-4 cells expressing Pus1-GFP that were incubated at 34°C for the indicated times. Wild type 1 is isogenic to sec6-4 and sec15-1 and wild type 2 is isogenic to sec9-4. For each time point, 200 cells were scored in two biological replicates. Error bars represent SD (the error bars for the WT strains are too small to be seen on the graph).
FIGURE 4:
FIGURE 4:
Nuclear bilobes are dependent on fatty acid and phospholipid synthesis. (A) Merged fluorescence images of untreated sec6-4 cells (left) and cerulenin-treated sec6-4 cells (right) grown for 2 h at 34°C. Images are a single slice from a confocal stack. The nucleoplasm is marked with Pus1-GFP (green), the nucleolus with Nsr1-CR (red), and the cell wall is stained with concanavalin A-Alexa Fluor 655 (magenta). Scale bar is 2 µm. (B) Quantification of percent cells with bilobed nuclei for WT, sec6-4, and sec15-1 cells expressing Pus1-GFP grown as described in A in the presence or absence of cerulenin. n = 200 from two biological replicates. Error bars represent SD. Statistical analyses were done using Student's t test. (C) Wild-type (WT) and sec6-4 cells expressing Nup49-GFP and carrying either empty vectors or plasmids expressing SPO7 and NEM1 from galactose inducible promoters were treated with galactose for 1 h at 23°C, shifted to 34°C for 2 h in the presence of galactose, and then fixed and analyzed. Four hundred cells from four biological replicates were scored for each condition. Error bars represent SD. Statistical analyses were done using Student's t test.
FIGURE 5:
FIGURE 5:
The bilobe nuclear phenotype in sec mutants is more prevalent later in the cell cycle. Wild-type (WT) and sec6-4 cells, both expressing Pus1-GFP and Spc42-mCherry, were grown at 23°C, placed on agar pads, and immediately incubated at 34°C and imaged live using a DeltaVision microscope. (A) The time point at which SPB separation was seen in WT (blue) and sec6-4 (orange) cells that had a single SPB at time 0. n = 25 and 27 for WT and sec6-4, respectively. Error bars represent SD. Statistical analyses were done using Student's t test. (B) Time, relative to SPB separation, when bilobed nuclei were first observed in 27 sec6-4 cells that were followed by live microscopy. The individual time courses are shown in Supplemental Figure S3A. (C) Time, relative to the temperature shift to 34°C, of when bilobes were first observed in sec6-4 cells that initially had one SPB (Group 1, green) or two SPBs (Group 2, blue). n = 27 and 16 for Group 1 and Group 2, respectively.
FIGURE 6:
FIGURE 6:
Cycloheximide treatment leads to NE deformation and unscheduled ER expansion. (A) An image of WT cells expressing Pus1-GFP and Nsr1-mCherry treated with cycloheximide for 30 min, fixed, stained with ConA-AlexaFluor 655 and imaged by confocal microscopy. Cycloheximide-induced deformed nuclei were more irregular than bilobed nuclei. (B) Kinetics of deformed nuclei formation in WT cells expressing Pus1-GFP, treated with cycloheximide at 34°C for the indicated times. Two hundred cells per time point were counted in two biological replicates. (C) The percentage ER sheets, determined as described in Figure 2, for untreated wild-type cells or cells treated with cycloheximide. n = 120 cells (untreated) and 104 cells (treated) from three biological replicates. Error bars represent SD. Statistical analyses were done using Student's t test.
FIGURE 7:
FIGURE 7:
The N:C volume ratio is maintained in cells with bilobed nuclei, as determined by the NucQuant method. (A) A three-dimensional NE model fitting for nuclei from wild-type (WT) and sec6-4 cells shifted to 34°C for 1 h. Nup49::GFP marks the NE and Nop1::mCherry marks the nucleolus. For each strain, the left panel is a maximum projection from a stack of confocal images and the right panel is the fluorescence image with the mesh representation of reconstructed 3D-NE overlaid. Scale bar is 1 µm. (B) Quantification of cell volumes for WT and sec6-4 cells grown at 23°C or 34°C (1 h). For the sec6-4 strain at 34°C, only bilobed cells were considered. n = 95 (WT at 23°C), 99 (sec6-4 at 23°C), 96 (WT at 34°C), and 115 (sec6-4 at 34°C). The p values in this panel and in D, E, and F were determined using ordinary one-way ANOVA with correction using Tukey's multiple comparison test. (C) NPC probability density maps for WT and sec6-4. Maps were constructed from population-aggregated densities of NPCs from 852 cells for WT and 226 cells containing bilobed nuclei for sec6-4 as in Wang et al. (2016). The color scale indicates the density of NPC detection: for example, dark red indicates the smallest volume encompassing 10% of all aggregated NPCs of the population, and dark blue indicates the smallest volume encompassing 90% of all aggregated NPCs of the population. In other words, the highest probability of detecting NPCs is in the dark red zones while the lowest probability is in the dark blue zones. Red curve indicates the median nucleolus based on the number of cells indicated above; red line indicates the position of median nucleolar centroid; dashed yellow line indicates the median NE in WT. (D, E) Nuclear volumes (D) and nuclear surface areas (E) for cells as described in B. n = 100 for all conditions except sec6-4 at 34°C, which had n = 125. (F) N:C volume ratios for cells as described in B. (G) Nuclear surface area as a function of cell volume for wild-type and sec6-4 cells grown at 34°C for 1 h. n = 94 and 113 for wild type and sec6-4, respectively. Linear regression was done using Prism software. The lines for wild type and sec6-4 can be described as y = 0.1286*x + 6.693 and y = 0.1402*x + 8.567, respectively. R2 values are 0.7892 and 0.591 for wild type and sec6-4, respectively. Dashed lines represent 95% confidence. (H) Nuclear volume as a function of cell volume for wild type and sec6-4 cells grown at 34°C for 1 h, as described in G. The linear regression lines for wild type and sec6-4 can be described as y = 0.06372*x + 1.277 and y = 0.06844*x + 1.29, respectively. R2 values are 0.7971 and 0.646 for wild type and sec6-4, respectively. Dashed lines represent 95% confidence.
FIGURE 8:
FIGURE 8:
Wild-type and sec6-4 mutant cells exhibit the same N:C volume ratios, as determined by soft X-ray tomography. (A) Surface rendered views of sec6-4 cells shifted to 34°C for 1 h and then imaged using soft X-ray tomography. Nuclei are shown in purple. Scale bar is 1 µm. (B) Distribution of sphericity in nuclei from wild-type and sec6-4 cells. The p value was calculated using Student's unpaired parametric two-tailed t test. n = 20 and 31 for wild type and sec6-4, respectively. (C) Distribution of N:C volume ratios for WT and sec6-4 cells from samples as in B. There is no significant difference between the N:C volume ratios of WT and sec6-4 cells (p = 0.096, Student's unpaired parametric two-tailed t test).
FIGURE 9:
FIGURE 9:
The N:C volume ratio is the same for round and bilobed nuclei within the same sec mutant. (A) sec6-4 and sec15-1 cells grown for 1 h at 34°C, fixed, and imaged were divided based on their sphericity, with a sphericity value of 0.955 being the cutoff. n = 107 (for sec6 ≥ 0.0955), 42 (sec6 < 0.955), 58 (sec15 ≥ 0.955), and 89 (sec15 < 0.955) from three biological replicates. Here and in all subsequent panels, p values were determined using one-way ANOVA with multiple comparisons. (B–E) Same cells as in A, analyzed for nuclear surface area (B), cell volume (C), nuclear volume (D), and N:C volume ratio (E). (F) The entire pool of wild-type (WT), sec6-4, and sec15-1 cells were analyzed for N:C volume ratio. n = 150 (WT), 149 (sec6-4), and 147 (sec15-1) from three biological replicates.
FIGURE 10:
FIGURE 10:
Nuclear shape in small sized cell mutants is mutant specific. (A) Sphericity of nuclei from WT (n = 81), whi5∆ (n = 34), swe1∆ (n = 31), whi3∆ (n = 19), and sfp1∆ (n = 74) cells expressing Pus1-GFP were grown in YPD at 30°C to replicate published conditions in which these mutants exhibited a small cell size. The p values were determined by one-way ANOVA with correction for multiple comparisons. (B) Fluorescence images of WT and sfp1∆ cells expressing Pus1-GFP (green) and strained with ConA-AlexaFluor 655 (purple). Scale bar is 3 µm.

Similar articles

Cited by

References

    1. Anastasia SD, Nguyen DL, Thai V, Meloy M, MacDonough T, Kellogg DR. (2012). A link between mitotic entry and membrane growth suggests a novel model for cell size control. J Cell Biol , 89–104. - PMC - PubMed
    1. Bell ES, Lammerding J. (2016). Causes and consequences of nuclear envelope alterations in tumour progression. Eur J Cell Biol , 449–464. - PMC - PubMed
    1. Berger AB, Cabal GG, Fabre E, Duong T, Buc H, Nehrbass U, Olivo-Marin J-C, Gadal O, Zimmer C. (2008). High-resolution statistical mapping reveals gene territories in live yeast. Nat Methods , 1031–1037. - PubMed
    1. Blank HM, Perez R, He C, Maitra N, Metz R, Hill J, Lin Y, Johnson CD, Bankaitis VA, Kennedy BK, et al (2017). Translational control of lipogenic enzymes in the cell cycle of synchronous, growing yeast cells. EMBO J , 487–502. - PMC - PubMed
    1. Blumberg H, Silver PA. (1991). A split zinc-finger protein is required for normal yeast growth. Gene , 101–110. - PubMed

Publication types

MeSH terms