

Morbidity and Mortality Among Critically Injured Children With Acute Respiratory Distress Syndrome
- PMID: 30379667
- PMCID: PMC6336518
- DOI: 10.1097/CCM.0000000000003525
Morbidity and Mortality Among Critically Injured Children With Acute Respiratory Distress Syndrome
Abstract
Objectives: To evaluate morbidity and mortality among critically injured children with acute respiratory distress syndrome.
Design: Retrospective cohort study.
Setting: Four-hundred sixty Level I/II adult or pediatric trauma centers contributing to the National Trauma Data Bank.
Patients: One hundred forty-six thousand fifty-eight patients less than 18 years old admitted to an ICU with traumatic injury from 2007 to 2016.
Interventions: None.
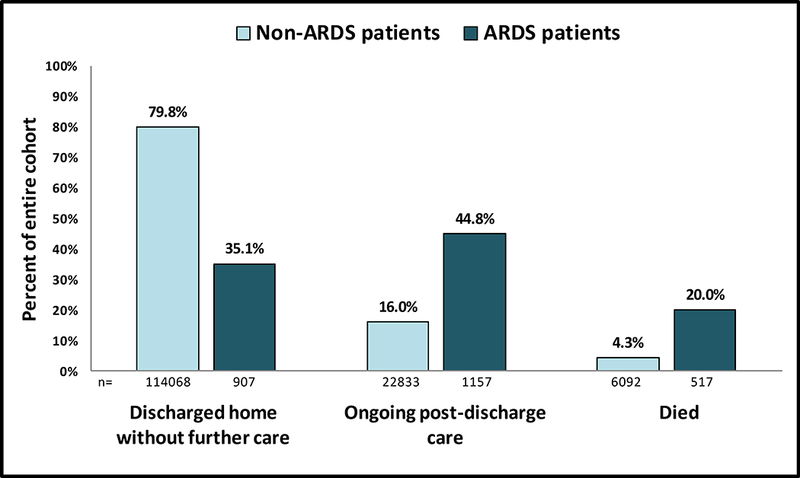
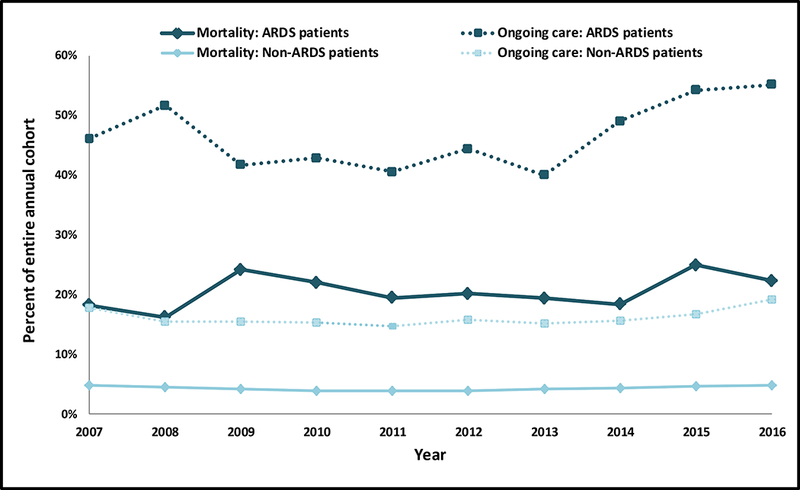
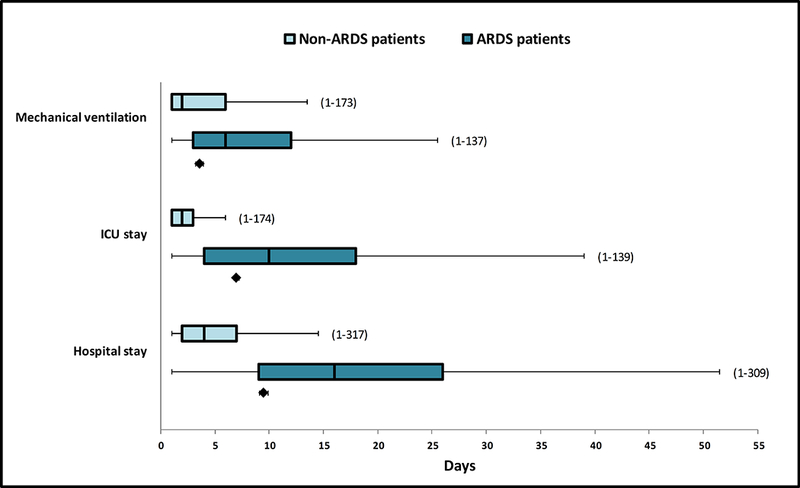
Measurements and main results: We assessed in-hospital mortality and need for postdischarge care among patients with and without acute respiratory distress syndrome and hospital resource utilization and discharge disposition among survivors. Analyses were adjusted for underlying mortality risk (age, Injury Severity Score, serious brain or chest injury, and admission heart rate and hypotension) and year, transfer status, and facility trauma level designation. Acute respiratory distress syndrome occurred in 2,590 patients (1.8%). Mortality was 20.0% among acute respiratory distress syndrome patients versus 4.3% among nonacute respiratory distress syndrome patients, with an adjusted relative risk of 1.76 (95% CI, 1.52-2.04). Postdischarge care was required in an additional 44.8% of acute respiratory distress syndrome patients versus 16.0% of patients without acute respiratory distress syndrome (adjusted relative risk, 3.59; 2.87-4.49), with only 35.1% of acute respiratory distress syndrome patients discharging to home versus 79.8% of patients without acute respiratory distress syndrome. Acute respiratory distress syndrome mortality did not change over the 10-year study period (adjusted relative risk, 1.01/yr; 0.96-1.06) nor did the proportion of acute respiratory distress syndrome patients requiring postdischarge care (adjusted relative risk, 1.04/yr; 0.97-1.11). Duration of ventilation, ICU stay, and hospital stay were all significantly longer among acute respiratory distress syndrome survivors. Tracheostomy placement occurred in 18.4% of acute respiratory distress syndrome survivors versus 2.1% of patients without acute respiratory distress syndrome (adjusted relative risk, 3.10; 2.59-3.70).
Conclusions: Acute respiratory distress syndrome development following traumatic injury in children is associated with significantly increased risk of morbidity and mortality, even after adjustment for injury severity and hemodynamic abnormalities. Outcomes have not improved over the past decade, emphasizing the need for new therapeutic interventions, and prevention strategies for acute respiratory distress syndrome among severely injured children.
Conflict of interest statement
Figures
References
-
- Ten leading causes of death by age group, United States – 2015. National Center for Injury Prevention and Control, CDC. www.cdc.gov/injury/wisqars/LeadingCauses.html. Accessed 1 Nov 2017.
-
- Cheifetz I Pediatric ARDS. Respir Care 2017; 62(6):718–731. - PubMed
-
- Dahlem P, van Aalderen WM, Hamaker ME, Dijkgraaf MG, Bos AP. Incidence and short-term outcome of acute lung injury in mechanically ventilated children. Eur Respir J 2003; 22(6):980–985. - PubMed
-
- Flori HR, Glidden DV, Rutherford GW, Matthay MA. Pediatric acute lung injury: Prospective evaluation of risk factors associated with mortality. Am J Respir Crit Care Med 2005; 171(9):995–1001. - PubMed
Publication types
MeSH terms
Grants and funding
LinkOut - more resources
Full Text Sources
Medical
Miscellaneous
