. 2018 Oct 31;15(10):e1002687.
doi: 10.1371/journal.pmed.1002687. eCollection 2018 Oct.

Development and validation of a new method for indirect estimation of neonatal, infant, and child mortality trends using summary birth histories

Affiliations

Development and validation of a new method for indirect estimation of neonatal, infant, and child mortality trends using summary birth histories

Roy Burstein et al. PLoS Med. .

Abstract

Background: The addition of neonatal (NN) mortality targets in the Sustainable Development Goals highlights the increased need for age-specific quantification of mortality trends, detail that is not provided by summary birth histories (SBHs). Several methods exist to indirectly estimate trends in under-5 mortality from SBHs; however, efforts to monitor mortality trends in important age groups such as the first month and first year of life have yet to utilize the vast amount of SBH data available from household surveys and censuses.

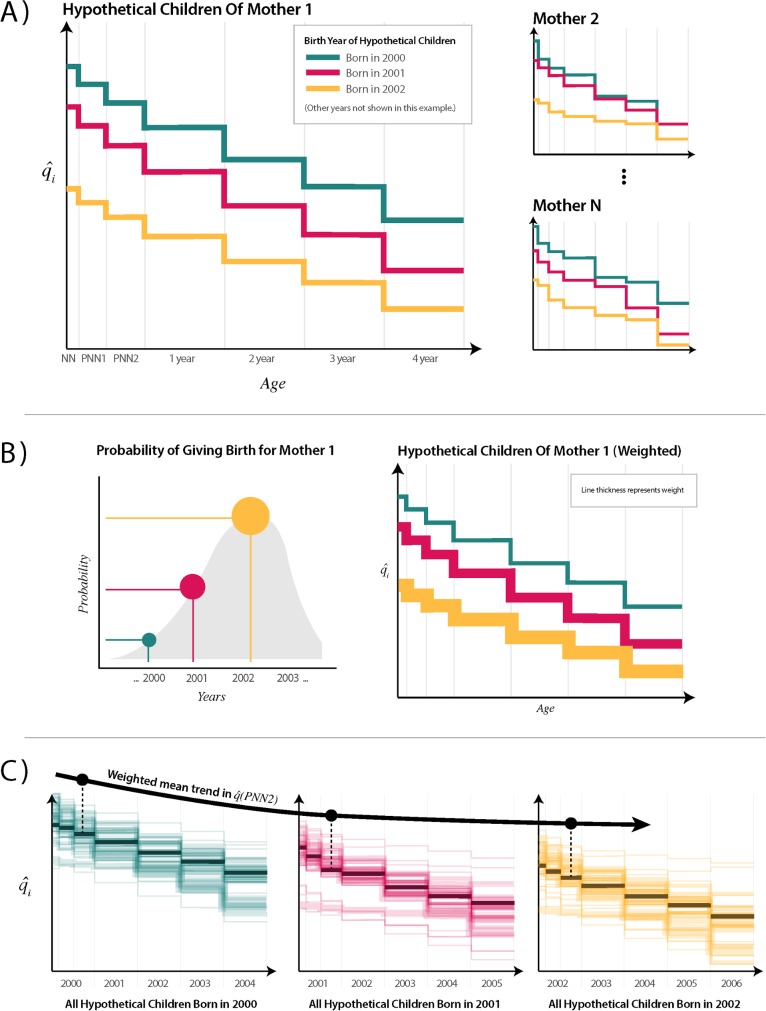
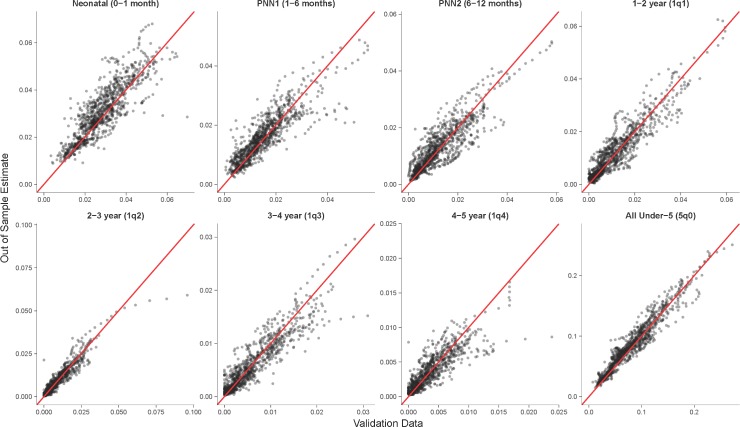
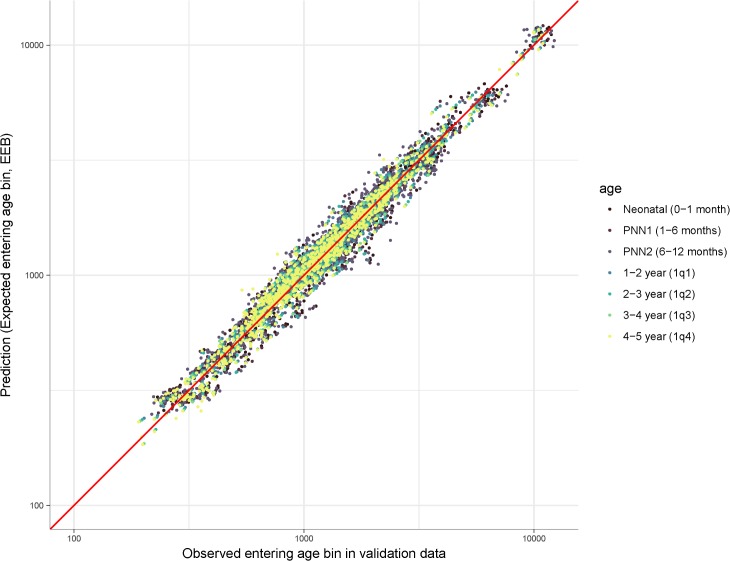
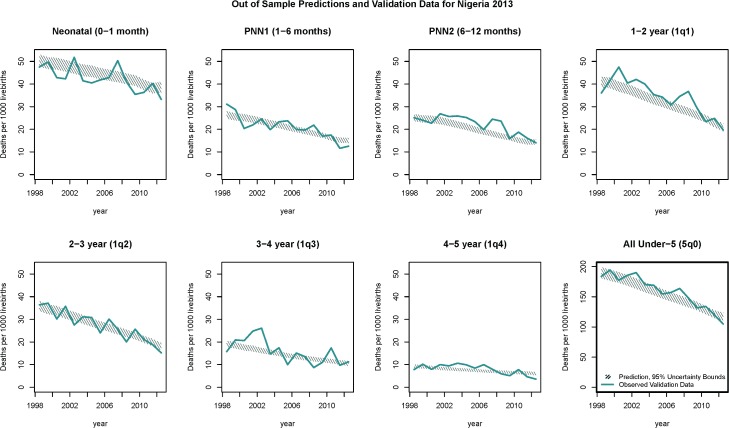
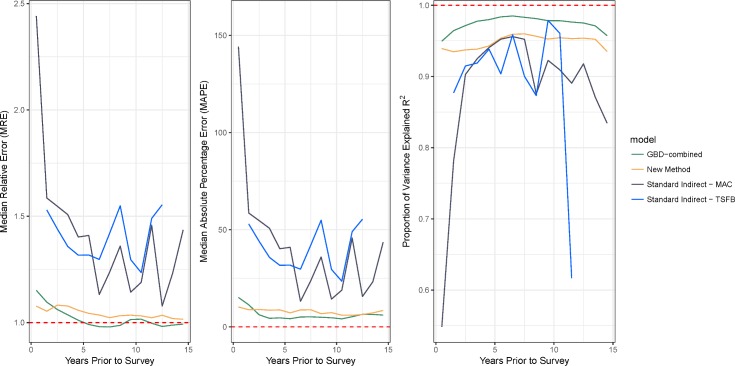
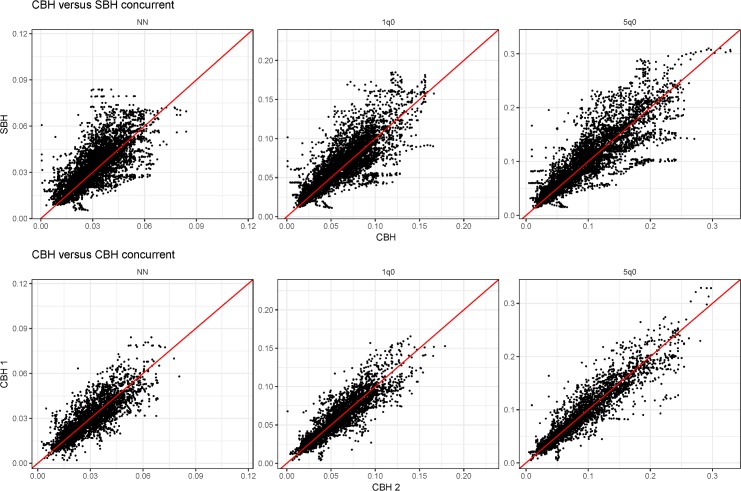
Methods and findings: We analyzed 243 Demographic and Health Surveys (DHS) from 76 countries, which collected both complete and SBHs from 8.5 million children from 2.3 million mothers to develop a new empirically based method to indirectly estimate time trends in age-specific mortality. We used complete birth history (CBH) data to train a discrete hazards generalized additive model in order to predict individual hazard functions for children based on individual-, mother-, and country-year-level covariates. Individual-level predictions were aggregated over time by assigning probability weights to potential birth years from mothers from SBH data. Age-specific estimates were evaluated in three ways: using cross-validation, using an external database of an additional 243 non-DHS census and survey data sources, and comparing overall under-5 mortality to existing indirect methods. Our model was able to closely approximate trends in age-specific child mortality. Depending on age, the model was able to explain between 80% and 95% of the variation in the validation data. Bias was close to zero in every age, with median relative errors spanning from 0.96 to 1.09. For trends in all under-5s, performance was comparable to the methods used for the Global Burden of Disease (GBD) study and significantly better than the standard indirect (Brass) method, especially in the 5 years preceding a survey. For the 15 years preceding surveys, the new method and GBD methods could explain more than 95% of the variation in the validation data for under-5s, whereas the standard indirect variants tested could only explain up to 88%. External validation using census and survey data found close agreement with concurrent direct estimates of mortality in the NN and infant age groups. As a predictive method based on empirical data, one limitation is that potential issues in these training data could be reflected in the resulting application of the method out of sample.

Conclusions: This new method for estimating child mortality produces results that are comparable to current best methods for indirect estimation of under-5 mortality while additionally producing age-specific estimates. Use of such methods allows researchers to utilize a massive amount of SBH data for estimation of trends in NN and infant mortality. Systematic application of these methods could further improve the evidence base for monitoring of trends and inequalities in age-specific child mortality.


Conflict of interest statement

The authors have declared that no competing interests exist.

Figures

Fig 1
Fig 1
Illustrating the estimated pooled baseline discrete hazard and survival functions from the 2011 Burundi DHS dataset, fit using the seven age bins a ∈ (1 = NN,2 = PNN1,3 = PNN2,4 = 1yr,5 = 2yr,6 = 3yr,7 = 4yr). Note that we are estimating discrete hazards, and thus, hazards (shown in panel B) are interpreted as a conditional probability rather than a conditional rate. The survival function (shown in panel A), showing estimated survival at the end of each age bin, is calculated directly from estimated hazards as S^a=α=1a(1qα). DHS, Demographic and Health Surveys; NN, neonatal; PNN1, post-neonatal 1; PNN2, post-neonatal 2.
Fig 2
Fig 2. Illustration of procedure to convert discrete hazard functions for hypothetical children to population-level age-specific trends.
(A) Discrete hazard functions are estimated for each hypothetical child from each mother in the target SBH dataset. Here, we color all children born in the same year with the same color. Only 3 years are shown for simplicity in this example. In real data, the years of birth of hypothetical children would vary by mother based on her age, such that there would be one hypothetical child for each year going back in time from the survey until the mother was 12 years old. (B) Probability of birth distributions is applied to each hypothetical birth from each mother. These are derived from the empirical map distributions from Rajaratnam and colleagues [9], in which a different probability is available by woman’s age, CEB, region of residence, and year prior to the survey. These probabilities are multiplied by each mother’s CEB and carried through to subsequent age bins to estimate the expected number of children entering each age bin (EEB) using estimated survival probabilities. As such, line thicknesses get slightly smaller with each subsequent age bin. The EEB value for each hypothetical child’s age bin represents the number of children entering that age bin that the hypothetical child represents for their given mother. (C) All hypothetical children to mothers are grouped by year of birth. The estimated mortality probabilities for each age bin from all hypothetical children born in the same year are pooled, and EEB is used to calculate a weighted mean. Trends are drawn across q^a for each year, indicated here by a trend in the third age bin. This aggregation procedure can be done for any grouping of women to make estimates for a survey cluster, a district, or a whole country. CEB, children ever born; EEB, expected entering bin; NN, neonatal; PNN1, post-neonatal 1; PNN2, post-neonatal 2; SBH, summary birth history.
Fig 3
Fig 3. Out-of-sample predictions of mortality probability compared against loess-smoothed validation data.
Each point represents a country–age mortality estimate (qa,yr) for each held-out survey from the DHS database. Red line indicates unity. DHS, Demographic and Health Surveys; loess, local regression; PNN1, post-neonatal 1; PNN2, post-neonatal 2.
Fig 4
Fig 4. Comparison of EEB and observed children entering each age bin from CBH validation data.
Each point represents a survey year age bin; both axes are on log 10 scale. R2 = 0.97. CBH, complete birth history; EEB, expected entering bin; PNN1, post-neonatal 1; PNN2, post-neonatal 2.
Fig 5
Fig 5. Trends in mortality for each age bin from the 2013 Nigeria DHS.
Thick blue lines are validation data; hatched lines are the 95% uncertainty bounds on the out-of-sample predictions. Sampling variation is evident in the blue line through year-on-year spikes. The target of prediction was the overall time trend, leading to a smoother prediction. Axis scales are fixed except for 5q0, which is the combination of the mortality rates from the seven age bins. Similar plots for each country in the validation data are available in in the S4 Fig. DHS, Demographic and Health Surveys; PNN1, post-neonatal 1; PNN2, post-neonatal 2.
Fig 6
Fig 6. Comparing predictive validity metrics across different methods for indirect estimation of 5q0.
Both the GBD-combined and new methods greatly outperform the standard indirect methods, particularly in the most recent 5 years. Note that whereas the standard indirect methods produce estimates in only a few years for any given survey, the location of these times vary based on the population in each survey as determined by the observed fertilities in each source, and thus, we are able to make annual estimates going back 15 years. GBD, Global Burden of Disease; MAC, maternal age cohort; TSFB, time since first birth.
Fig 7
Fig 7. Each country-year concurrent estimate for NN, infant, and under-5 mortality.
The top row compared concurrent estimates from the SBH-only data with CBH direct estimates. The bottom row shows the same comparison from concurrent CBH estimates, theoretically representing a baseline level of variance we would expect in concurrent estimates. Comparing red lines indicate unity. CBH, complete birth history; NN, neonatal; SBH, summary birth history.

References

    1. Murray CJL. Shifting to Sustainable Development Goals—Implications for Global Health. N Engl J Med. 2015;373: 1390–1393. 10.1056/NEJMp1510082 - DOI - PubMed
    1. Mathers C, Boerma T. Mortality Measurement Matters: Improving Data Collection and Estimation Methods for Child and Adult Mortality. PLoS Med. 2010;7: e1000265 10.1371/journal.pmed.1000265 - DOI - PMC - PubMed
    1. Phillips DE, Lozano R, Naghavi M, Atkinson C, Gonzalez-Medina D, Mikkelsen L, et al. A composite metric for assessing data on mortality and causes of death: the vital statistics performance index. Popul Health Metr. 2014;12: 14 10.1186/1478-7954-12-14 - DOI - PMC - PubMed
    1. Wang H, and others. Global, regional, national, and selected subnational levels of stillbirths, neonatal, infant, and under-5 mortality, 1980–2015: a systematic analysis for the Global Burden of Disease Study 2015. The Lancet. 2016;388: 1725–1774. 10.1016/S0140-6736(16)31575-6 - DOI - PMC - PubMed
    1. You D, Hug L, Ejdemyr S, Idele P, Hogan D, Mathers C, et al. Global, regional, and national levels and trends in under-5 mortality between 1990 and 2015, with scenario-based projections to 2030: a systematic analysis by the UN Inter-agency Group for Child Mortality Estimation. The Lancet. 2015;386: 2275–2286. 10.1016/S0140-6736(15)00120-8 - DOI - PubMed

Publication types