Comparative Study
. 2018 Oct 31;13(10):e0206139.
doi: 10.1371/journal.pone.0206139. eCollection 2018.

Proteomic analysis of human prostate cancer PC-3M-1E8 cells and PC-3M-2B4 cells of same origin but with different metastatic potential

Affiliations
Comparative Study

Proteomic analysis of human prostate cancer PC-3M-1E8 cells and PC-3M-2B4 cells of same origin but with different metastatic potential

Shujiang Zhang et al. PLoS One. .

Abstract

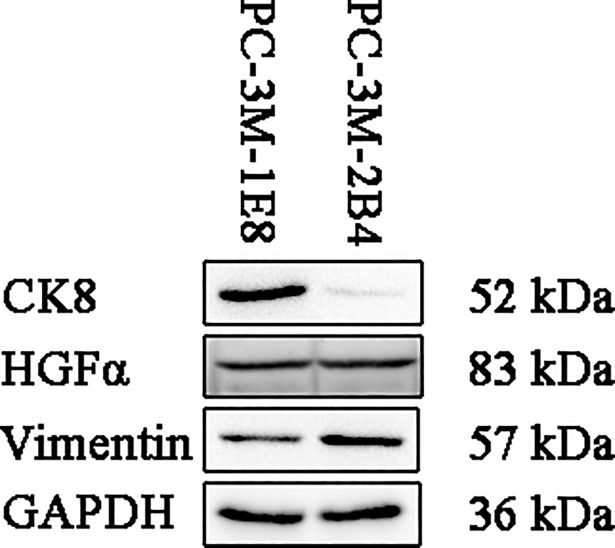
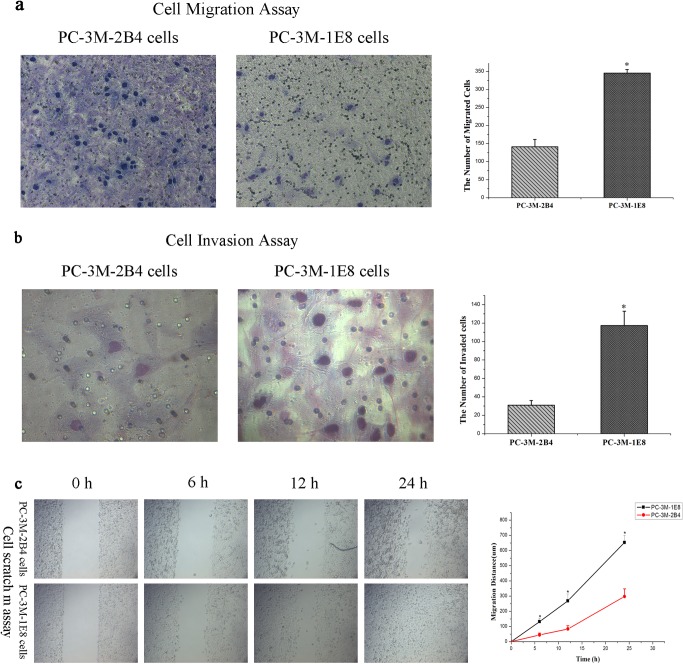
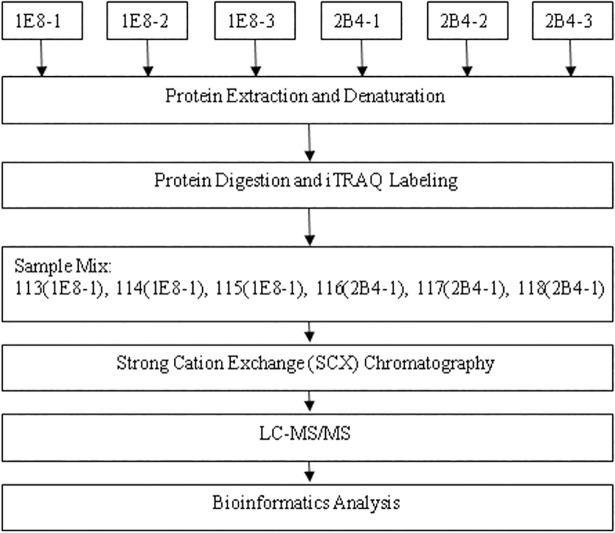
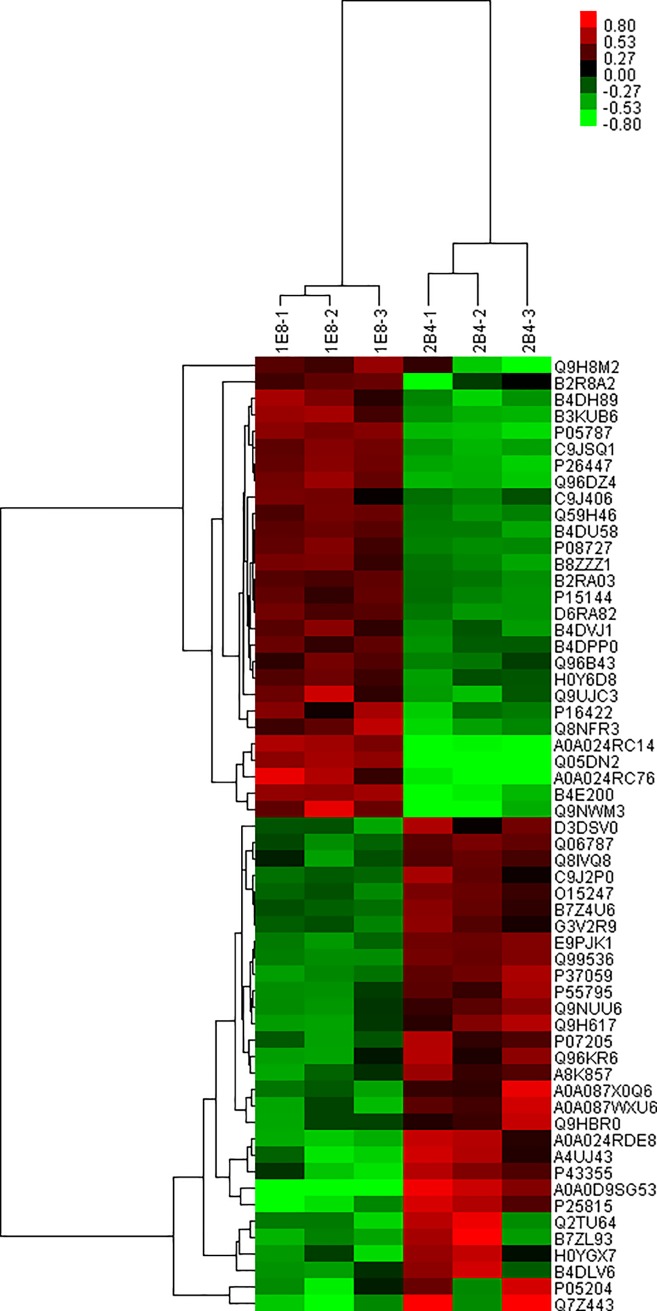
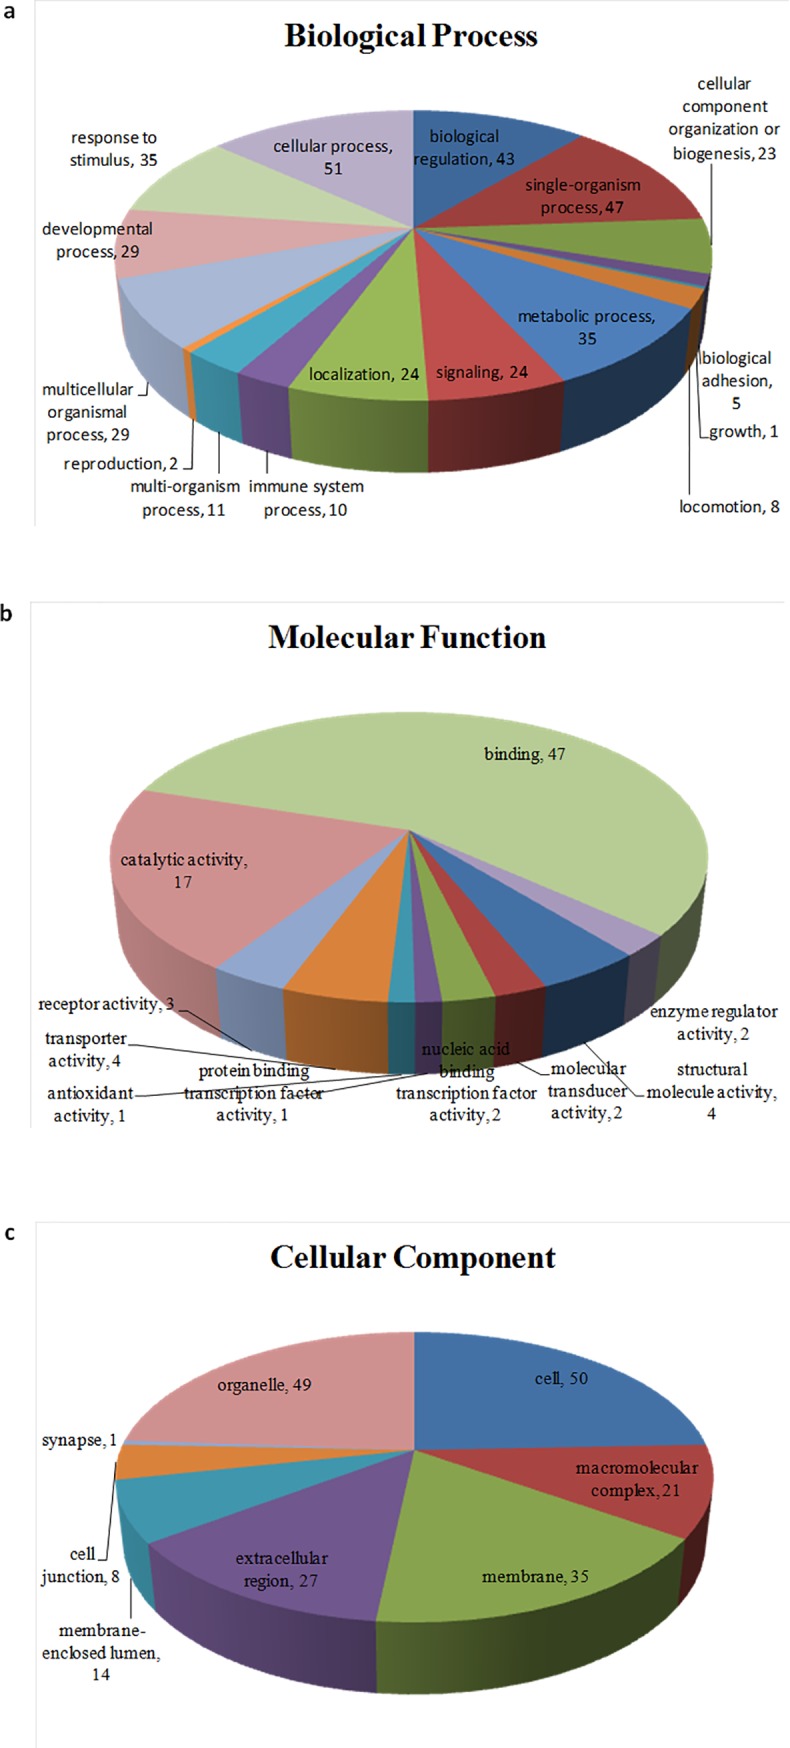
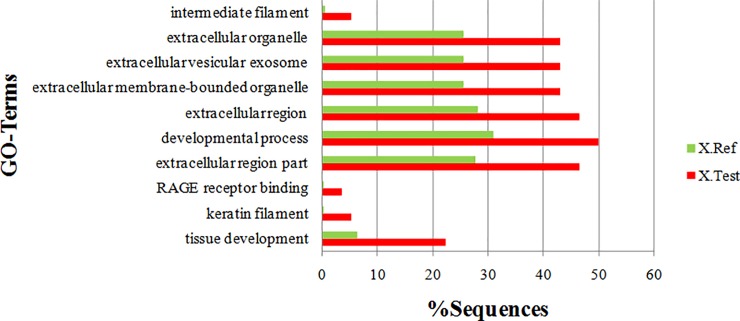
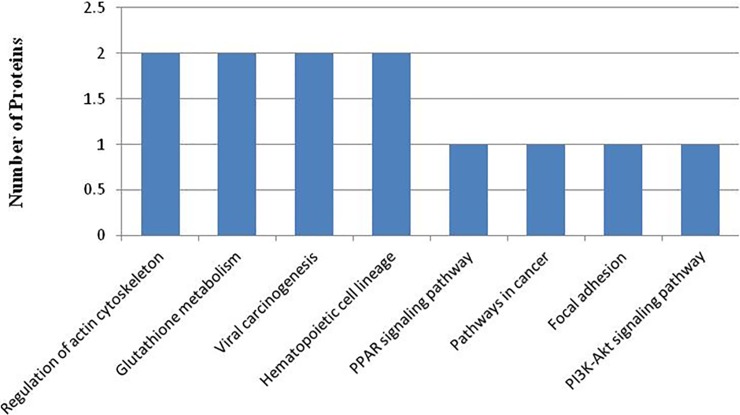
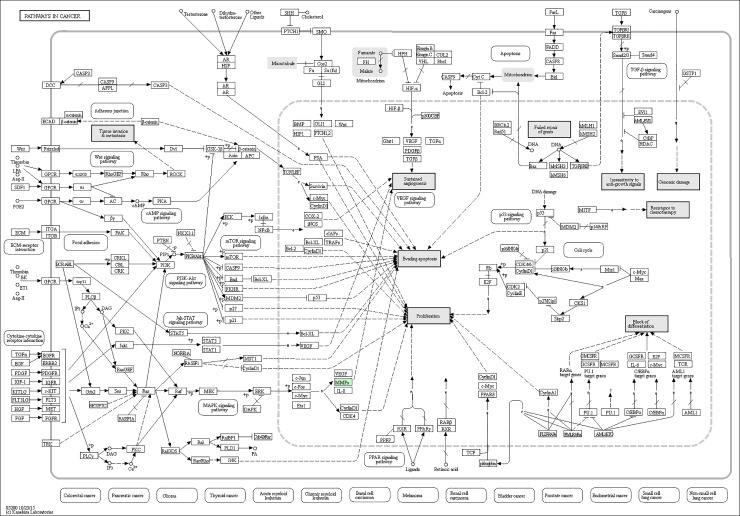
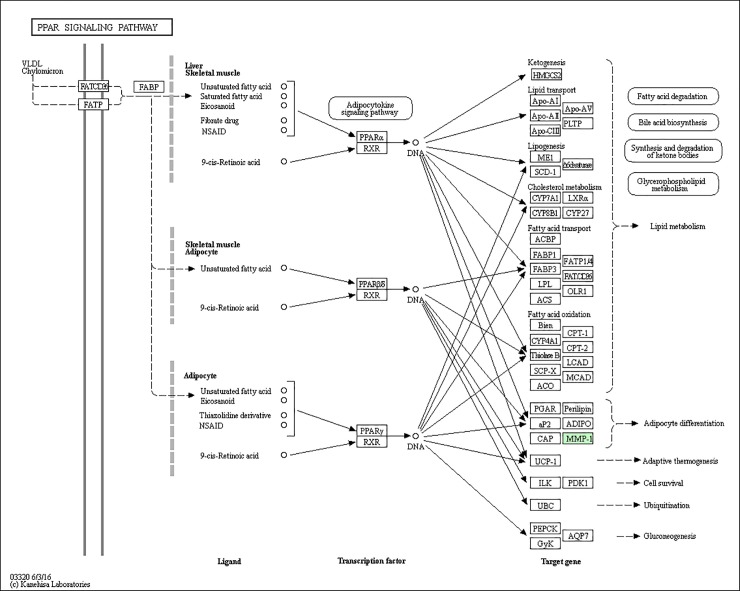
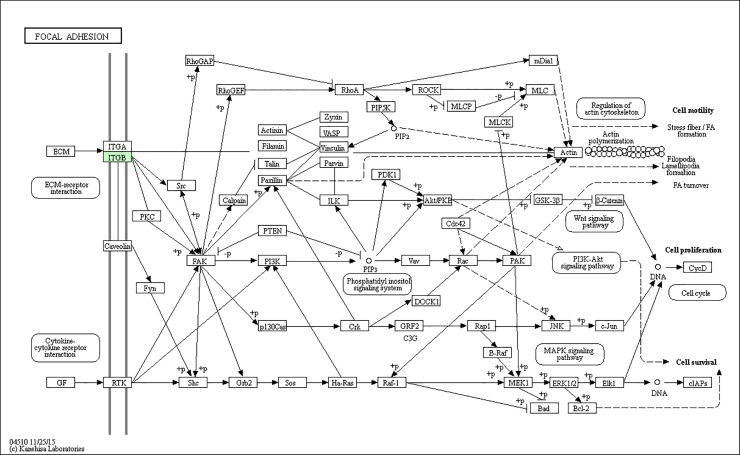
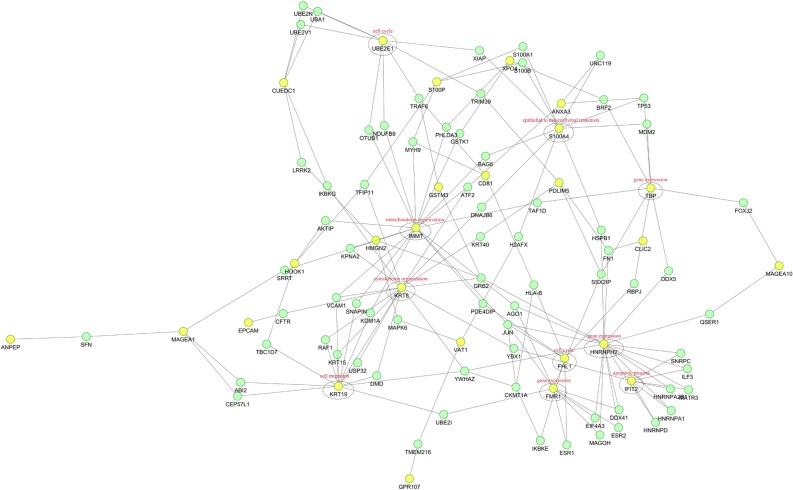
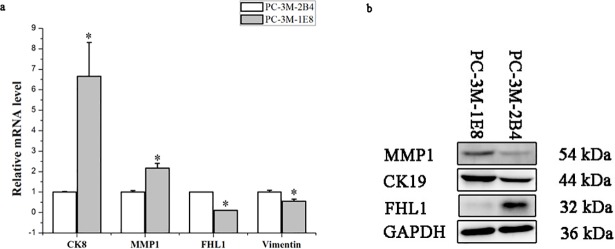
Prostate cancer (PCa) is the second most frequently diagnosed cancer and the fifth leading cause of death from cancer in men worldwide. Increased understanding of the prostate cancer metastasis mechanisms will help identify more efficient intervention strategies to prevent or treat this deadly disease in the future. To identify the candidate proteins that contribute to metastasis of PCa, isobaric tags for relative and absolute quantitation (iTRAQ)-based proteomic analysis was performed to explore differentially expressed proteins between two homologous human prostate cancer cell lines including highly-metastatic PC-3M-1E8 cell line and poorly-metastatic PC-3M-2B4 cell line. Here, a total of 58 proteins were identified to be significantly differentially expressed between PC-3M-1E8 and PC-3M-2B4 cells, which were further verified using real-time quantitative PCR and western blot analysis. The bioinformatic analysis suggested that the differentially expressed proteins, like MMP1 and FHL1, may contribute to the higher metastatic ability of PC-3M-1E8 cells than PC-3M-2B4 cells. In addition, functional analyses proved MMP1's positive effect on the higher metastatic ability of PC-3M-1E8 cells than PC-3M-2B4 cells. These findings provided a unique resource to specifically reveal the complex molecular regulatory mechanisms underlying the progression of prostate cancer from poorly-metastatic to highly-metastatic stage.


Conflict of interest statement

The authors have declared that no competing interests exist.

Figures

Fig 1
Fig 1. Expression of cytodifferentiation markers in PC-3M-1E8 and PC-3M-2B4 cells.
Western blot analysis was performed on whole cell lysate using antibodies against epithelial (CK8), stromal (HGFα), and fibroblast (vimentin) markers. GAPDH was used as protein loading control. Full-length gels are presented in S1 Fig. Experiments were repeated three times independently.
Fig 2
Fig 2. In vitro migration and invasion potential of PC-3M-1E8 cells and PC-3M-2B4 cells.
(a) Representative photomicrographs of PC-3M-1E8 cells and PC-3M-2B4 cells are presented at 200 × magnification for migration assay using a microscope (left). Cells migrated were counted from ten fields (2 × (centre + 4 quadrants)). Bar graphs present relative differences in quantity of migrated cells for PC-3M-1E8 cells and PC-3M-2B4 cells (right). (b) Representative photomicrographs of PC-3M-1E8 cells and PC-3M-2B4 cells are presented at 400 × magnification for invasion assay using a microscope (left). Cells invaded were counted from ten fields (2×(centre+4 quadrants)). Bar graphs present relative differences in quantity of invaded cells for PC-3M-1E8 cells and PC-3M-2B4 cells (right) (c) Cell migration evaluated by scratch wound healing assay. Representative images of PC-3M-1E8 cells and PC-3M-2B4 cells migrating into the wounded area at 0, 6, 12 and 24 hr after wound formation are shown (left), and the wound surface areas were measured with Image-Pro Plus software. Line graph presents change in closure of wounds for PC-3M-1E8 cells and PC-3M-2B4 cells (right). The data represents mean ± SD of 3 repeats. There was a significant difference between PC-3M-1E8 cells and PC-3M-2B4 cells (Student’s t-test; *P<0.05).
Fig 3
Fig 3. Schematics of the workflow for the iTRAQ proteomic analysis.
The numbers including 113, 114, 115, 116, 117 and 118 are different iTRAQ labels.
Fig 4
Fig 4. Clustering analysis of differentially expressed proteins.
The color scale bar in the right of hierarchical clustering analysis indicates that proteins activated in PC-3M-1E8 compared with PC-3M-2B4 are depicted in red and proteins repressed are depicted in green.
Fig 5
Fig 5
Distribution of GO functional categories in biological process (a), molecular functions (b), and cellular component (c). All data are presented on the basis of GO level 2 terms. Numbers refer to assigned proteins in each category.
Fig 6
Fig 6. GO enrichment analysies of differentially expressed proteins.
All data are presented on the basis of GO level 2 terms. Green and red bars represent the GO term corresponding proteins’ proportions in the collection of all qualitative proteins and the GO term corresponding differentially expressed proteins’ proportions in their collection, respectively. Statistical analysis was performed using Fisher’s exact test; they are significant different from each other, P< 0.01.
Fig 7
Fig 7. The most represented KEGG pathways.
Fig 8
Fig 8. Representative KEGG pathway for pathways in cancer, as per the citation guidelines: www.kegg.jp/kegg/kegg1.html.
The differentially expressed proteins were mapped as green [–19].
Fig 9
Fig 9. Representative KEGG pathway for PPAR signaling pathway, as per the citation guidelines: www.kegg.jp/kegg/kegg1.html.
The differentially expressed proteins were mapped as green [–19].
Fig 10
Fig 10. Representative KEGG pathway for focal adhesion, as per the citation guidelines: www.kegg.jp/kegg/kegg1.html.
The differentially expressed proteins were mapped as green [–19].
Fig 11
Fig 11. Potential protein-protein interaction networks.
The nodes: the proteins; the lines between the nodes: protein-protein interaction modes; yellow spots: proteins that expressed significantly differentially; green spots: proteins that did not express differentially.
Fig 12
Fig 12. Validation of selected candidate proteins identified from iTRAQ expression in PC-3M-1E8 and PC-3M-2B4 cells with qRT-PCR and western blot analysis.
a. qRT-PCR: The relative transcription levels of MMP1 and CK8 significantly increased, but the relative transcription levels of vimentin and FHL1 significantly decreased in the PC-3M-1E8 cells compared with the PC-3M-2B4 cells. GAPCH was used as an internal reference. The data represent mean ± SD of three biological replicates. *P < 0.05. b. Western blot: The expression level of MMP1 and CK19 significantly increased, but the protein level of FHL1 significantly decreased in the PC-3M-1E8 cells compared with the PC-3M-2B4 cells. GAPDH was performed as internal reference. Full-length gels are presented in S2 Fig. Experiments were repeated three times independently.
Fig 13
Fig 13. Knock down of MMP1 suppresses in vitro migration and invasion of the PC-3M-1E8 cells.
(a) Left panel: the PC-3M-1E8-MMP1-KD cells stably knocked down MMP1 by MMP1 siRNA stable transfection were identified and confirmed using qRT-PCR analysis. The relative transcription levels of MMP1 significantly decreased in the PC-3M-1E8-MMP1-KD cells compared with the PC-3M-1E8-MMP1-NC cells. GAPCH was used as an internal reference. The data represent mean ± SD of three biological replicates. *P < 0.05. Right panel: the PC-3M-1E8-MMP1-KD cells stably knocked down MMP1 by MMP1 siRNA stable transfection were identified and confirmed using western blot analysis. The expression of MMP1 significantly decreased in the PC-3M-1E8-MMP1-KD cells compared with the PC-3M-1E8-MMP1-NC cells. GAPDH was performed as internal reference. Full-length gels are presented in S3 Fig. Experiments were repeated three times independently. (b-d) Effects of MMP1 siRNA stable transfection on the in vitro migratory and invasive potential of PC-3M-1E8 cells. The in vitro migratory (b: cell scratch assay, c: cell migration assay) and invasive (d: cell invasion assay) potential significantly decreased in the PC-3M-1E8-MMP1-KD cells compared with the PC-3M-1E8-MMP1-NC cells. The data represents mean ± SD of 3 repeats. Significantly different according to Student’s t-test, *P<0.05.

Similar articles

Cited by

References

    1. Torre LA, Bray F, Siegel RL, Ferlay J, Lortet-Tieulent J, and Jemal A. Global cancer statistics, 2012. CA Cancer J. Clin. 65, 87–108 (2015). 10.3322/caac.21262 - DOI - PubMed
    1. Siegel RL, Miller KD, Jemal A. Cancer statistics, 2017. CA Cancer J. Clin. 67, 7–30. 10.3322/caac.21387 - DOI - PubMed
    1. Chen W, Zheng R, Baade PD, Zhang S, Zeng H, Bray F, et al. Cancer statistics in China, 2015. CA Cancer J Clin. 66, 115–132 (2016). 10.3322/caac.21338 - DOI - PubMed
    1. Castanares MA, Copeland BT, Chowdhury WH, Liu MM, Rodriguez R, Pomper MG, et al. Characterization of a novel metastatic prostate cancer cell line of LNCaP origin. The Prostate 76, 215–225 (2016). 10.1002/pros.23115 - DOI - PMC - PubMed
    1. Ishikura N, Kawata H, Nishimoto A, Nakamura R, Ishii N, Aoki Y. Establishment and characterization of an androgen receptor-dependent, androgen-independent human prostate cancer cell line, LNCaP-CS10. The Prostate 70, 457–466 (2010). 10.1002/pros.21079 - DOI - PubMed

Publication types

MeSH terms