

Cause-specific mortality patterns among hospital deaths in Tanzania, 2006-2015
- PMID: 30379899
- PMCID: PMC6209209
- DOI: 10.1371/journal.pone.0205833
Cause-specific mortality patterns among hospital deaths in Tanzania, 2006-2015
Abstract
Background: Understanding the causes of inpatient mortality in hospitals is important for monitoring the population health and evidence-based planning for curative and public health care. Dearth of information on causes and trends of hospital mortality in most countries of Sub-Saharan Africa has resulted to wide use of model-based estimation methods which are characterized by estimation errors. This retrospective analysis used primary data to determine the cause-specific mortality patterns among inpatient hospital deaths in Tanzania from 2006-2015.
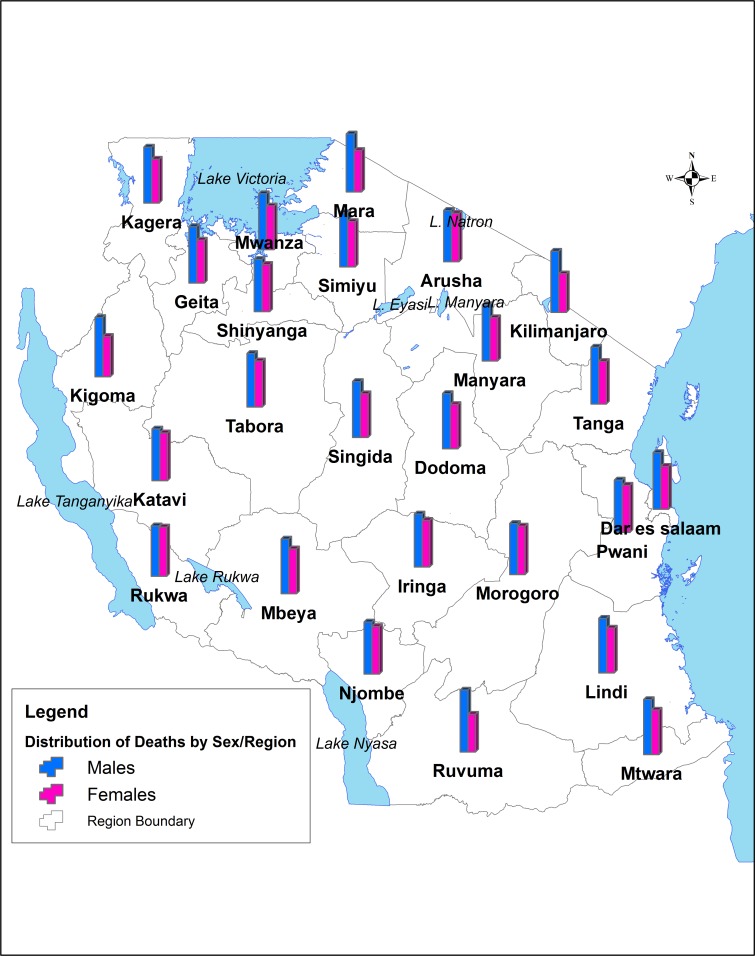
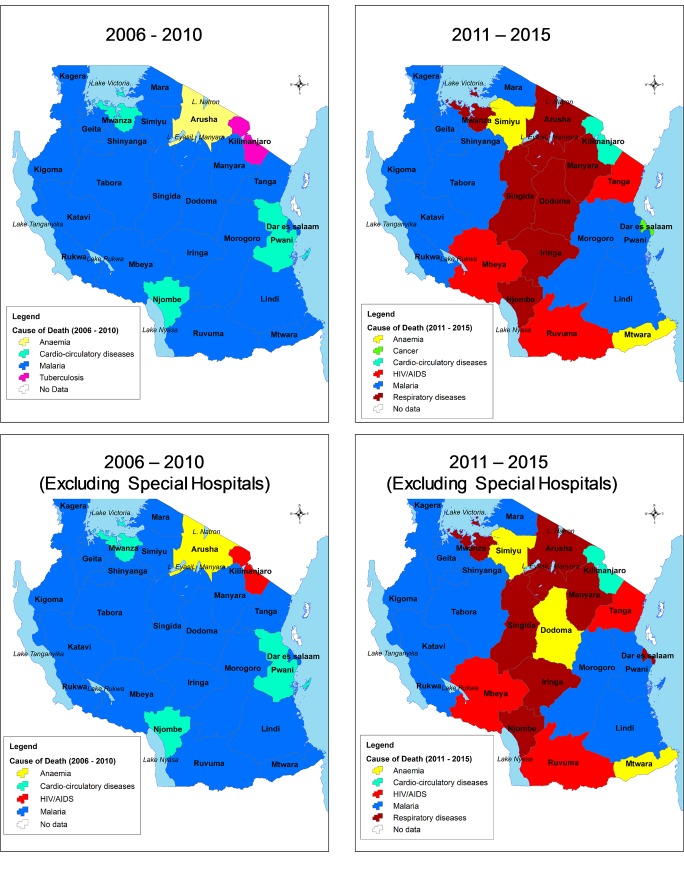
Materials and methods: The analysis was carried out from July to December 2016 and involved 39 hospitals in Tanzania. A review of hospital in-patient death registers and report forms was done to cover a period of 10 years. Information collected included demographic characteristics of the deceased and immediate underlying cause of death. Causes of death were coded using international classification of diseases (ICD)-10. Data were analysed to provide information on cause-specific, trends and distribution of death by demographic and geographical characteristics.
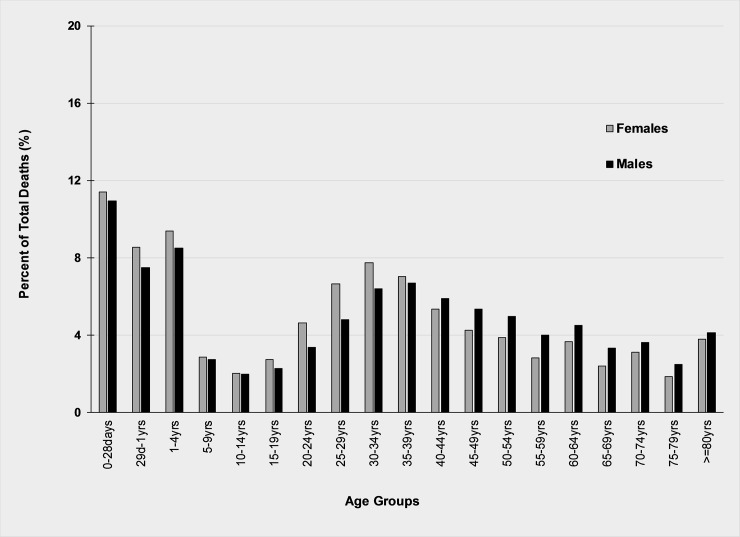
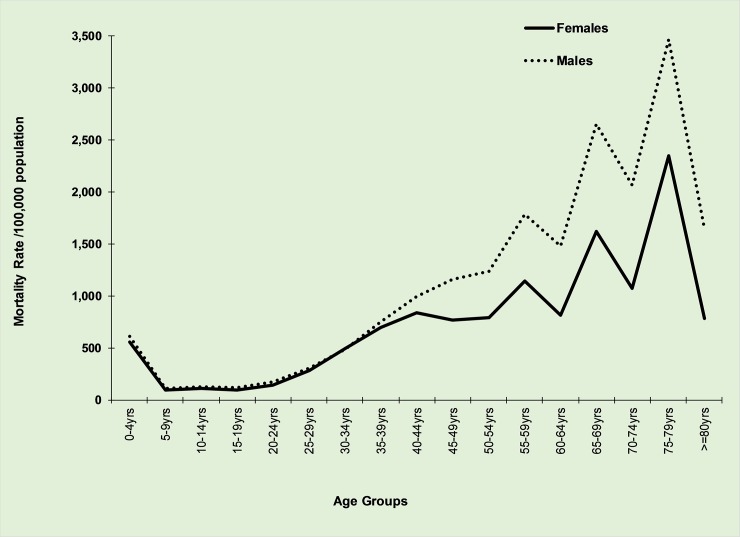
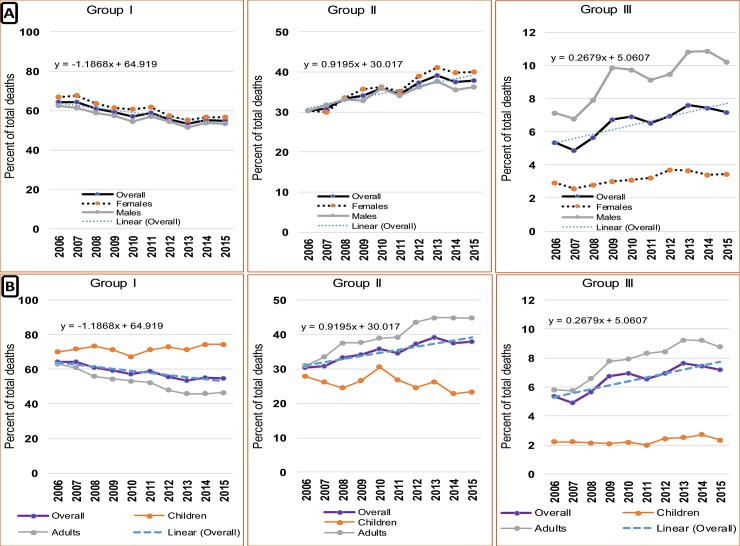
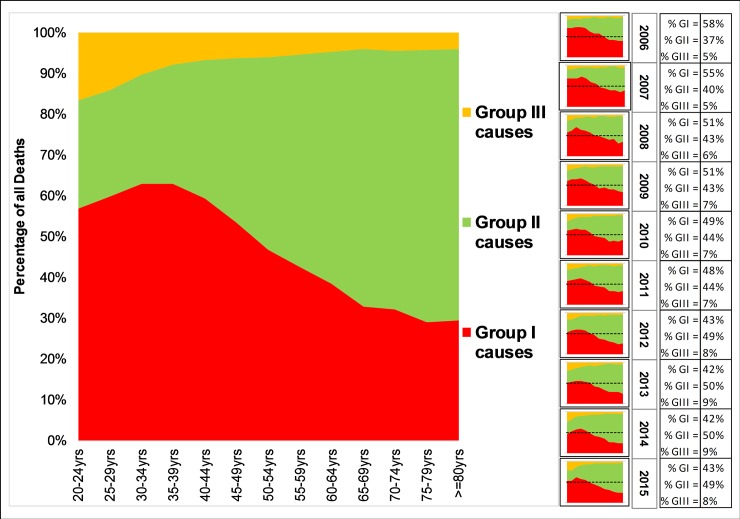
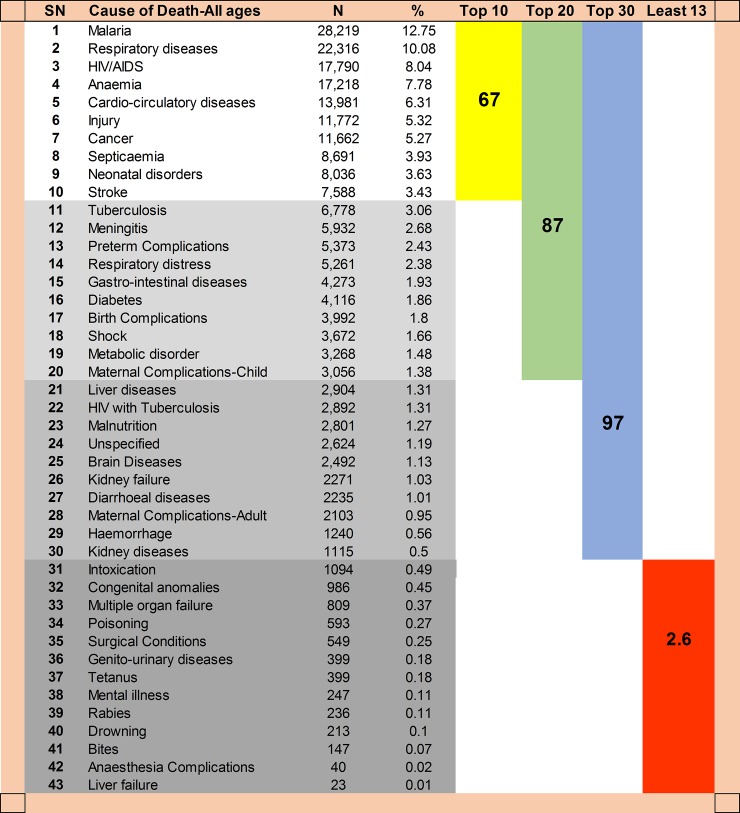
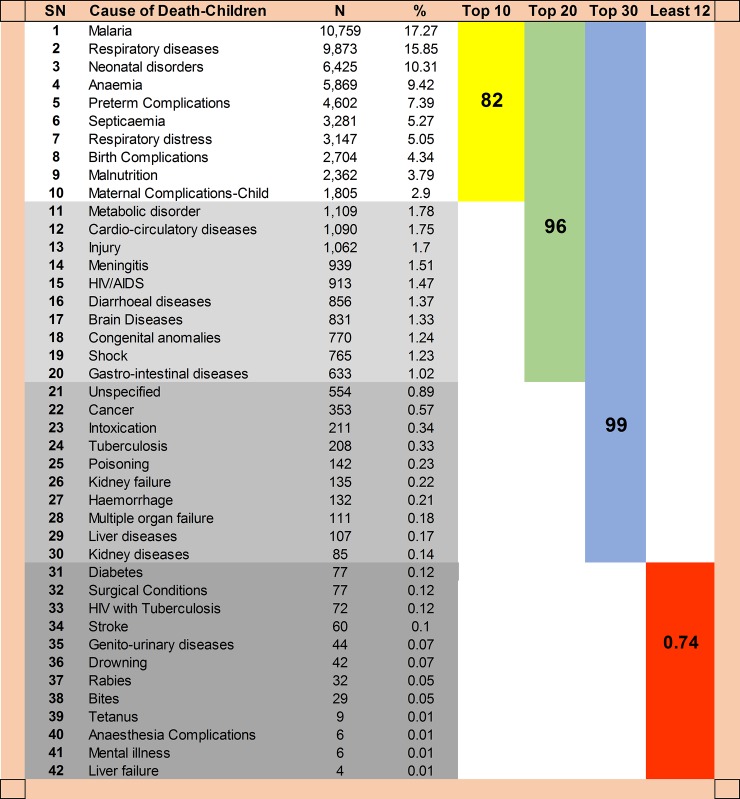
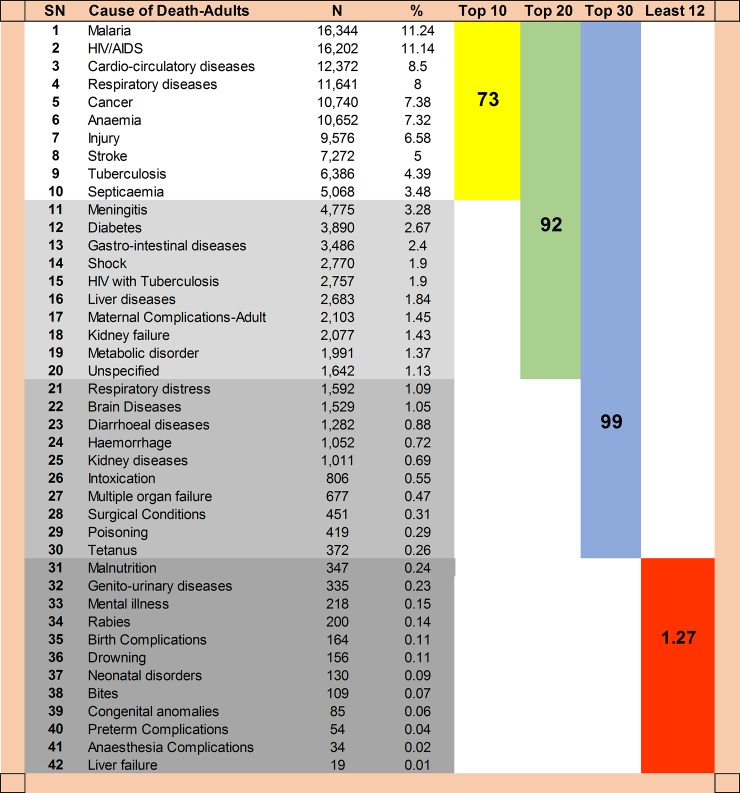
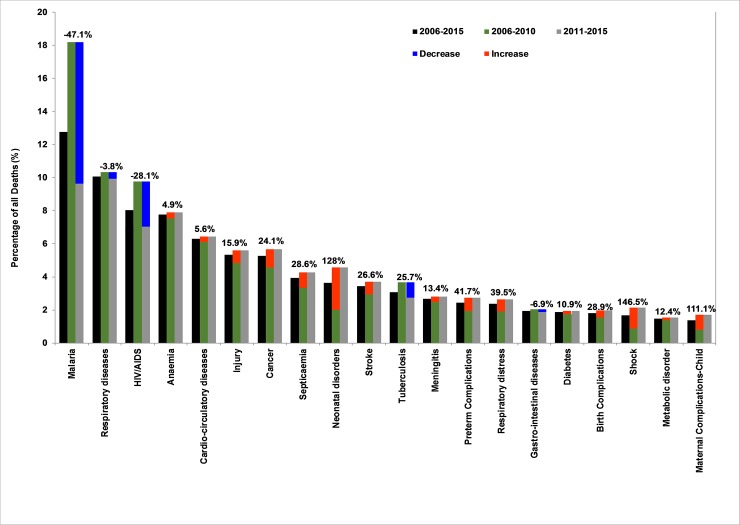
Principal findings: A total of 247,976 deaths were captured over a 10-year period. The median age at death was 30 years, interquartile range (IQR) 1, 50. The five leading causes of death were malaria (12.75%), respiratory diseases (10.08%), HIV/AIDS (8.04%), anaemia (7.78%) and cardio-circulatory diseases (6.31%). From 2006 to 2015, there was a noted decline in the number of deaths due to malaria (by 47%), HIV/AIDS (28%) and tuberculosis (26%). However, there was an increase in number of deaths due to neonatal disorders by 128%. Malaria and anaemia killed more infants and children under 5 years while HIV/AIDS and Tuberculosis accounted for most of the deaths among adults.
Conclusion: The leading causes of inpatient hospital death were malaria, respiratory diseases, HIV/AIDS, anaemia and cardio-circulatory diseases. Death among children under 5 years has shown an increasing trend. The observed trends in mortality indicates that the country is lagging behind towards attaining the global and national goals for sustainable development. The increasing pattern of respiratory diseases, cancers and septicaemia requires immediate attention of the health system.
Conflict of interest statement
The authors have declared that no competing interests exist.
Figures
References
-
- Lozano R, Naghavi M, Foreman K, Lim S, Shibuya K, Aboyans V, et al. Global and regional mortality from 235 causes of death for 20 age groups in 1990 and 2010: A systematic analysis for the Global Burden of Disease Study 2010. Lancet. 2012;380(9859):2095–128. 10.1016/S0140-6736(12)61728-0 - DOI - PMC - PubMed
-
- Baingana F, Bos E. Changing patterns of disease and mortality in Sub-Saharan Africa: an overview. In: Disease and Mortality in Sub-Saharan Africa. 2006. - PubMed
-
- Timaeus DB and IM. Levels and Trends of Adult Mortality In: Jamison DT, Feachem RG, Makgoba MW, Bos ER, Baingana FK, Hofman KJ, et al., editors. Disease and Mortality in Sub-Saharan Africa . Second Edi. Washington, DC: the International Bank for Reconstruction and Development/The World Bank; 2006. p. 31–42. - PubMed
-
- Walker S, Rampatige R, Wainiqolo I, Aumua A. An accessible method for teaching doctors about death certification. Heal Inf Manag J. 2012;41(1):4–10. - PubMed
Publication types
MeSH terms
LinkOut - more resources
Full Text Sources
Medical
