. 2019 Jan 8;47(D1):D411-D418.
doi: 10.1093/nar/gky1068.

OrthoInspector 3.0: open portal for comparative genomics

Affiliations

OrthoInspector 3.0: open portal for comparative genomics

Yannis Nevers et al. Nucleic Acids Res. .

Abstract

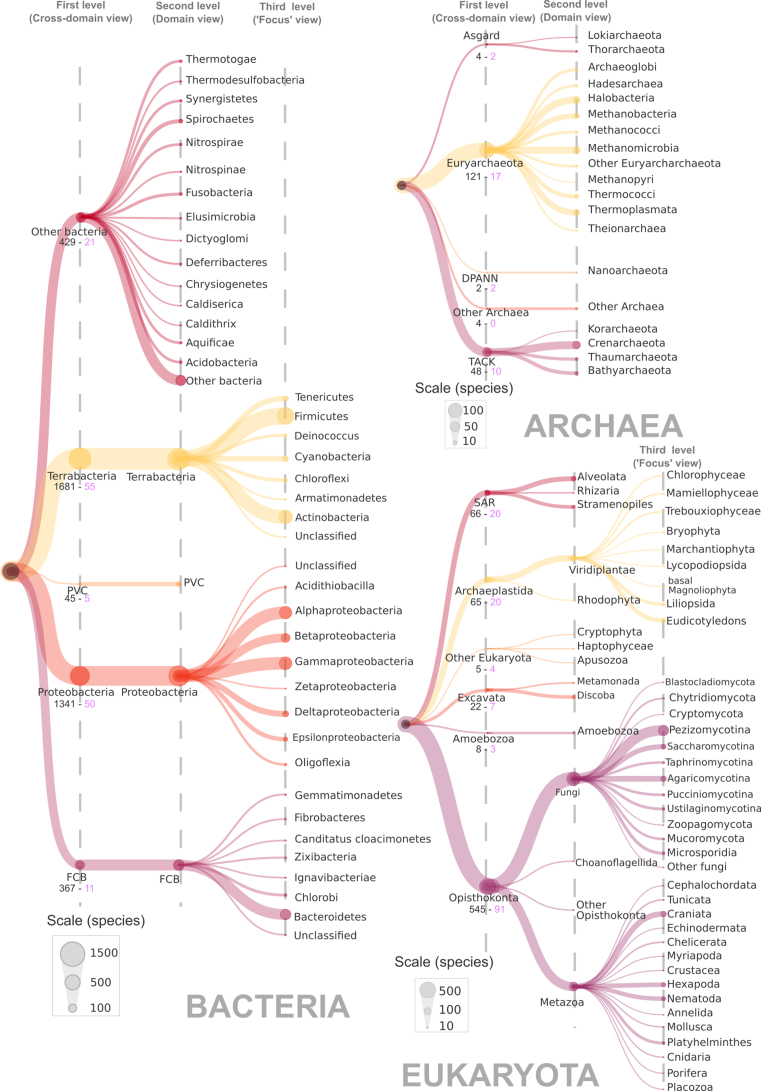
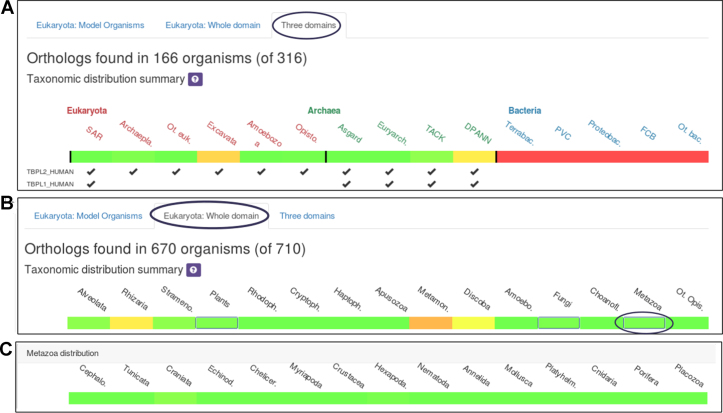
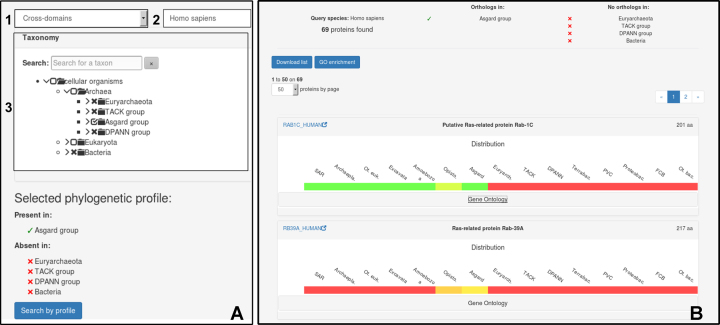
OrthoInspector is one of the leading software suites for orthology relations inference. In this paper, we describe a major redesign of the OrthoInspector online resource along with a significant increase in the number of species: 4753 organisms are now covered across the three domains of life, making OrthoInspector the most exhaustive orthology resource to date in terms of covered species (excluding viruses). The new website integrates original data exploration and visualization tools in an ergonomic interface. Distributions of protein orthologs are represented by heatmaps summarizing their evolutionary histories, and proteins with similar profiles can be directly accessed. Two novel tools have been implemented for comparative genomics: a phylogenetic profile search that can be used to find proteins with a specific presence-absence profile and investigate their functions and, inversely, a GO profiling tool aimed at deciphering evolutionary histories of molecular functions, processes or cell components. In addition to the re-designed website, the OrthoInspector resource now provides a REST interface for programmatic access. OrthoInspector 3.0 is available at http://lbgi.fr/orthoinspectorv3.


Figures

Figure 1.
Figure 1.
Taxonomic distribution of species represented in OrthoInspector. The domain trees are distributed on three ‘levels’. The first level corresponds to the cross-domain taxonomic distribution heatmap shown when browsing the cross-domain database, the second level is shown on the heatmap for domain specific databases and the third level is the ‘focus view’ available for certain clades (see Figure 2). The size of a node is proportional to the number of species in the corresponding clades according to indicated scales. The number of species and model species in first-level clades are displayed in black and pink respectively.
Figure 2.
Figure 2.
Taxonomic distribution heatmaps. Each labelled tile corresponds to a clade and is colored according to the proportion of species in the clade with at least one ortholog. Colors range from red (no species) to green (all species). (A) Heatmap corresponding to the cross-domain database. The domain of life of the clades is shown by an additional label and a color code. Inparalogs distribution is indicated by a tick under each clade. (B) Heatmap corresponding to the eukaryotic database. The box framed by a thin blue outline can be expanded to ‘focus view’. (C) Heatmap corresponding to the ‘focus view’ of Metazoa.
Figure 3.
Figure 3.
Phylogenetic profile search interface. (A) Definition of the phylogenetic profile. User selects: (1) the database, (2) the query species in the drop-down menu and (3) the presence/absence constraints using the phylogenetic tree. A summary of constraints is shown below the tree. Here, human proteins absent in Prokaryotes except the archaeal Asgard group are selected. (B) Output of the profile search. Constraints are included on the top with the number of proteins found. Proteins are displayed in panels, showing their distributions and functional information. Gene Ontology enrichment can be performed on the protein list.

References

    1. Fitch W.M. Distinguishing homologous from analogous proteins. Syst. Zool. 1970; 19:99–113. - PubMed
    1. Tatusov R.L., Koonin E.V., Lipman D.J.. A Genomic Perspective on Protein Families. Science. 1997; 278:631–637. - PubMed
    1. Nehrt N.L., Clark W.T., Radivojac P., Hahn M.W.. Testing the Ortholog Conjecture with Comparative Functional Genomic Data from Mammals. PLOS Comput. Biol. 2011; 7:e1002073. - PMC - PubMed
    1. Altenhoff A.M., Studer R.A., Robinson-Rechavi M., Dessimoz C.. Resolving the ortholog conjecture: orthologs tend to be weakly, but significantly, more similar in function than paralogs. PLoS Comput. Biol. 2012; 8:e1002514. - PMC - PubMed
    1. Koonin E.V. Orthologs, paralogs, and evolutionary genomics. Annu. Rev. Genet. 2005; 39:309–338. - PubMed

Publication types