

Effect of ferric citrate on serum phosphate and fibroblast growth factor 23 among patients with nondialysis-dependent chronic kidney disease: path analyses
- PMID: 30380116
- PMCID: PMC6603396
- DOI: 10.1093/ndt/gfy318
Effect of ferric citrate on serum phosphate and fibroblast growth factor 23 among patients with nondialysis-dependent chronic kidney disease: path analyses
Abstract
Background: Among patients with nondialysis-dependent chronic kidney disease (NDD-CKD) and iron-deficiency anemia (IDA), ferric citrate increases hemoglobin and iron parameters and reduces serum phosphate and fibroblast growth factor 23 (FGF23), a key phosphate-regulating hormone. We conducted post hoc analyses of a phase 3 trial to explore associations between iron replacement, serum phosphate changes and FGF23 regulation.
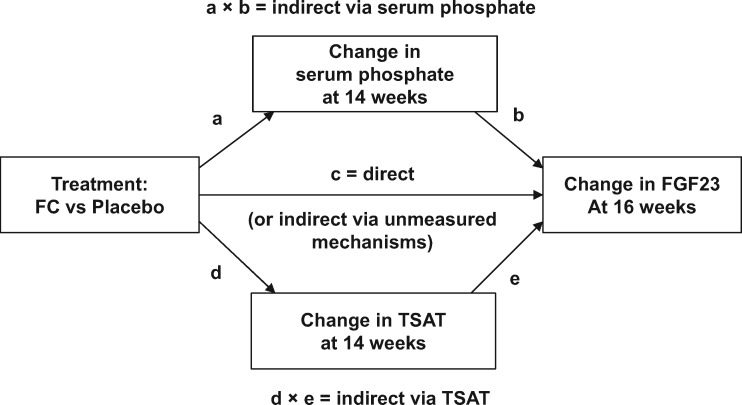
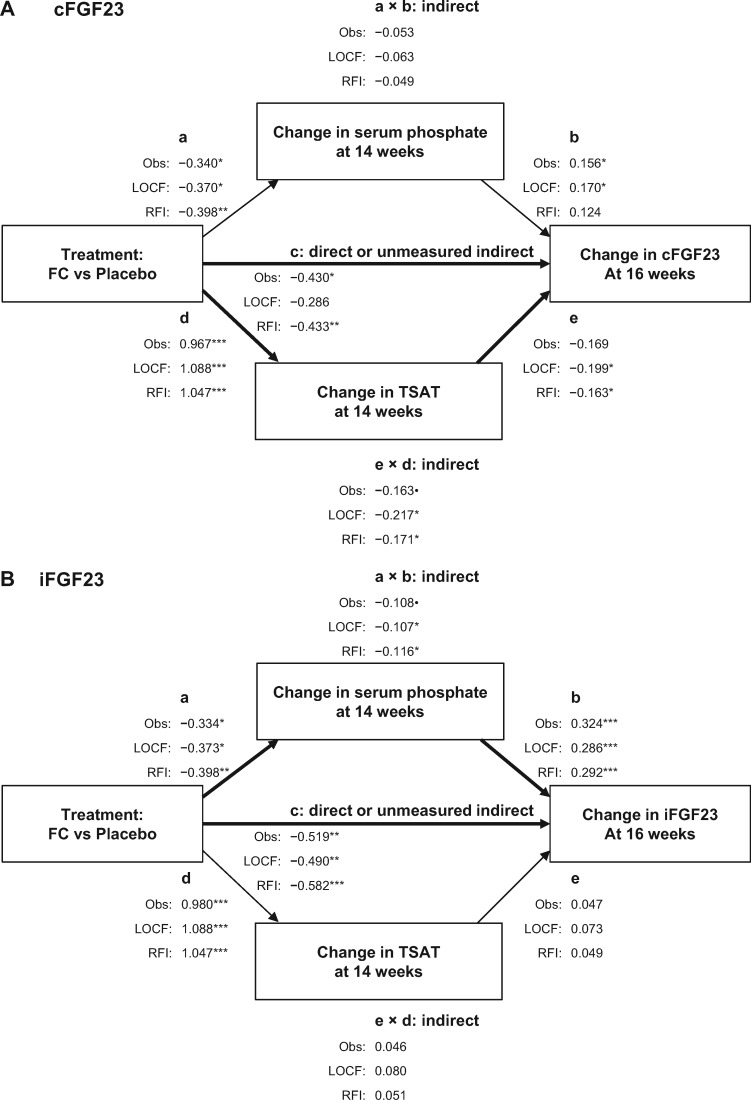
Methods: We employed multivariable regression and longitudinal mixed-effects models to identify and confirm, respectively, whether baseline demographic and laboratory variables were associated with ferric citrate-induced changes in serum phosphate or FGF23 concentrations. We employed path analyses to determine whether changes in FGF23 concentrations were mediated via changes in serum phosphate and/or transferrin saturation (TSAT).
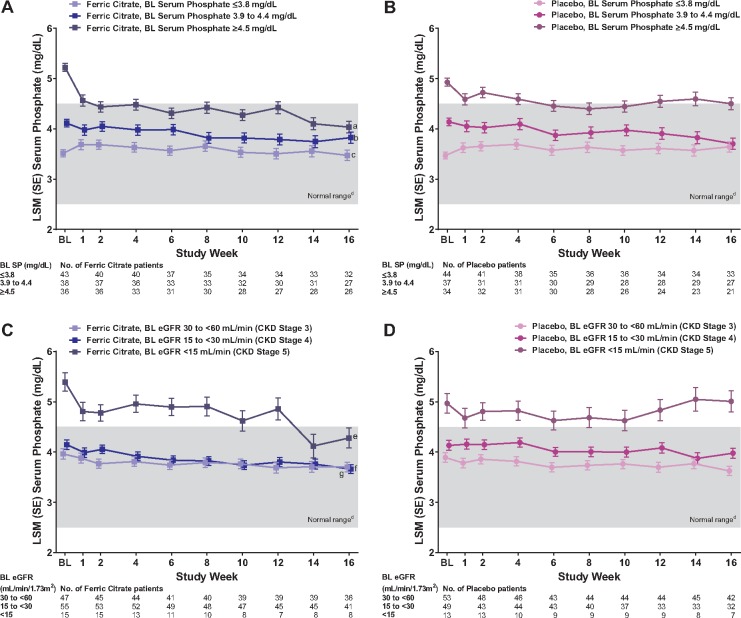
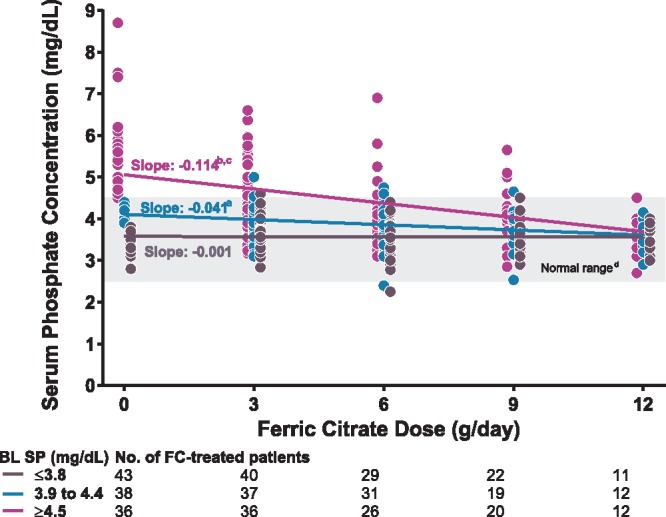
Results: We analyzed a total of 117 and 115 ferric citrate-treated and placebo-treated patients, respectively. At 16 weeks, ferric citrate significantly reduced serum phosphate versus placebo (P = 0.006) only among patients with elevated baseline serum phosphate (≥4.5 mg/dL) and did not reduce serum phosphate among patients with baseline serum phosphate within the population reference range. Ferric citrate reduced intact FGF23 and C-terminal FGF23 partially via changes in TSAT (for C-terminal FGF23) and serum phosphate (for intact FGF23) and partially via unknown/unmeasured mechanisms.
Conclusions: Ferric citrate reduced serum FGF23 concentrations (partially via effects on serum phosphate and iron balance) and did not reduce serum phosphate among patients with baseline serum phosphate concentrations within the population reference range.
Keywords: FGF23; ferric citrate; iron-deficiency anemia; nondialysis-dependent chronic kidney disease; serum phosphate.
© The Author(s) 2018. Published by Oxford University Press on behalf of ERA-EDTA.
Figures
References
-
- van Nooten FE, Green J, Brown R. et al. Burden of illness for patients with non-dialysis chronic kidney disease and anemia in the United States: review of the literature. J Med Econ 2010; 13: 241–256 - PubMed
-
- Block GA, Ix JH, Ketteler M. et al. Phosphate homeostasis in CKD: report of a scientific symposium sponsored by the National Kidney Foundation. Am J Kidney Dis 2013; 62: 457–473 - PubMed
Publication types
MeSH terms
Substances
LinkOut - more resources
Full Text Sources
Medical
