. 2018 Dec 13;379(24):2330-2341.
doi: 10.1056/NEJMoa1808777. Epub 2018 Oct 31.

Immune Escape of Relapsed AML Cells after Allogeneic Transplantation

Affiliations

Immune Escape of Relapsed AML Cells after Allogeneic Transplantation

Matthew J Christopher et al. N Engl J Med. .

Abstract

Background: As consolidation therapy for acute myeloid leukemia (AML), allogeneic hematopoietic stem-cell transplantation provides a benefit in part by means of an immune-mediated graft-versus-leukemia effect. We hypothesized that the immune-mediated selective pressure imposed by allogeneic transplantation may cause distinct patterns of tumor evolution in relapsed disease.

Methods: We performed enhanced exome sequencing on paired samples obtained at initial presentation with AML and at relapse from 15 patients who had a relapse after hematopoietic stem-cell transplantation (with transplants from an HLA-matched sibling, HLA-matched unrelated donor, or HLA-mismatched unrelated donor) and from 20 patients who had a relapse after chemotherapy. We performed RNA sequencing and flow cytometry on a subgroup of these samples and on additional samples for validation.

Results: On exome sequencing, the spectrum of gained and lost mutations observed with relapse after transplantation was similar to the spectrum observed with relapse after chemotherapy. Specifically, relapse after transplantation was not associated with the acquisition of previously unknown AML-specific mutations or structural variations in immune-related genes. In contrast, RNA sequencing of samples obtained at relapse after transplantation revealed dysregulation of pathways involved in adaptive and innate immunity, including down-regulation of major histocompatibility complex (MHC) class II genes ( HLA-DPA1, HLA-DPB1, HLA-DQB1, and HLA-DRB1) to levels that were 3 to 12 times lower than the levels seen in paired samples obtained at presentation. Flow cytometry and immunohistochemical analysis confirmed decreased expression of MHC class II at relapse in 17 of 34 patients who had a relapse after transplantation. Evidence suggested that interferon-γ treatment could rapidly reverse this phenotype in AML blasts in vitro.

Conclusions: AML relapse after transplantation was not associated with the acquisition of relapse-specific mutations in immune-related genes. However, it was associated with dysregulation of pathways that may influence immune function, including down-regulation of MHC class II genes, which are involved in antigen presentation. These epigenetic changes may be reversible with appropriate therapy. (Funded by the National Cancer Institute and others.).


Figures

Figure 1.
Figure 1.. Expression of Immune-Related Genes among Patients with a Relapse of AML.
RNA sequencing was performed on enriched acute myeloid leukemia (AML) blasts from paired samples obtained at initial presentation and at relapse from patients who had a relapse after transplantation and from patients who had a relapse after chemotherapy. Each panel shows the gene expression in individual patients; the numbers are patient identifiers. The lines show the change in gene expression between the presentation sample (left data point) and the relapse sample (right data point). Among the patients with a post-transplantation relapse, 221 genes showed significant (false discovery rate [FDR], <0.05) differential expression between the presentation and relapse samples. These included genes involved in immune function, such as the major histocompatibility complex (MHC) class II genes HLADPB1, HLA-DQB1, and HLA-DRB1 (Panels A, B, and C, respectively), as well as the gene encoding the T-cell costimulatory protein CD86 and the gene encoding the MHC class II invariant chain CD74 (Panels D and E, respectively). In four of seven post-transplantation relapse samples, there was also decreased expression of CIITA, a master transcriptional regulator of MHC class II genes (Panel F); this change was not significant. CPM denotes count per million mapped sequence reads.
Figure 2.
Figure 2.. Expression of MHC Proteins on the Surface of AML Cells from Patients with a Relapse after Transplantation.
To validate the results of RNA sequencing, which showed down-regulation of MHC class II genes in some patients with a relapse of AML after transplantation, flow cytometry was performed (Panel A). Shown is the expression of MHC proteins on AML cells (CD45 dim, side scatter low) in presentation and relapse samples from patients with a post-transplantation relapse, as compared with negative controls. The samples were stained with a fluorescently tagged antibody that recognized MHC class II proteins (HLA-DR, HLA-DP, and HLA-DQ; top row) or an antibody that recognized MHC class I proteins (HLA-A, HLA-B, and HLA-C; bottom row). The sample from Patient 440422 is an example of a case that did not show down-regulation of MHC class II at relapse; this finding is consistent with the data from RNA sequencing for this patient. To determine whether the down-regulation of MHC class II at relapse was reversible, flow cytometry was performed on samples that were treated with interferon-γ (Panel B). Shown is the expression of MHC class II proteins on AML cells in relapse samples from patients with a post-transplantation relapse associated with down-regulation of MHC class II, as compared with negative controls. The cells were cultured for up to 72 hours in the presence or absence of interferon-γ, and the expression of MHC class II proteins was assessed at different time points. For each patient, the French–American–British classification of AML is shown;a classification of M0 AML indicates AML with minimal differentiation, M2 AML indicates AML with maturation, and M4 AML indicates acute myelomonocytic leukemia.
Figure 3.
Figure 3.. In Vitro CD4+ T-Cell Activation Induced by AML Cells from Patients with a Relapse after Transplantation.
Cryopreserved presentation and relapse samples from patients with a post-transplantation relapse who had down-regulation of MHC class II at relapse (Panel A) or did not have down-regulation of MHC class II at relapse (Panel B) were incubated with HLA-mismatched third-party donor CD4+ T cells for 4 days. CD4+ T cells from two or three separate donors were used for each assay. Activation of CD4+ T cells was measured with an interferon-γ enzyme-linked immunospot assay (top row in each panel) or with flow cytometry for activation markers CD137 and CD279 (bottom row in each panel). Relapse samples from patients who had down-regulation of MHC class II (Panel A) caused minimal stimulation of third-party CD4+ T cells, whereas paired presentation samples stimulated third-party CD4+ T cells effectively. In contrast, paired presentation and relapse samples from patients who did not have down-regulation of MHC class II (Panel B) stimulated CD4+ T cells equivalently. For each patient, the French–American–British classification of AML is shown; a classification of M0 AML indicates AML with minimal differentiation, M1 AML indicates AML with minimal maturation, M2 AML indicates AML with maturation, M4 AML indicates acute myelomonocytic leukemia, and M5 AML indicates acute monoblastic leukemia.
Figure 4.
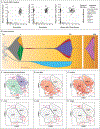
Figure 4.. Clonal Evolution of AML in a Patient with a Relapse after Chemotherapy and after Transplantation.
Clonal evolution with post-chemotherapy and post-transplantation relapse was analyzed in one patient in the study (Patient 452198). Panel A shows scatter plots of somatic mutations that were found in AML cells obtained at presentation, at relapse after chemotherapy, and at relapse after transplantation according to variant allele frequency. Each data point represents the variant allele frequency of a single somatic mutation in the two indicated samples. At each time point, clusters of mutations are designated with a distinct color and shape to indicate that they represent distinct clonal populations. The mutated genes associated with each cluster are indicated in the key. Panel B shows a “fish plot” that represents the clonal evolution that can be inferred from the variant allele frequencies of somatic mutations that are shown on the scatter plots. Chemotherapy began on day 0, the first relapse was detected at day 505, and the second relapse was detected at day 3269. The dominant subclone at both post-chemotherapy relapse and post-transplantation relapse was derived from a small subclone that was detected at presentation (in red), which evolved with new mutations of unknown significance after each therapy. Panels C through H show the results of single-cell RNA sequencing that was performed on cryopre-served presentation and post-transplantation relapse samples. Cells obtained at both presentation and relapse were superimposed onto a single two-dimensional plot and clustered according to their unique expression profiles with the use of t-distributed stochastic neighbor embedding (t-SNE). The axes (t-SNE1 and t-SNE2) show dimensionless values that were assigned to individual cells by the t-SNE algorithm, which places cells that have similar expression profiles close to one another. At presentation (P) and relapse (R), AML cells (AMLP and AMLR) represent the dominant cell type, and small populations of T cells (T cellP and T cellR) and B cells (B cellP and B cellR) can also be discerned. Panel C shows a t-SNE plot in which the cells are colored and labeled according to their inferred identity (AMLP, AMLR, B cell, or T cell); AML cells from presentation and relapse have unique expression patterns that identify them as distinct entities. In Panels D through H, the intensity of the coloring is relative to the expression of each indicated gene. In Panel D, expression of HLA-DRA is detected in the vast majority of AML cells at presentation but in virtually none at relapse; however, expression of HLA-DRA is detected in B cells at both presentation and relapse. In Panel E, expression of the housekeeping gene GAPDH is similar in all cell types at both presentation and relapse. In Panels F and G, expression of genes associated with T-cell exhaustion (ICOS and PD1, respectively) is detected in scattered T cells at presentation and is not increased at relapse. In Panel H, expression of the gene encoding the T-cell activation marker granzyme A (GZMA) is strongly detected in a subset of T cells at both presentation and relapse.

Comment in

References

    1. Dickinson AM, Norden J, Li S, et al. Graft-versus-leukemia effect following hematopoietic stem cell transplantation for leukemia. Front Immunol 2017; 8: 496. - PMC - PubMed
    1. Weiden PL, Sullivan KM, Flournoy N, Storb R, Thomas ED, Seattle Marrow Transplant Team. Antileukemic effect of chronic graft-versus-host disease — contribution to improved survival after allogeneic marrow transplantation. N Engl J Med 1981; 304: 1529–33. - PubMed
    1. Weiden PL, Flournoy N, Thomas ED, et al. Antileukemic effect of graft-versus-host disease in human recipients of allogeneic-marrow grafts. N Engl J Med 1979; 300: 1068–73. - PubMed
    1. Mielcarek M, Storer BE, Flowers MED, Storb R, Sandmaier BM, Martin PJ. Outcomes among patients with recurrent high-risk hematologic malignancies after allogeneic hematopoietic cell transplantation. Biol Blood Marrow Transplant 2007; 13: 1160–8. - PubMed
    1. Pollyea DA, Artz AS, Stock W, et al. Outcomes of patients with AML and MDS who relapse or progress after reduced intensity allogeneic hematopoietic cell transplantation. Bone Marrow Transplant 2007; 40: 1027–32. - PubMed

Publication types

MeSH terms