. 2018 Oct 30;25(5):1204-1213.e4.
doi: 10.1016/j.celrep.2018.10.002.

Differential Roles of IL-2 Signaling in Developing versus Mature Tregs

Affiliations

Differential Roles of IL-2 Signaling in Developing versus Mature Tregs

Martin Y Fan et al. Cell Rep. .

Abstract

Although Foxp3+ regulatory T cells (Tregs) require interleukin-2 (IL-2) for their development, it has been unclear whether continuing IL-2 signals are needed to maintain lineage stability, survival, and suppressor function in mature Tregs. We generated mice in which CD25, the main ligand-binding subunit of the IL-2 receptor, can be inducibly deleted from Tregs after thymic development. In contrast to Treg development, we find that IL-2 is dispensable for maintaining lineage stability in mature Tregs. Although continuous IL-2 signaling is needed for long-term Treg survival, CD25-deleted Tregs may persist for several weeks in vivo using IL-7. We also observe defects in glycolytic metabolism and suppressor function following CD25 deletion. Thus, unlike developing Tregs in which the primary role of IL-2 is to initiate Foxp3 expression, mature Tregs require continuous IL-2 signaling to maintain survival and suppressor function, but not to maintain lineage stability.

Keywords: CD25; IL-15; IL-2; IL-7; regulatory T cell.


Conflict of interest statement

DECLARATION OF INTERESTS

The authors declare no competing interests.

Figures

Figure 1.
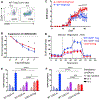
Figure 1.. Loss of Tregs following CD25 Deletion
(A) Sample CD25 gating for CD4+ Foxp3+ RFP+ Tregs showing cutoffs for CD25hi cells. WT-Tregs may be stratified into WT CD25hi and WT CD25lo subsets, while CD25-iΔTregs are defined as CD25 cells. (B) Prevalence of RFP+ Foxp3+ cells in blood over time, normalized to initial levels measured 4 days after the first tamoxifen injection. (C and D) Proportion of CD25hi cells among RFP+ Foxp3+ cells (C) and proportion of Foxp3+ cells among CD4+ T cells (D) over time. (E) Expression of CD31, a marker of recent thymic emigrants, among RFP CD25fl/fl and RFP CD25+/+ Tregs 2 weeks after tamoxifen injection. (F and G) BrdU uptake (F) and Annexin-V binding (G) among WT CD25hi, WT CD25lo and CD25-iΔTregs 2 weeks following tamoxifen injection. Representative gating is shown to the left of each graph. MFI, mean fluorescent intensity. Values shown are mean ± SD. Data were analyzed using a two-tailed Student’s t test, n = 6 mice (E), or a one-way ANOVA with Tukey’s post-test correction, n = 8–9 mice (F and G). **p < 0.01, ****p < 0.0001. See also Figure S4.
Figure 2.
Figure 2.. CD25-iΔTregs Have Reduced Foxp3 Expression but Maintain Lineage Stability
(A) Foxp3 levels among WT CD25hi, WT CD25lo, and CD25-iΔTregs following tamoxifen injection. (B) Left: representative gating of RFP+ cells to measure Foxp3 expression. Right: Foxp3 histograms, with each line representing a histogram from an individual mouse 10 weeks after tamoxifen administration. (C) Foxp3 expression among WT CD25hi, WT CD25lo, and CD25-iΔTregs at 2 weeks (left) and 10 weeks (right) after tamoxifen administration. MFI, mean fluorescent intensity. Values shown are mean ± SD. Data were analyzed using a one-way ANOVA with Tukey’s post-test correction. n = 8–9 mice, **p < 0.01, ***p < 0.001, ****p < 0.0001.
Figure 3.
Figure 3.. Surface Staining of CD25-iΔTregs Resembles that of WT CD25lo Tregs
Splenic RFP+ Foxp3+ Tregs were analyzed by flow cytometry 2 weeks after tamoxifen injection for expression of major Treg surface proteins, including PD-1 (A) and ICOS (B) and CD127, the IL-7 receptor alpha subunit (C). For each marker, representative histograms are shown at top. MFI, mean fluorescent intensity. Values shown are mean ± SD. Data were analyzed using a one-way ANOVA with Tukey’s post-test correction, n = 6–8 mice. *p < 0.05, ***p < 0.001, ****p < 0.0001. See also Figure S5.
Figure 4.
Figure 4.. Survival of CD25hi Tregs following CD25 Deletion
(A) Tamoxifen-untreated CD25hi or CD25lo Tregs were sorted from WT-Treg or CD25-iΔTreg donors and transferred into separate CD45.1 + recipients. Mice were allowed 1 week to rest, injected with tamoxifen, and sacrificed 2 weeks later. (B) Sample plot showing recovery of donor CD45.2+ cells. (C) Sample CD25 histograms of recovered CD45.2+ Tregs, showing cutoffs for CD25hi cells. (D) Quantification of CD25hi cells among recovered Tregs. (E) Percentage of RFP+ cells among CD45.2+ cells. Representative histogram of RFP expression shown left. (F) Recovery of donor cells following tamoxifen treatment. Values shown are mean ± SD. Data were analyzed using a two-way ANOVA with Tukey’s post-test correction, n = 3–4 mice. **p < 0.01, ****p < 0.0001.
Figure 5.
Figure 5.. Reduced Suppressor Function and Glycolysis among CD25-iΔTregs
(A) Sample gating showing dual expression of CD69 and CD154 among 1 × 10⁵ target Foxp3 CD4+ T cells in the absence (left) or presence (right) of an equal number of WT-Tregs. (B) Rapid in vitro suppression assay of target cells by titrated numbers of CD25-iΔTregs and WT-Tregs. (C) Clinical severity of EAE in WT-Treg and CD25-iΔTreg mice. Mice were immunized with myelin oligodendrocyte peptide and monitored for 1 month. Tamoxifen was administered at the same time as EAE induction and again 2 weeks later. (D) Representative glycolysis stress test of WT CD25hi, WT CD25lo, and CD25-iΔTregs following overnight stimulation in the presence of IL-2. A Seahorse flux analyzer was used to measure extracellular acidification rate (ECAR) of Tregs at baseline and then after treatment with glucose, oligomycin, and 2-deoxyglucose (2-DG) (treatment time, vertical dotted lines). (E and F) Treg glycolytic rate (E) and glycolytic capacity (F) following overnight stimulation in the presence of no cytokine, IL-2, or IL-7. Values shown are mean ± SD. Data were analyzed using a two-tailed Student’s t test, n = 4–5 mice (B) or n = 8–9 mice (C), or a two-way ANOVA with Tukey’s post-test correction, n = 5–6 mice (E and F). *p < 0.05, ***p < 0.001, ****p < 0.0001.
Figure 6.
Figure 6.. Concomitant Deprivation of IL-7, but Not IL-15, Exacerbates Treg Loss following CD25 Deletion
(A) Schematic for evaluating efficacy of IL-2, IL-7, and IL-15 at maintaining downstream signals. WT CD25hi Tregs were stimulated overnight, removed from stimulation, and then incubated with one of three cytokines for another 24 hr. (B and C) Maintenance of downstream phosphorylation by IL-2, IL-7, and IL-15. Bars in representative histograms (B) indicate cutoffs for cells retaining phosphorylation. (D) CD25-iΔTregs or WT CD25hi Tregs were adoptively transferred into IL-15 KO or IL-7 KO recipients, with an equal number of CD45.1+ CD25hi cells. Recipient mice were sacrificed after 2 weeks. (E and F) Sample gates are shown for recovery of CD45.1+ cells (E) and RFP+ Tregs (F). (G and H) Recovery of WT-Tregs (G) and CD25-iΔTregs (H) following 2 weeks of IL-15 or IL-7 deprivation in vivo. Values shown are mean ± SD. Data were analyzed using a one-way ANOVA with Dunnett’s post-test correction, n = 3 samples (C), or a one-way ANOVA with Tukey’s post-test correction, n = 4–5 mice (G and H). *p < 0.05, **p < 0.01. See also Figure S6.

References

    1. Bielekova B, Catalfamo M, Reichert-Scrivner S, Packer A, Cerna M, Waldmann TA, McFarland H, Henkart PA, and Martin R (2006). Regulatory CD56(bright) natural killer cells mediate immunomodulatory effects of IL-2Ralpha-targeted therapy (daclizumab) in multiple sclerosis. Proc. Natl. Acad. Sci.USA 103, 5941–5946. - PMC - PubMed
    1. Burchill MA, Yang J, Vogtenhuber C, Blazar BR, and Farrar MA (2007). IL-2 receptor beta-dependent STAT5 activation is required for the development of Foxp3+ regulatory T cells. J. Immunol. 178, 280–290. - PubMed
    1. Canavan JB, Afzali B, Scottà C, Fazekasova H, Edozie FC, Macdonald TT, Hernandez-Fuentes MP, Lombardi G, and Lord GM (2012). A rapid diagnostic test for human regulatory T-cell function to enable regulatory T-cell therapy. Blood 119, e57–e66. - PMC - PubMed
    1. Chinen T, Kannan AK, Levine AG, Fan X, Klein U, Zheng Y, Gasteiger G, Feng Y, Fontenot JD, and Rudensky AY (2016). An essential role for the IL-2 receptor in Treg cell function. Nat. Immunol. 17, 1322–1333. - PMC - PubMed
    1. Cornish GH, Sinclair LV, and Cantrell DA (2006). Differential regulation of T-cell growth by IL-2 and IL-15. Blood 108, 600–608. - PubMed

Publication types

LinkOut - more resources