. 2018 Oct 30;25(5):1346-1358.
doi: 10.1016/j.celrep.2018.10.014.

Large Differences in Small RNA Composition Between Human Biofluids

Affiliations

Large Differences in Small RNA Composition Between Human Biofluids

Paula M Godoy et al. Cell Rep. .

Abstract

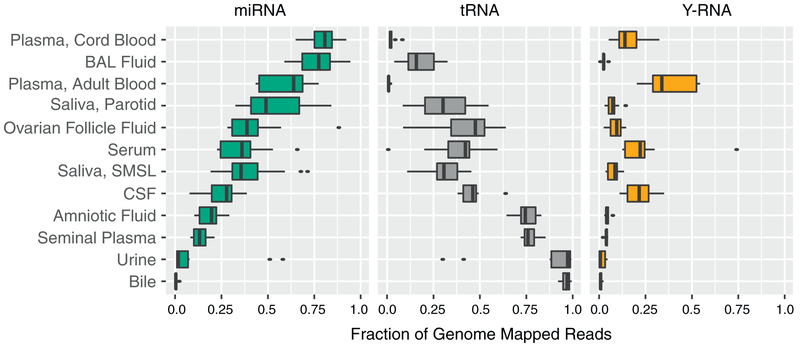
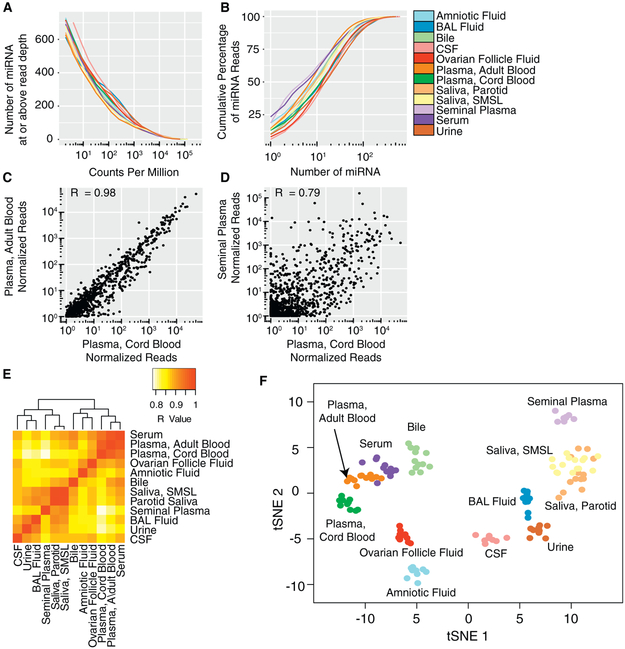
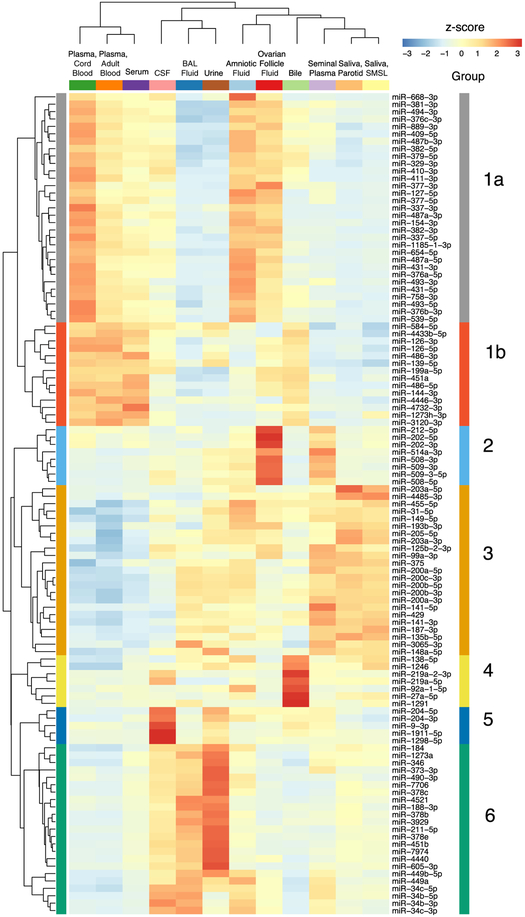
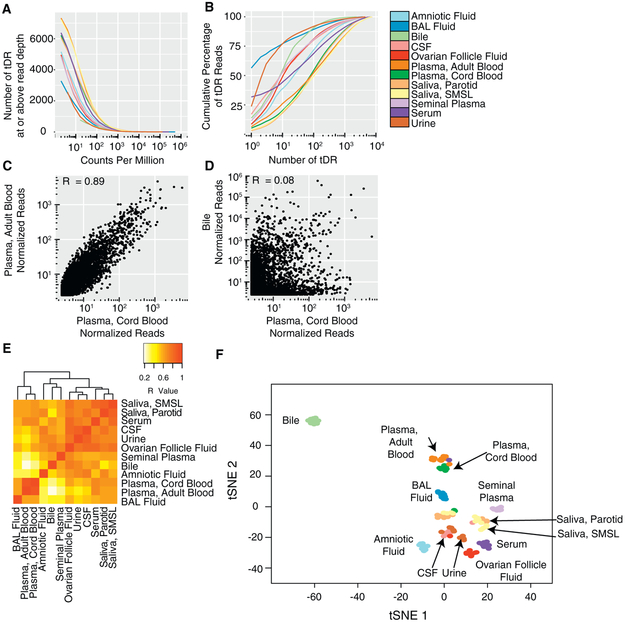
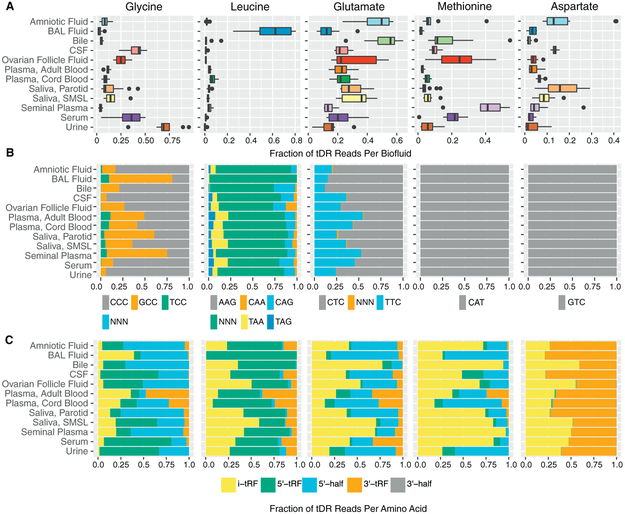
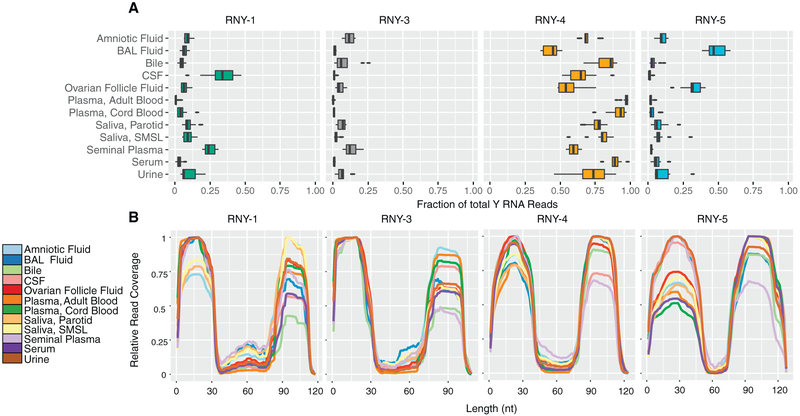
Extracellular microRNAs (miRNAs) and other small RNAs are implicated in cellular communication and may be useful as disease biomarkers. We systematically compared small RNAs in 12 human biofluid types using RNA sequencing (RNA-seq). miRNAs and tRNA-derived RNAs (tDRs) accounted for the majority of mapped reads in all biofluids, but the ratio of miRNA to tDR reads varied from 72 in plasma to 0.004 in bile. miRNA levels were highly correlated across all biofluids, but levels of some miRNAs differed markedly between biofluids. tDR populations differed extensively between biofluids. Y RNA fragments were seen in all biofluids and accounted for >10% of reads in blood plasma, serum, and cerebrospinal fluid (CSF). Reads mapping exclusively to Piwi-interacting RNAs (piRNAs) were very rare, except in seminal plasma. These results demonstrate extensive differences in small RNAs between human biofluids and provide a useful resource for investigating extracellular RNA biology and developing biomarkers.

Keywords: Y RNA; biofluids; extracellular RNA; miRNA; tRNA.


Figures

Figure 1.
Figure 1.. Distribution of RNA Biotypes Differs between Biofluids
Reads mapping to miRNAs, tRNAs, Y-RNAs, piRNAs, mRNAs, or other RNA biotypes as a fraction of total reads mapping to the human transcriptome. Boxes represent median and interquartile ranges, whiskers represent 1.5 times the interquartile range, and dots represent outliers.
Figure 2.
Figure 2.. miRNA Profiles in 12 Biofluid Types
(A) Number of miRNAs detected as a function of read depth. (B) Cumulative distribution of miRNA reads. See also Figure S1. (C and D) Examples of pairwise correlations between biofluids for cord blood plasma versus adult blood plasma (C) and cord blood plasma versus seminal plasma (D) Each point represents the median normalized read count for a single miRNA for the indicated biofluids. One normalized read count was added to each measurement to allow representation of log read counts for miRNAs with no reads. (E) Correlations for all pairs of biofluids. (F) tSNE plot produced using miRNA read counts. Each point represents a single biofluid sample.
Figure 3.
Figure 3.. miRNAs with Highly Correlated Read Counts across 12 Biofluids
Hierarchical clustering heatmap depicting scaled miRNA read counts for six groups (1–6) of five or more miRNAs with similar abundance patterns across biofluids using Bayesian relevance network analysis. Z scores indicate levels of miRNA relative to levels of the same miRNA in other biofluids.
Figure 4.
Figure 4.. tDR Profiles across 12 Biofluid Types
(A) Number of tDRs detected as a function of read depth. (B) Cumulative distribution of tDR reads. See also Figure S4. (C and D) Examples of pairwise correlations between biofluids for cord blood plasma versus adult blood plasma (C) and cord blood plasma versus bile (D). Each point represents the median normalized read count for a single tDR for the indicated biofluids. One normalized read count was added to each measurement to allow representation of read counts for tDRs with no reads on a log scale. (E) Correlations for all pairs of biofluids. (F) tSNE plot produced using tDR read counts. Each point represents a single biofluid sample.
Figure 5.
Figure 5.. tDR Abundance by Amino Acid, Anticodon, and Fragment Type
(A) tDR abundance by amino acid. Boxes represent median and interquartile ranges, whiskers represent 1.5 × the interquartile range. Dots represent outliers. (B) tDR abundance by anticodon. (C) tDR abundance by fragment type. Data are shown for tDRs from the five most highly represented tRNAs. Data for other tDRs are shown in Figures S5–S7.
Figure 6.
Figure 6.. Y RNA Fragments in 12 Biofluid Types
(A) Distribution of Y RNA reads by Y RNA gene. Boxes represent median and interquartile ranges, whiskers represent 1.5 × the interquartile range. Dots represent outliers. (B) Y RNA read-mapping positions. We determined the number of reads covering each nucleotide of each full-length Y RNA. Values are normalized to the position of each Y RNA with the largest number of reads in each biofluid.

References

    1. Argyropoulos C, Wang K, McClarty S, Huang D, Bernardo J, Ellis D, Orchard T, Galas D, and Johnson J (2013). Urinary microRNA profiling in the nephropathy of type 1 diabetes. PLoS ONE 8, e54662. - PMC - PubMed
    1. Arroyo JD, Chevillet JR, Kroh EM, Ruf IK, Pritchard CC, Gibson DF, Mitchell PS, Bennett CF, Pogosova-Agadjanyan EL, Stirewalt DL, et al. (2011). Argonaute2 complexes carry a population of circulating microRNAs independent of vesicles in human plasma. Proc. Natl. Acad. Sci. USA 108, 5003–5008. - PMC - PubMed
    1. Bahn JH, Zhang Q, Li F, Chan TM, Lin X, Kim Y, Wong DT, and Xiao X (2015). The landscape of microRNA, Piwi-interacting RNA, and circular RNA in human saliva. Clin. Chem. 61, 221–230. - PMC - PubMed
    1. Barger JF, Rahman MA, Jackson D, Acunzo M, and Nana-Sinkam SP (2016). Extracellular miRNAs as biomarkers in cancer. Food Chem. Toxicol. 98 (Pt A), 66–72. - PMC - PubMed
    1. Chakrabortty SK, Prakash A, Nechooshtan G, Hearn S, and Gingeras TR (2015). Extracellular vesicle-mediated transfer of processed and functional RNY5 RNA. RNA 21, 1966–1979. - PMC - PubMed

Publication types