. 2018 Oct 30;19(11):3404.
doi: 10.3390/ijms19113404.

Identification and Expression Analyses of SBP-Box Genes Reveal Their Involvement in Abiotic Stress and Hormone Response in Tea Plant (Camellia sinensis)

Affiliations

Identification and Expression Analyses of SBP-Box Genes Reveal Their Involvement in Abiotic Stress and Hormone Response in Tea Plant (Camellia sinensis)

Pengjie Wang et al. Int J Mol Sci. .

Abstract

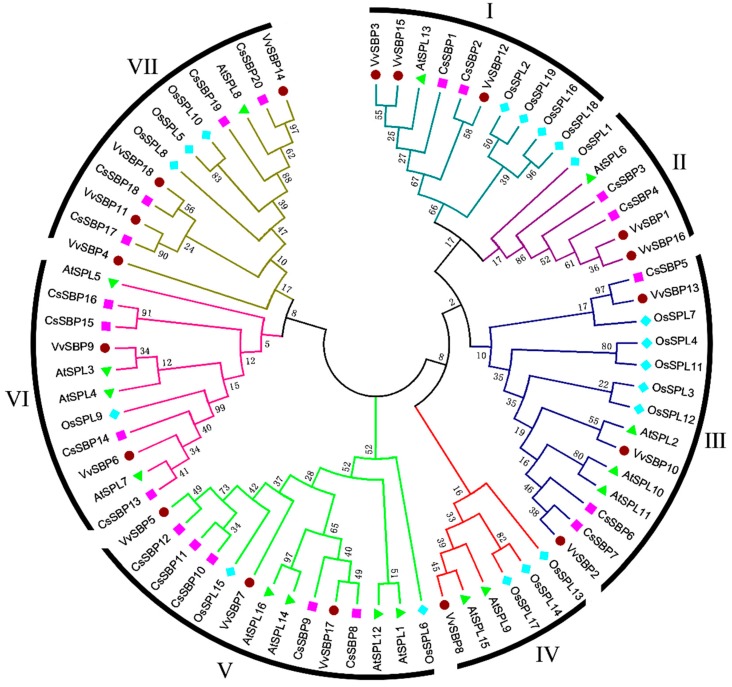
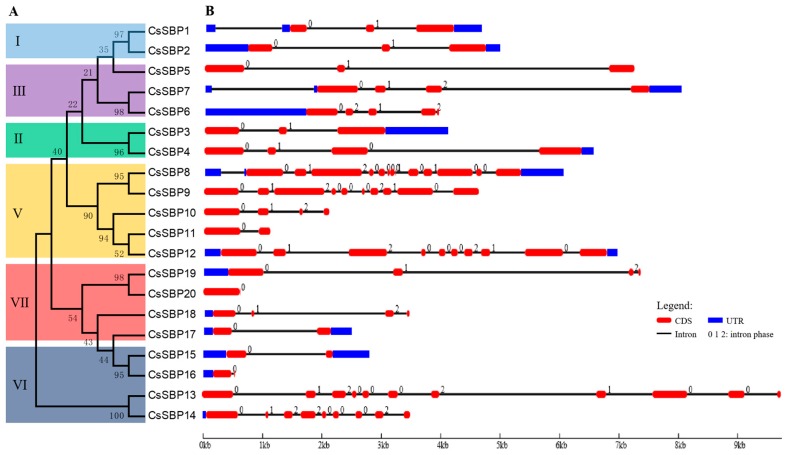
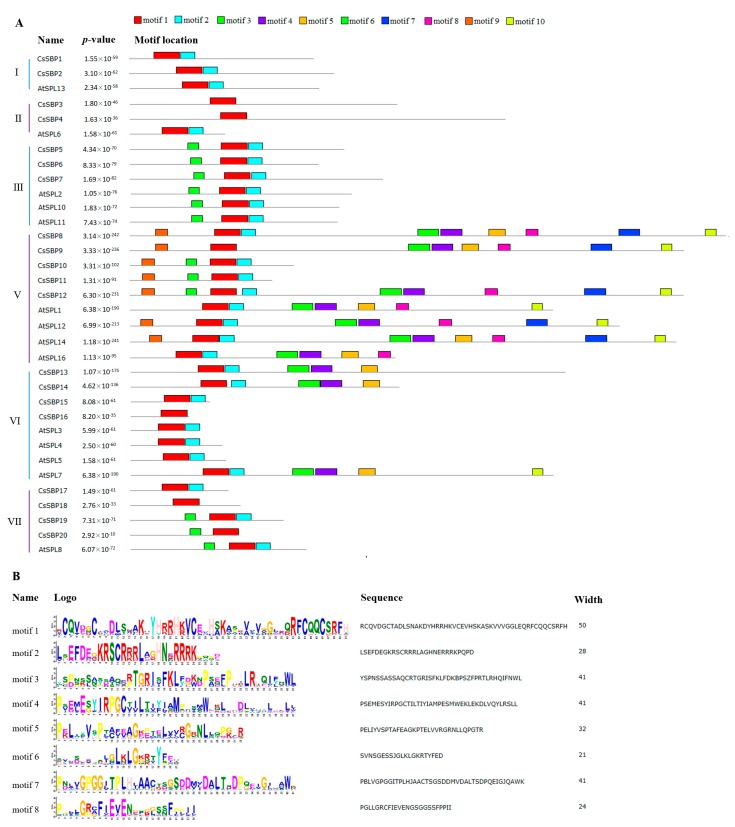
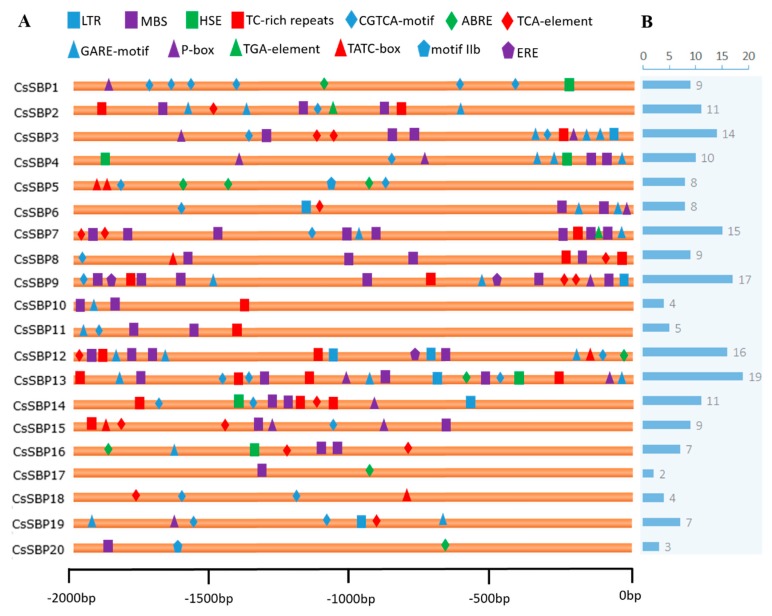
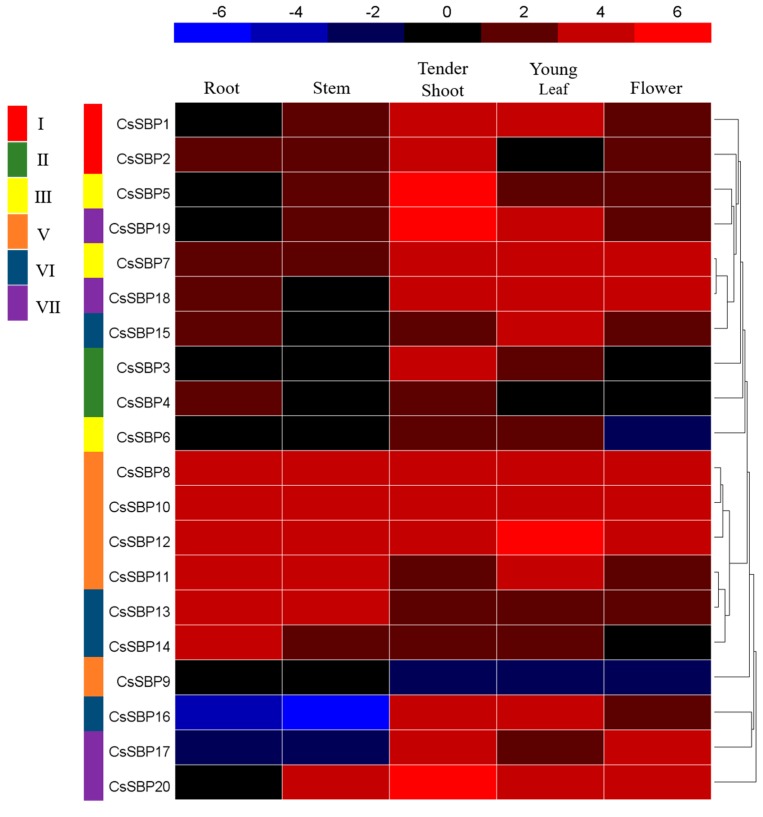
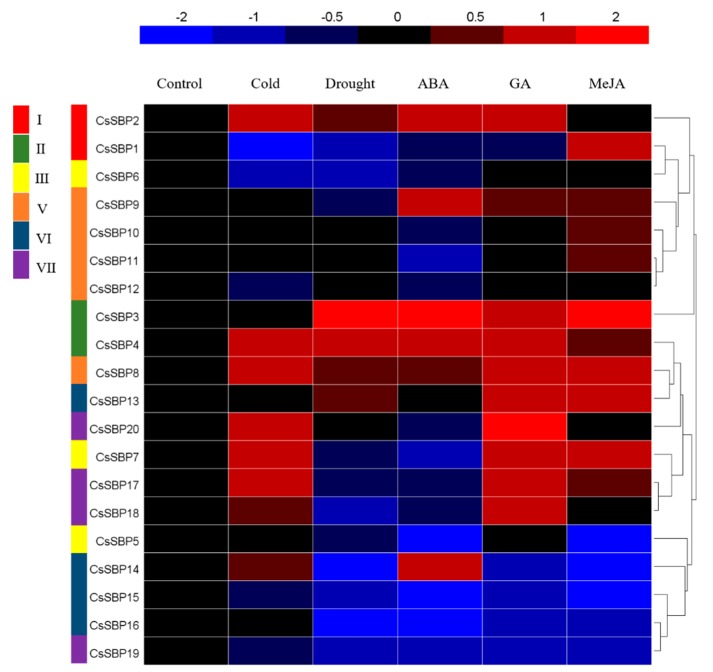
The SQUAMOSA promoter binding protein (SBP)-box gene family is a plant-specific transcription factor family. This family plays a crucial role in plant growth and development. In this study, 20 SBP-box genes were identified in the tea plant genome and classified into six groups. The genes in each group shared similar exon-intron structures and motif positions. Expression pattern analyses in five different tissues demonstrated that expression in the buds and leaves was higher than that in other tissues. The cis-elements and expression patterns of the CsSBP genes suggested that the CsSBP genes play active roles in abiotic stress responses; these responses may depend on the abscisic acid (ABA), gibberellic acid (GA), and methyl jasmonate (MeJA) signaling pathways. Our work provides a comprehensive understanding of the CsSBP family and will aid in genetically improving tea plants.

Keywords: Camellia sinensis; SBP-box; abiotic stress; expression profile; hormone.


Conflict of interest statement

The authors declare no conflict of interest.

Figures

Figure 1
Figure 1
The percentage identity matrix of CsSBP proteins. The heatmap was conducted based on the CsSBP protein sequences. The colored bar indicates the correlation of protein sequences of two genes, blue represents a low correlation, red represents a high correlation, and yellow represents a correlation that is 1. The correlated values of the CsSBP proteins are listed in Table S2.
Figure 2
Figure 2
Multiple sequence alignment of the SQUAMOSA promoter binding protein (SBP) domains in tea plant. (A) The sequence logos of the conserved SBP domains were analyzed using WebLogo. The y axis (measured in bits) depicts the overall height of the stack, indicating the sequence conservation at that position, while the height of the symbols within the stack indicates the relative frequency of each amino at that position. (B) The SBP domain sequences were aligned using DNAMAN 7.0 software; the two zinc-finger structures and nuclear localization signal (NLS) are indicated.
Figure 3
Figure 3
Phylogenetic tree of SBP domains created in MEGA 5.0. The sequences of the SBP domain are from tea plant (CsSBP), Arabidopsis (AtSPL), rice (OsSPL) and grape (VvSBP). All SBP members were classified into seven groups (I–VII), and their sequences and sources are listed in Table S4.
Figure 4
Figure 4
Phylogenetic tree of the CsSBP gene family and the exon-intron structures of tea plant SBP proteins. (A) The phylogenetic tree of the CsSBP genes was created using the MEGA 5.0 software with the neighbor-joining method; bootstrap values from 1000 replicates are indicated at each node. (B) Exon-intron structures were described using GSDS 2.0. Red, round-cornered rectangles represent exons, black lines represent introns, and blue rectangles represent untranslated regions (UTRs). The numbers 0, 1, and 2 represent intron phases.
Figure 5
Figure 5
Conserved motifs of CsSBP proteins from tea plant and Arabidopsis. (A) The different-colored boxes represent different motifs and their positions in each SBP sequence. (B) The sequences and logos of the identified motifs in tea plant and Arabidopsis.
Figure 6
Figure 6
Predicted cis-elements associated with various stress and hormone responses in the CsSBP promoters. (A) Depiction of the distribution of cis-elements that relate to various stress and hormone responses in the 2 kb upstream promoter regions of CsSBP genes. Different cis-elements are represented by different shapes and colors. (B) Numbers of stress- and hormone-response-related cis-elements in each CsSBP promoter.
Figure 7
Figure 7
Expression profiles of CsSBP genes in different tissues. The colored bar represents the expression values [log2(FPKM)]. Blue represents low expression, and red represents high expression. Different groups of CsSBP genes are marked with rectangles of different colors. The FPKM values of the CsSBP genes in different tissues are listed in Table S5.
Figure 8
Figure 8
Expression profiles of CsSBP genes under cold, drought, ABA, GA, and MeJA treatments as determined by qRT-PCR. The relative gene expression levels were calculated using the 2−ΔΔCt method and are expressed as the fold change relative to the expression of the control. Three independent biological replications were performed. The colored bar represents Log2 expression values. Blue represents low expression and red represents high expression. Different groups of CsSBP genes are marked with rectangles of different colors. The expression value of CsSBP genes under five treatments are listed in Table S6.

References

    1. Wheeler D.S., Wheeler W.J. The medicinal chemistry of tea. Drug Dev. Res. 2010;61:45–65. doi: 10.1002/ddr.10341. - DOI
    1. Liu Y., Wang D., Zhang S., Zhao H. Global expansion strategy of Chinese herbal tea beverage. Adv. J. Food Sci. Technol. 2015;7:739–745. doi: 10.19026/ajfst.7.1731. - DOI
    1. Rus A.M., Bressan R.A., Hasegawa P.M. Unraveling salt tolerance in crops. Nat. Genet. 2005;37:1029–1030. doi: 10.1038/ng1005-1029. - DOI - PubMed
    1. Zheng C., Wang Y., Ding Z., Zhao L. Global transcriptional analysis reveals the complex relationship between tea quality, leaf senescence and the responses to cold-drought combined stress in Camellia sinensis. Front. Plant Sci. 2016;7:1858. doi: 10.3389/fpls.2016.01858. - DOI - PMC - PubMed
    1. Wang W., Xin H., Wang M., Ma Q., Wang L., Kaleri N.A., Wang Y., Li X. Transcriptomic analysis reveals the molecular mechanisms of drought-stress-induced decreases in Camellia sinensis Leaf quality. Front. Plant Sci. 2016;7:385. doi: 10.3389/fpls.2016.00385. - DOI - PMC - PubMed

MeSH terms

LinkOut - more resources