. 2018 Oct 31;10(465):eaap8677.
doi: 10.1126/scitranslmed.aap8677.

Antisense oligonucleotides targeting mutant Ataxin-7 restore visual function in a mouse model of spinocerebellar ataxia type 7

Affiliations

Antisense oligonucleotides targeting mutant Ataxin-7 restore visual function in a mouse model of spinocerebellar ataxia type 7

Chenchen Niu et al. Sci Transl Med. .

Abstract

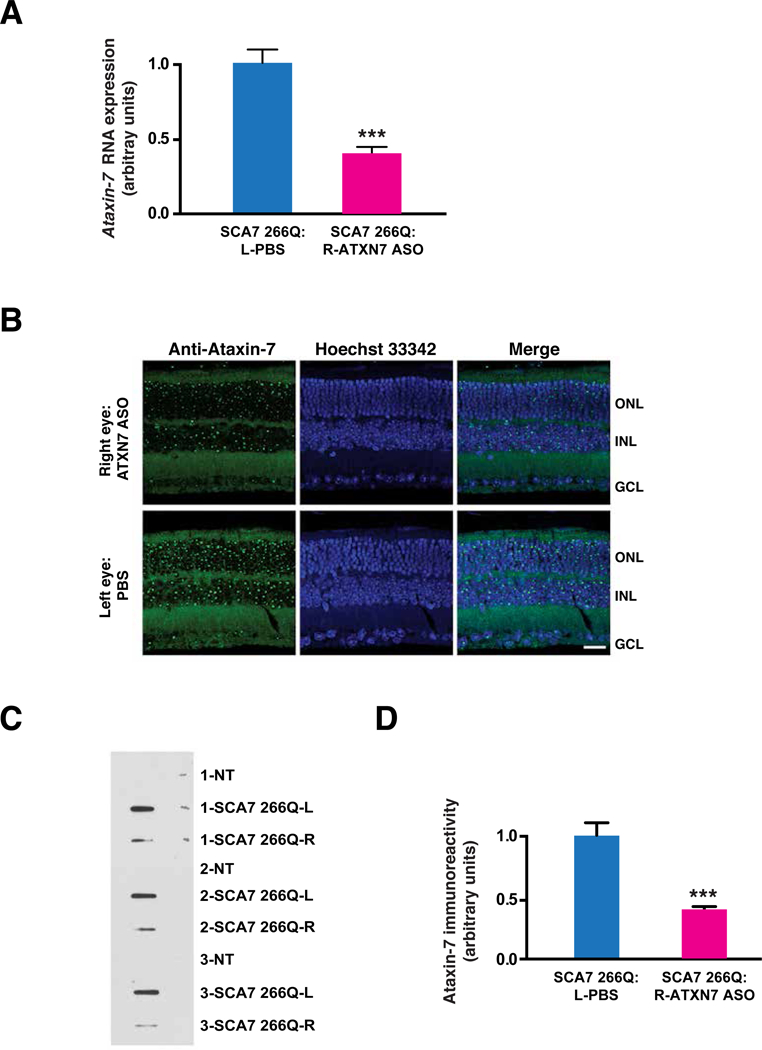
Spinocerebellar ataxia type 7 (SCA7) is an autosomal dominant neurodegenerative disorder characterized by cerebellar and retinal degeneration, and is caused by a CAG-polyglutamine repeat expansion in the ATAXIN-7 gene. Patients with SCA7 develop progressive cone-rod dystrophy, typically resulting in blindness. Antisense oligonucleotides (ASOs) are single-stranded chemically modified nucleic acids designed to mediate the destruction, prevent the translation, or modify the processing of targeted RNAs. Here, we evaluated ASOs as treatments for SCA7 retinal degeneration in representative mouse models of the disease after injection into the vitreous humor of the eye. Using Ataxin-7 aggregation, visual function, retinal histopathology, gene expression, and epigenetic dysregulation as outcome measures, we found that ASO-mediated Ataxin-7 knockdown yielded improvements in treated SCA7 mice. In SCA7 mice with retinal disease, intravitreal injection of Ataxin-7 ASOs also improved visual function despite initiating treatment after symptom onset. Using color fundus photography and autofluorescence imaging, we also determined the nature of retinal degeneration in human SCA7 patients. We observed variable disease severity and cataloged rapidly progressive retinal degeneration. Given the accessibility of neural retina, availability of objective, quantitative readouts for monitoring therapeutic response, and the rapid disease progression in SCA7, ASOs targeting ATAXIN-7 might represent a viable treatment for SCA7 retinal degeneration.


Figures

Figure 1.
Figure 1.. Ataxin-7 (ATXN7) ASO achieves robust and sustained knock-down in mouse neural retina
A)Dose response for Ataxin-7 ASO knock-down in the retinas of wild-type C57BL/6J mice. Mice received a single intravitreal injection of 12.5 μg, 25 μg, or 50 μg of Ataxin-7 ASO in the right eye, and a single intravitreal injection of an identical volume of PBS in the left eye. Ataxin-7 mRNAs were measured by qRT-PCR and expressed as the mean relative to PBS-treated control eyes (n = 7 mice / group). **P < 0.01, ***P < 0.001; t-test. B) Duration of Ataxin-7 ASO knock-down in the retinas of wild-type C57BL/6J mice. Mice received a single intravitreal injection of 50 μg of Ataxin-7 ASO in the right eye, and a single intravitreal injection of PBS in the left eye. Ataxin-7 mRNAs were measured by qRT-PCR and expressed as the mean relative to PBS-treated control eyes (n = 3 – 7 mice / time point). **P < 0.01, ***P < 0.001; t-test. C-D) Distribution of Ataxin-7 ASO in the retinas of wild-type C57BL/6J mice. Mice received a single intravitreal injection of 50 μg of Ataxin-7 ASO in the right eye, and a single intravitreal injection of PBS in the left eye. Retinal sections were immunostained with an anti-ASO antibody (red) and counterstained with Hoechst 33342 (blue) at the indicated time points after intravitreal injection. Scale bars = 20 μm. Error bars = s.e.m. n = 3 mice
Figure 2.
Figure 2.. Ataxin-7 ASO treatment reduces expression and aggregation of polyglutamine- expanded ATAXIN-7 in retina of SCA7 knock-in mice
A)Ataxin-7 mRNA expression in the retinas of SCA7 266Q knock-in mice. Mice received a single intravitreal injection of 50 μg of Ataxin-7 ASO in the right eye, and a single intravitreal injection of PBS in the left eye. Ataxin-7 mRNAs were measured by qRT-PCR and expressed as the mean relative to PBS-treated control eyes (n = 7 mice / group). ***P < 0.001; t-test. B) Effect of Ataxin-7 ASO knock-down on visible aggregates in the retinas of SCA7 266Q knock- in mice. Mice received a single intravitreal injection of 50 μg of Ataxin-7 ASO in the right eye, and a single intravitreal injection of PBS in the left eye. Retinal sections were immunostained with an anti-Ataxin-7 antibody (green) and counterstained with Hoechst 33342 (blue) at 6 weeks after intravitreal injection. ONL = outer nuclear layer; INL = inner nuclear layer; GCL = ganglion cell layer. Scale bar = 20 μm C) Filter trap assay to quantify reduction of Ataxin-7 aggregates in the retinas of SCA7 266Q knock-in mice. Mice received a single intravitreal injection of 50 μg of Ataxin-7 ASO in the right eye, and a single intravitreal injection of PBS in the left eye. Here we see a representative filter trap assay, where each sample represents protein lysates from a single retina of untreated non- transgenic control mice (NT) or SCA7 266Q mice at 6 weeks after intravitreal injection. Protein lysates are filtered through a 0.2 μm pore size cellulose acetate membrane such that insoluble protein is retained on the filter because it cannot pass through the membrane. D) Densitometry quantification of Ataxin-7 immunoreactivity in filter trap assay shown in (C). ***P < 0.001; t-test. Error bars = s.e.m. (n = 3 – 4 mice / group)
Figure 3.
Figure 3.. Ataxin-7 ASO treatment improves cone visual function in SCA7 266Q knock-in mice
A) Representative ERG recording of photopic (cone) responses in untreated wild-type (non-transgenic) and SCA7 266Q mice at 4 weeks after intravitreal injection of 50 μg of Ataxin-7 ASO in the right eye, and intravitreal injection of a control ASO or PBS in the left eye. B) Quantification of mean maximal b-wave amplitudes for ERG analysis shown in (A). *P < 0.05; ***P < 0.001; ANOVA with post-hoc Tukey test. n = 6 – 8 mice / group. NT = non-transgenic control mice. C) Representative ERG recording of photopic (cone) responses in untreated wild-type (non-transgenic) and SCA7 266Q mice at 6 weeks after intravitreal injection of 50 μg of Ataxin-7 ASO in the right eye, and intravitreal injection of a control ASO or PBS in the left eye. D) Quantification of mean maximal b-wave amplitudes for ERG analysis shown in (C). *P < 0.05; ***P < 0.001; ANOVA with post-hoc Tukey test. n = 7 – 10 mice / group. NT = non-transgenic control mice. Error bars = s.e.m.
Figure 4.
Figure 4.. Ataxin-7 ASO treatment rescues rod photoreceptor visual function in SCA7 266Q knock-in mice
A) Representative ERG recording of scotopic (rod) responses in untreated wild-type (non-transgenic) and SCA7 266Q mice at 4 weeks after intravitreal injection of 50 μg of Ataxin-7 ASO in the right eye, and intravitreal injection of a control ASO or PBS in the left eye. B) Quantification of mean maximal b-wave amplitudes for ERG analysis shown in (A). *P < 0.05; ANOVA with post-hoc Tukey test. n = 11 – 13 mice / group. NT = non-transgenic control mice. C) Representative ERG recording of scotopic (rod) responses in untreated wild-type (non-transgenic) and SCA7 266Q mice at 6 weeks after intravitreal injection of 50 μg of Ataxin-7 ASO in the right eye, and intravitreal injection of a control ASO or PBS in the left eye. D) Quantification of mean maximal b-wave amplitudes for ERG analysis shown in (C). **P < 0.01; ***p < 0.001; ANOVA with post-hoc Tukey test. n = 11 – 12 mice / group. NT = non- transgenic control mice. Error bars = s.e.m.
Figure 5.
Figure 5.. Ataxin-7 ASO treatment ameliorates retinal degeneration, photoreceptor gene expression, and epigenetic dysregulation in SCA7 266Q knock-in mice
A) Retinal histology of untreated non-transgenic control and SCA7 266Q mice at 6 weeks after intravitreal injection of 50 μg of Ataxin-7 ASO in the right eye, and intravitreal injection of PBS in the left eye. Sections were stained with hematoxylin and eosin. OS = outer segments; IS = inner segments; ONL = outer nuclear layer; OPL = outer plexiform layer; INL = inner nuclear layer; IPL = inner plexiform layer; GCL = ganglion cell layer. Scale bar = 20 μm B) Quantification of thickness for indicated retinal layers from (A). *P < 0.05, **P < 0.01; ***P< 0.001; ANOVA with post-hoc Tukey test. n = 4 – 5 mice / group. C) Quantification of expression of indicated genes in retinal RNAs by RT-PCR analysis for SCA7 266Q mice at 6 weeks after intravitreal injection of 50 μg of Ataxin-7 ASO in the right eye, and intravitreal injection of PBS in the left eye. *P < 0.05, ***P < 0.001; ANOVA with post-hoc Tukey test. Comparison of RNA expression for PBS-treated SCA7 mice vs. Ataxin-7 ASO-treated SCA7 mice was significant by t-test for M-opsin (P < 0.001) and for S-opsin (P < 0.05). n = 4 −6 mice / group. D) Quantification of histone H2B ubiquitination at the promoters of indicated genes by real-time PCR analysis of retinal DNAs isolated by chromatin immunoprecipitation from SCA7 266Q mice at 6 weeks after intravitreal injection of 50 μ.g of Ataxin-7 ASO in the right eye, and intravitreal injection of PBS in the left eye. *P < 0.05, **P < 0.01; ***P < 0.001; ANOVA with post-hoc Tukey test. n = 5 – 7 mice / group. E) Quantification of histone H3 acetylation at the enhancers / promoters of indicated genes by real-time PCR analysis of retinal DNAs isolated by chromatin immunoprecipitation from SCA7 266Q mice at 6 weeks after intravitreal injection of 50 μg of Ataxin-7 ASO in the right eye, and intravitreal injection of PBS in the left eye. *P < 0.05, **P < 0.01; ***P < 0.001; ANOVA with post-hoc Tukey test. n = 4 – 5 mice / group. M-opsin, M-cone opsin; RER, rhodopsin enhancer region; LCR, locus control region of M-cone opsin; S-opsin, S-cone opsin; SER, S-cone opsin enhancer region. Error bars = s.e.m.
Figure 6.
Figure 6.. CAG-ASO treatment partially improves SCA7 retinal degeneration in mice
A) Effect of CAG-ASO knock-down on visible aggregates in the retinas of SCA7 266Q knock-in mice. Mice received a single intravitreal injection of 50 μg of CAG-ASO in the right eye, and a single intravitreal injection of PBS in the left eye. Retinal sections were immunostained with an anti-Ataxin-7 antibody (green) and counterstained with Hoechst 33342 (blue) at 6 weeks after intravitreal injection. ONL = outer nuclear layer; INL = inner nuclear layer; GCL = ganglion cell layer. Scale bar = 20 μm B) Filter trap assay to quantify reduction of Ataxin-7 aggregates in the retinas of SCA7 266Q knock-in mice. Mice received a single intravitreal injection of 50 μg of CAG-ASO in the right eye, and a single intravitreal injection of PBS in the left eye. Here we see densitometry quantification of Ataxin-7 immunoreactivity in filter trap assays at 6 weeks post-injection. **P < 0.01; ***P < 0.001; ANOVA with post-hoc Tukey test. n = 5 mice / group. C) Quantification of mean maximal b-wave amplitudes for ERG analysis performed on untreated wild-type (non-transgenic) and SCA7 266Q mice at 4 weeks after intravitreal injection of 50 μg of CAG-ASO in the right eye, and intravitreal injection of PBS in the left eye. *P < 0.05, **P < 0.01; ***P < 0.001; ANOVA with post-hoc Tukey test. n = 8 – 11 mice / group. D) Quantification of mean maximal b-wave amplitudes for ERG analysis performed on untreated wild-type (non-transgenic) and SCA7 266Q mice at 6 weeks after intravitreal injection of 50 μg of CAG-ASO in the right eye, and intravitreal injection of PBS in the left eye. **P < 0.01; ***P <0.001; ANOVA with post-hoc Tukey test. n = 8 – 13 mice / group. Error bars = s.e.m.
Figure 7.
Figure 7.. Documentation of phenotype variability and progressive retinal degeneration in human SCA7 patients
A) Color fundus photos (left) and blue-light autofluorescence imaging (right) representing different stages of retinal disease in patients with SCA7. The top image row is from a 55 year-old SCA7 patient (#1; 40 CAG repeat allele) with minimal changes in fundus autofluorescence. The middle and bottom rows represent testing of a 36-year-old SCA7 patient (#2; 51 CAG repeat allele) with moderate disease (middle) that progressed to advanced disease (bottom) after three years. Arrow indicates significant increase in hypo-autofluorescence within the macula, which is indicative of the retinal pigment epithelium atrophy of very severe disease. B) Corresponding ocular coherence tomography (OCT) scans of SCA7 patients #1 and #2. C) Fundus-guided microperimetry testing of SCA7 patient #1 (mild disease) and SCA7 patient #2 (severe disease). The red cross indicates the area that the patient fixates on the target, while being serially presented with points of light of varying intensities at different positions across the retina (colored, numbered dots). Green dots demarcate positions on the retina where the patient perceives a dim light stimulus, while yellow dots demarcate positions on the retina where the patient can only detect a more intense light stimulus, and red open dots indicate positions where there is no detection of the light stimulus.
Figure 8.
Figure 8.. Post-symptomatic treatment of SCA7 retinal degeneration with Ataxin-7 ASO achieves significant beneficial therapeutic response in mice
A) Effect of Ataxin-7 ASO knock-down on visible aggregates in the retinas of symptomatic SCA7 r210 knock-in mice. Mice received a single intravitreal injection of 50 μg of Ataxin-7 ASO in the right eye, and a single intravitreal injection of PBS in the left eye. Retinal sections were immunostained with an anti-Ataxin-7 antibody (green) and counterstained with Hoechst 33342 (blue) at 9 weeks after intravitreal injection. ONL = outer nuclear layer; INL = inner nuclear layer; GCL = ganglion cell layer. Scale bar = 20 μm B) Filter trap assay to quantify reduction of Ataxin-7 aggregates in the retinas of symptomatic SCA7 r210 knock-in mice. Mice received a single intravitreal injection of 50 μg of Ataxin-7 ASO in the right eye, and a single intravitreal injection of PBS in the left eye. Here we see a representative filter trap assay, where each sample represents protein lysates from a single retina of untreated control mice (WT) or SCA7 r210 mice at 9 weeks after intravitreal injection. C) Densitometry quantification of Ataxin-7 immunoreactivity in filter trap assays shown in (B). ***P < 0.001; t-test. (n = 3 – 5 mice / group) D) Quantification of mean maximal b-wave amplitudes for ERG analysis performed on wild-type (non-transgenic, NT) and SCA7 r210 mice at 6 weeks after intravitreal injection of 50 μg of Ataxin-7 ASO in the right eye, and intravitreal injection of PBS in the left eye. *P < 0.05; t-test. n = 5 mice / group. E) Quantification of mean maximal b-wave amplitudes for ERG analysis performed on wild-type (non-transgenic, NT) and SCA7 r210 mice at 9 weeks after intravitreal injection of 50 μ,g of Ataxin-7 ASO in the right eye, and intravitreal injection of PBS in the left eye. *P < 0.05; t-test. n = 5 – 6 mice / group. Error bars = s.e.m.

References

    1. Martin JJ, Van Regemorter N, Krols L, Brucher JM, de Barsy T, Szliwowski H, Evrard P, Ceuterick C, Tassignon MJ, Smet-Dieleman H, et al., On an autosomal dominant form of retinal-cerebellar degeneration: an autopsy study of five patients in one family. Acta Neuropathol 88, 277–286 (1994). - PubMed
    1. Filla A, Mariotti C, Caruso G, Coppola G, Cocozza S, Castaldo I, Calabrese O, Salvatore E, De Michele G, Riggio MC, Pareyson D, Gellera C, Di Donato S, Relative frequencies of CAG expansions in spinocerebellar ataxia and dentatorubropallidoluysian atrophy in 116 Italian families. Eur Neurol 44, 31–36 (2000). - PubMed
    1. Storey E, du Sart D, Shaw JH, Lorentzos P, Kelly L, McKinley Gardner RJ, Forrest SM, Biros I, Nicholson GA , Frequency of spinocerebellar ataxia types 1, 2, 3, 6, and 7 in Australian patients with spinocerebellar ataxia. Am J Med Genet 95, 351–357 (2000). - PubMed
    1. Trottier Y, Lutz Y, Stevanin G, Imbert G, Devys D, Cancel G, Saudou F, Weber C, David G, Tora L, et al., Polyglutamine expansion as a pathological epitope in Huntington’s disease and four dominant cerebellar ataxias. Nature 378, 403–406. (1995). - PubMed
    1. David G, Abbas N, Stevanin G, Durr A, Yvert G, Cancel G, Weber C, Imbert G, Saudou F, Antoniou E, Drabkin H, Gemmill R, Giunti P, Benomar A, Wood N, Ruberg M, Agid Y, Mandel JL, Brice A, Cloning of the SCA7 gene reveals a highly unstable CAG repeat expansion. Nat Genet 17, 65–70 (1997). - PubMed

Publication types

MeSH terms