

Effects of the Potassium-Binding Polymer Patiromer on Markers of Mineral Metabolism
- PMID: 30381412
- PMCID: PMC6364526
- DOI: 10.2215/CJN.04500418
Effects of the Potassium-Binding Polymer Patiromer on Markers of Mineral Metabolism
Abstract
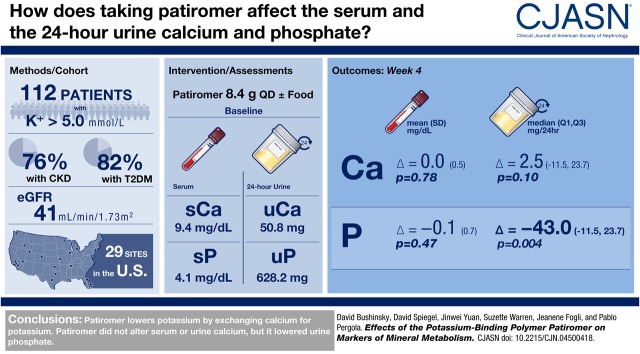
Background and objectives: Patiromer is a sodium-free, nonabsorbed, potassium-binding polymer that uses calcium as the counter-exchange ion and is approved for treatment of hyperkalemia. The 4-week TOURMALINE study in patients with hyperkalemia previously demonstrated that patiromer administered once daily reduces serum potassium similarly when given with or without food. We report a prespecified exploratory efficacy analysis as well as a post hoc efficacy and safety analysis of the TOURMALINE study on circulating markers of mineral metabolism.
Design, setting, participants, & measurements: Adults with hyperkalemia (potassium >5.0 mEq/L) were randomized to once-daily patiromer 8.4 g without/with food for 4 weeks, with doses adjusted to achieve and maintain serum potassium 3.8-5.0 mEq/L. Baseline and week 4 serum and 24-hour urine markers of mineral metabolism are reported for all patients combined (evaluable for efficacy, n=112; evaluable for safety, n=113). P values were calculated using a paired t test for change from baseline, unless otherwise specified.
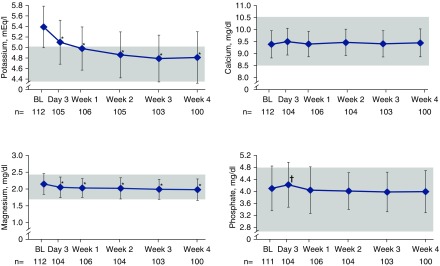
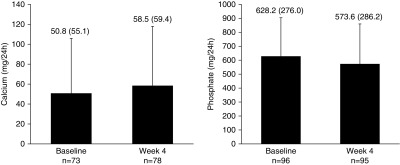
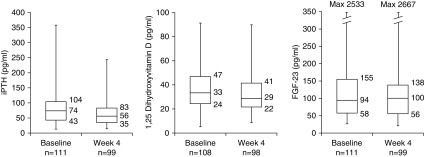
Results: Mean (SD) baseline eGFR was 41±26 ml/min per 1.73 m2. Mean (SD) changes from baseline to week 4 were 0.0±0.5 mg/dl (P=0.78; n=100) for albumin-corrected serum calcium, -0.2±0.2 mg/dl (P<0.001; n=100) for serum magnesium, and -0.1±0.7 mg/dl (P=0.47; n=100) for serum phosphate. Median (quartile 1, quartile 3) changes in 24-hour creatinine-normalized urine calcium and phosphate from baseline to week 4 were 2.5 (-11.5, 23.7) mg/24 h (P=0.10; n=69) and -43.0 (-162.6, 35.7) mg/24 h (P=0.004; n=95), respectively. Median (quartile 1, quartile 3) changes in intact parathyroid hormone and 1,25-dihydroxyvitamin D from baseline to week 4 were -13 (-31, 4) pg/ml (P<0.001; n=97) and -2 (-9, 3) pg/ml (P=0.05; n=96), respectively. There were no changes in fibroblast growth factor-23 or 25-hydroxyvitamin D. In patients (n=16) with baseline serum phosphate >4.8 mg/dL, the mean (SD) changes in serum and 24-hour creatinine-normalized urine phosphate from baseline to Week 4 were -0.6±0.8 mg/dl (n=13) and -149.1±162.6 mg/24hr (n=9), respectively.
Conclusions: Patiromer lowered urine phosphate in all patients, and lowered both serum and urine phosphate in a small subset of patients with hyperphosphatemia. Intact parathyroid hormone and 1,25-dihydroxyvitamin D decreased, with no change in serum calcium.
Keywords: 25-hydroxyvitamin D; Albumins; Calcifediol; Fibroblast Growth Factors; Hyperkalemia; Magnesium; Minerals; Phosphates; Polymers; Sodium; Vitamin D; creatinine; fibroblast growth factor 23; mineral metabolism; parathyroid hormone; patiromer; potassium.
Copyright © 2019 by the American Society of Nephrology.
Figures
References
-
- US Food and Drug Administration: Veltassa® (patiromer): Prescribing information, 2018. Available at: https://www.accessdata.fda.gov/drugsatfda_docs/label/2018/205739s016lbl.pdf. Accessed October 9, 2018
-
- European Medicines Agency: Veltassa® (patiromer), 2017. Available at: http://www.ema.europa.eu/ema/index.jsp?curl=pages/medicines/human/medici.... Accessed October 9, 2018
-
- Bakris GL, Pitt B, Weir MR, Freeman MW, Mayo MR, Garza D, Stasiv Y, Zawadzki R, Berman L, Bushinsky DA; AMETHYST-DN Investigators : Effect of patiromer on serum potassium level in patients with hyperkalemia and diabetic kidney disease: The AMETHYST-DN randomized clinical trial. JAMA 314: 151–161, 2015 - PubMed
-
- Pitt B, Bakris GL, Bushinsky DA, Garza D, Mayo MR, Stasiv Y, Christ-Schmidt H, Berman L, Weir MR: Effect of patiromer on reducing serum potassium and preventing recurrent hyperkalaemia in patients with heart failure and chronic kidney disease on RAAS inhibitors. Eur J Heart Fail 17: 1057–1065, 2015 - PMC - PubMed
-
- Weir MR, Bakris GL, Bushinsky DA, Mayo MR, Garza D, Stasiv Y, Wittes J, Christ-Schmidt H, Berman L, Pitt B; OPAL-HK Investigators : Patiromer in patients with kidney disease and hyperkalemia receiving RAAS inhibitors. N Engl J Med 372: 211–221, 2015 - PubMed
Publication types
MeSH terms
Substances
LinkOut - more resources
Full Text Sources
Other Literature Sources
Medical
Research Materials
Miscellaneous
