. 2018 Oct 31;9(11):1108.
doi: 10.1038/s41419-018-1142-4.

YAP1 enhances NF-κB-dependent and independent effects on clock-mediated unfolded protein responses and autophagy in sarcoma

Affiliations

YAP1 enhances NF-κB-dependent and independent effects on clock-mediated unfolded protein responses and autophagy in sarcoma

Adrian Rivera-Reyes et al. Cell Death Dis. .

Abstract

Terminal differentiation opposes proliferation in the vast majority of tissue types. As a result, loss of lineage differentiation is a hallmark of aggressive cancers, including soft tissue sarcomas (STS). Consistent with these observations, undifferentiated pleomorphic sarcoma (UPS), an STS subtype devoid of lineage markers, is among the most lethal sarcomas in adults. Though tissue-specific features are lost in these mesenchymal tumors they are most commonly diagnosed in skeletal muscle, and are thought to develop from transformed muscle progenitor cells. We have found that a combination of HDAC (Vorinostat) and BET bromodomain (JQ1) inhibition partially restores differentiation to skeletal muscle UPS cells and tissues, enforcing a myoblast-like identity. Importantly, differentiation is partially contingent upon downregulation of the Hippo pathway transcriptional effector Yes-associated protein 1 (YAP1) and nuclear factor (NF)-κB. Previously, we observed that Vorinostat/JQ1 inactivates YAP1 and restores oscillation of NF-κB in differentiating myoblasts. These effects correlate with reduced tumorigenesis, and enhanced differentiation. However, the mechanisms by which the Hippo/NF-κB axis impact differentiation remained unknown. Here, we report that YAP1 and NF-κB activity suppress circadian clock function, inhibiting differentiation and promoting proliferation. In most tissues, clock activation is antagonized by the unfolded protein response (UPR). However, skeletal muscle differentiation requires both Clock and UPR activity, suggesting the molecular link between them is unique in muscle. In skeletal muscle-derived UPS, we observed that YAP1 suppresses PERK and ATF6-mediated UPR target expression as well as clock genes. These pathways govern metabolic processes, including autophagy, and their disruption shifts metabolism toward cancer cell-associated glycolysis and hyper-proliferation. Treatment with Vorinostat/JQ1 inhibited glycolysis/MTOR signaling, activated the clock, and upregulated the UPR and autophagy via inhibition of YAP1/NF-κB. These findings support the use of epigenetic modulators to treat human UPS. In addition, we identify specific autophagy, UPR, and muscle differentiation-associated genes as potential biomarkers of treatment efficacy and differentiation.


Conflict of interest statement

The authors declare that they have no conflict of interest.

Figures
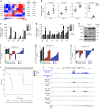
Fig. 1
Fig. 1. YAP1-dependent inhibition of circadian clock genes in UPS and proliferating myoblasts
a Gene expression analysis of microarray performed on KP vs. KPY mouse tumors. b qRT-PCR validation of circadian clock gene expression in KP and KPY mouse tumors. c qRT-PCR of muscle differentiation genes and d Hippo/NF-κB/Circadian clock genes in proliferating (Day 0, D0) and differentiating (D1–D6) C2C12 myoblasts. e Western blot of Per1 and Per2 in C2C12 cells treated as in d. f Oncomine gene expression analysis of PER1, g PER2, and h CRY2 in human tissues. i Kaplan–Meier survival curve of MFS patients in the TCGA sarcoma data set based on CRY2 expression. j Gene tracks of H3K27ac ChIP-seq signal (rpm/bp) for H3K27ac at the CRY2 locus in human skeletal muscle and human three independent human UPS samples. Error bars represent SD
Fig. 2
Fig. 2. YAP1 enhances proliferation by suppressing the clock
a Gene expression analysis of microarray performed on KP cells treated with 2 μm SAHA/0.5 μm JQ1 for 48 h. b qRT-PCR validation of clock genes in KP cells treated as in a. c Western blot of KP cells treated as in a. d qRT-PCR of human UPS cells (STS-109) treated as in a. e Western blot of STS-109 cells treated as in a. f (left) Bmal luciferase reporter assay in KP cells expressing Yap1 siRNA (20 nM) and treated with 2 μm SAHA/0.5 μm JQ1 for 12 h to activate signaling. (right) Western blot of YAP1 levels in siRNA treated cells. g Bmal luciferase reporter assay in KP cells treated with 2 μm SAHA/0.5 μm JQ1. h (left) Cell counting rescue proliferation assay in Yap1#1 and Arntl shRNA expressing KP cells. (right) qRT-PCR of Yap1 and Arntl expression in KP cells treated as in h. i Western blot of KP cells expressing multiple  Yap1 shRNAs and treated with 1 μm Staurosporin (12 h) as positive control. Error bars represent SD
Fig. 3
Fig. 3. Inhibition of NF-κB, downstream of Yap1, restores clock gene expression
a Rela deletion in the KP autochthonous model of UPS (n = 18 mice per group. Log-Rank Chi-sq. b Genotyping of KP and KPR mice. Kras band indicates the presence of the KrasG12D mutant allele, p53 bands indicate wt and fl/fl alleles. RelA band indicates the presence of the fl/fl alleles. c IHC of KP and human xenograft UPS tumors. d qRT-PCR of KP cells treated with NF-κB inhibitor 1.5 μm BAY 11-7085 for 12, 48 h. e qRT-PCR of clock genes in KP cells expressing Rela shRNA. f (left) qRT-PCR and (right) western blot of USP31 expression in 2 μm SAHA/0.5 μm JQ1-treated STS-109. g qRT-PCR of KP and HT-1080 cells treated with DMSO or 2 μm SAHA/0.5 μm JQ1 for 0–120 h. h (left) Cell counting rescue proliferation assay in Rela and Arntl shRNA expressing KP cells. (right) qRT-PCR of Rela and Arntl expression in KP cells treated as in left. i Cell counting rescue proliferation assay in Arntl shRNA expressing KP cells treated with 1.0 μm BAY 11-7085 for 72 h. Data are expressed as mean fold change and SEM relative to the cell numbers in samples treated for with DMSO or BAY for 24 h. Error bars represent SD ah
Fig. 4
Fig. 4. Inhibition of YAP1 and NF-kB activates UPR target expression necessary for survival
a Gene expression analysis of microarray performed on KP cells treated with 2 μm SAHA/0.5 μm JQ1 for 48 h. b qRT-PCR validation of UPR genes in (left) KP cells treated as in a and (right) with multiple independent YAP1 shRNAs. c Oncomine gene expression analysis of TXNIP and d DDIT3 in human tissues. e Western blot of TXNIP in KP and f HT-1080 cells treated as in a. g Western blot of CHOP in HT-1080 cells treated as in a. h qRT-PCR of Txnip and Ddit3 in KP cells expressing two independent Yap1 shRNAs. i qRT-PCR for Txnip and Ddit3 genes in proliferating (Day 0, D0) and differentiating (D1–D6) C2C12 myoblasts. j qRT-PCR of KP cells treated with NF-κB inhibitor 1.5 μm BAY 11-7085 for 48 h. k qRT-PCR of Txnip and Ddit3 in KP cells expressing Rela shRNAs. l qRT-PCR rescue assay of KP cells expressing Per1 shRNA and treated with 2 μm SAHA/0.5 μm JQ1 for 48 h. m Cell counting rescue proliferation assay in cells expressing both Txnip and Ddit3 shRNAs and treated as in a. D/T shRNAs denotes Ddit3 and Txnip shRNAs were used for knockdown. n Cell counting proliferation assay of KP cells from m from 0 to 96 h. Error bars represent SD
Fig. 5
Fig. 5. SAHA/JQ1 treatment promotes UPR target oscillation
a qRT-PCR of KP cells treated with 2 μm SAHA and/or 0.5 μm JQ1 for 0–120 h. b Summary graphs of qRT-PCR for TXNIP and DDIT3 treated as in a, b with the addition of 0–24 h time points. Some of the data summarized here are found in supplementary figure 5. c ATF4-GFP reporter assay in KP cells treated as in a for 24 h. Scale bar = 50 μm. d ATF6-GFP reporter assay in KP cells treated as in a for 24 h. Scale bar = 50 μm. e Scale bar = μm f Representative images of IHC from murine tumor sections from allograft experiments (shSCR, shRelA) and GEMMs (KP, KPY, and KP tumors treated with SAHA/JQ1 once daily with 25mg/kg SAHA and twice daily with 25 mg/kg JQ1). Tumors harvested after 20 days of treatment. Scale bar = 20 μm. g Quantification of Gadd34 expression from f. n = 3 mice per group, 12 images per tumor sample. Error bars represent SD
Fig. 6
Fig. 6. YAP1 loss alters sarcoma cell metabolism and initiates differentiation
a Gene expression analysis of microarray performed on KP cells treated with 2 μm SAHA/0.5 μm JQ1 for 48 h. b Oncomine gene expression analysis of CPT1A, c CPT1B, and d FASN in human tissues. e qRT-PCR validation of Fasn and f Cpt1a in KP cells treated as in a. g Western blot of KP cells treated as in a. h Western blot of STS-109 cells treated as in a. i Western blot of proliferating (Day 0, D0) and differentiating (D1–D6) C2C12 myoblasts. j qRT-PCR of KP cells expressing (right) Yap1 shRNAs and (left) Rela shRNAs. k qRT-PCR rescue assay of KP cells expressing Per1 shRNA and treated with 2 μm SAHA/0.5 μm JQ1 for 48 h. l GSEA analysis of microarray from KP cells treated with 2 μm SAHA/0.5 μm JQ1 for 48 h using the Broad Institute “hallmark” gene sets for “MTORC1 signaling”, “Glycolysis”, and “Lipid catabolic process”. Error bars represent SD
Fig. 7
Fig. 7. YAP1 suppresses autophagy in sarcoma cells independent of NF-kB
a GC/MS of KP cells treated with 2 μM SAHA/0.5 μM JQ1 for 48 h. b Gene expression analysis of microarray described in a. c (top) Western blot of KP cells treated as in A with the addition of BAF during the last 6 h of treatment. (bottom) Western blot of YAP1 shRNA expressing cells treated with BAF as in the top panel. d qRT-PCR of Atg13 and Atg14 in KP cells expressing Yap1 shRNA. eqRT-PCR of KP and KPY tumors. f Representative images of IHC from murine tumor sections from KP, KPY, and KP tumors treated with SAHA/JQ1 once daily with 25mg/kg SAHA and twice daily with 25mg/kg JQ1. Tumors harvested after 20 days of treatment. Scale bar = 20 μm. g Quantification of p62 expression from f. n = 3 mice per group, 12 images per tumor sample. h Quantification of LC3B expression from f n = 3 mice per group, 12 images per tumor sample. i Western blot of KP cells expressing Scr or Rela shRNAs treated as in a with the addition of BAF during the last 6 h of treatment. j qRT-PCR rescue assay of KP cells expressing Per1 shRNA and treated with 2 μM SAHA/0.5 μM JQ1 for 48 h. Error bars represent SD
Fig. 8
Fig. 8. Model of YAP1/NF-κB-mediated clock control
Model of YAP1/NF-κB-mediated clock control of UPR and NF-κB-independent control of autophagy

Similar articles

Cited by

References

    1. Pappo AS, et al. A phase 2 trial of R1507, a monoclonal antibody to the insulin-like growth factor-1 receptor (IGF-1R), in patients with recurrent or refractory rhabdomyosarcoma, osteosarcoma, synovial sarcoma, and other soft tissue sarcomas: results of a Sarcoma Alliance for Research Through Collaboration study. Cancer. 2014;120:2448–2456. doi: 10.1002/cncr.28728. - DOI - PMC - PubMed
    1. Wagner LM, et al. Phase II study of cixutumumab in combination with temsirolimus in pediatric patients and young adults with recurrent or refractory sarcoma: a report from the Children's Oncology Group. Pediatr. Blood. Cancer. 2015;62:440–444. doi: 10.1002/pbc.25334. - DOI - PMC - PubMed
    1. Taylor BS, et al. Advances in sarcoma genomics and new therapeutic targets. Nat. Rev. Cancer. 2011;11:541–557. doi: 10.1038/nrc3087. - DOI - PMC - PubMed
    1. Ballinger ML, et al. Monogenic and polygenic determinants of sarcoma risk: an international genetic study. Lancet Oncol. 2016;17:1261–1271. doi: 10.1016/S1470-2045(16)30147-4. - DOI - PubMed
    1. Eisinger-Mathason TS, et al. Deregulation of the Hippo pathway in soft-tissue sarcoma promotes FOXM1 expression and tumorigenesis. Proc. Natl. Acad. Sci. USA. 2015;112:E3402–3411. doi: 10.1073/pnas.1420005112. - DOI - PMC - PubMed

Publication types

MeSH terms