. 2018 Oct 31;9(1):4551.
doi: 10.1038/s41467-018-06730-z.

Establishing the effects of mesoporous silica nanoparticle properties on in vivo disposition using imaging-based pharmacokinetics

Affiliations

Establishing the effects of mesoporous silica nanoparticle properties on in vivo disposition using imaging-based pharmacokinetics

Prashant Dogra et al. Nat Commun. .

Abstract

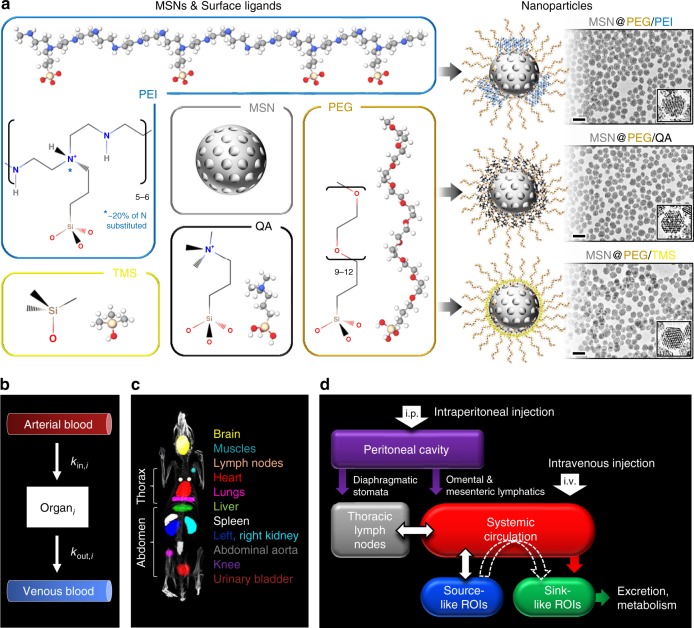
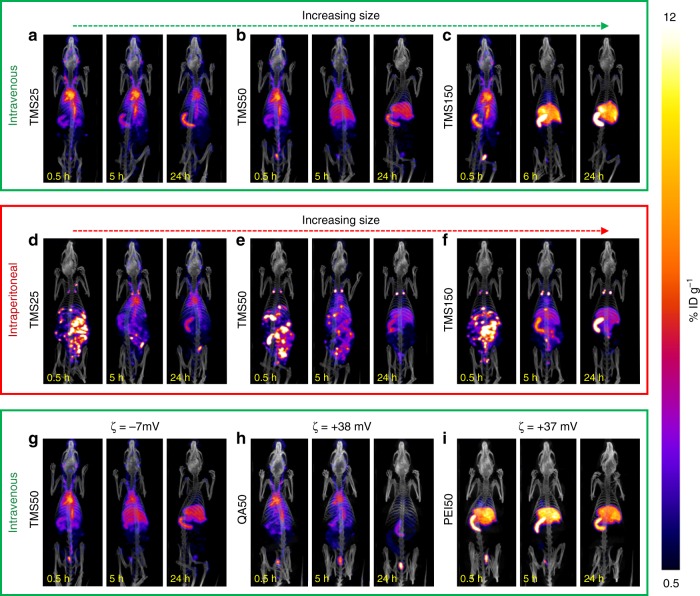
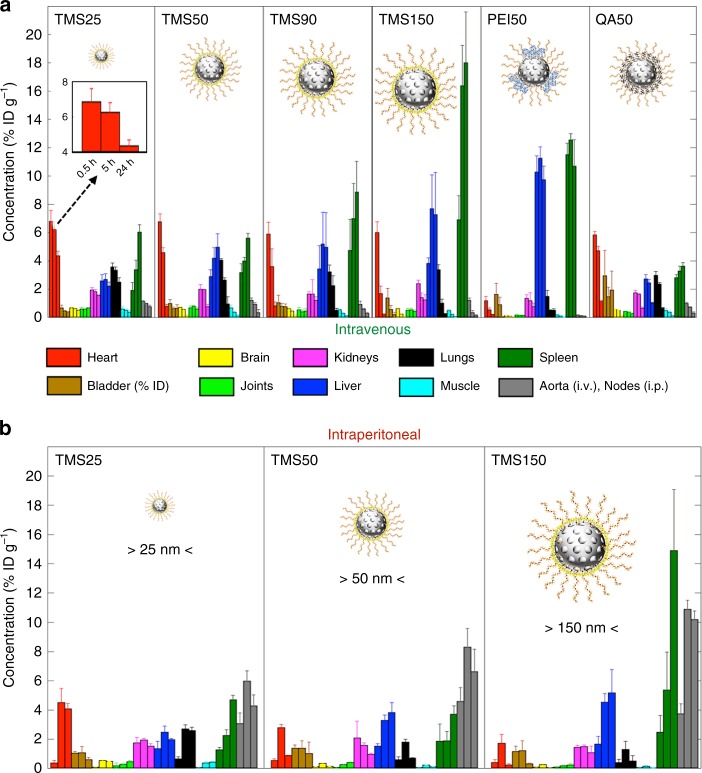
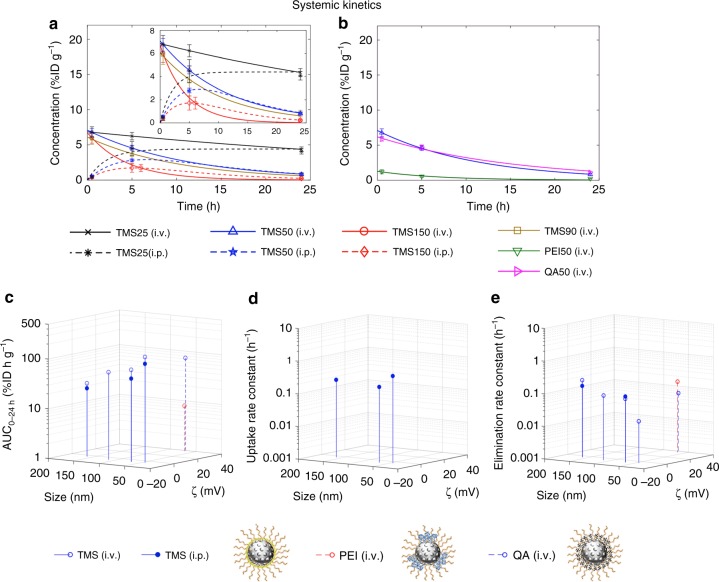
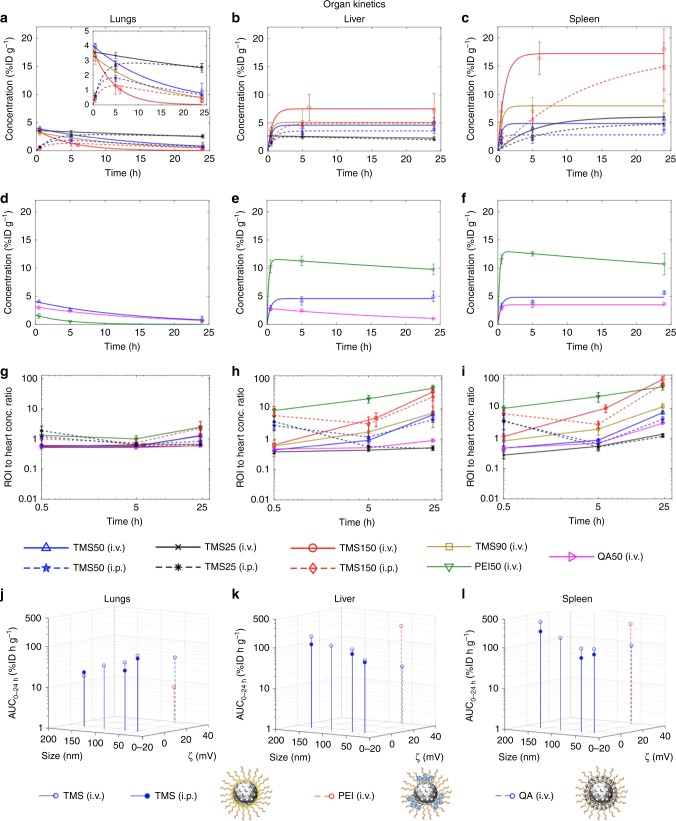
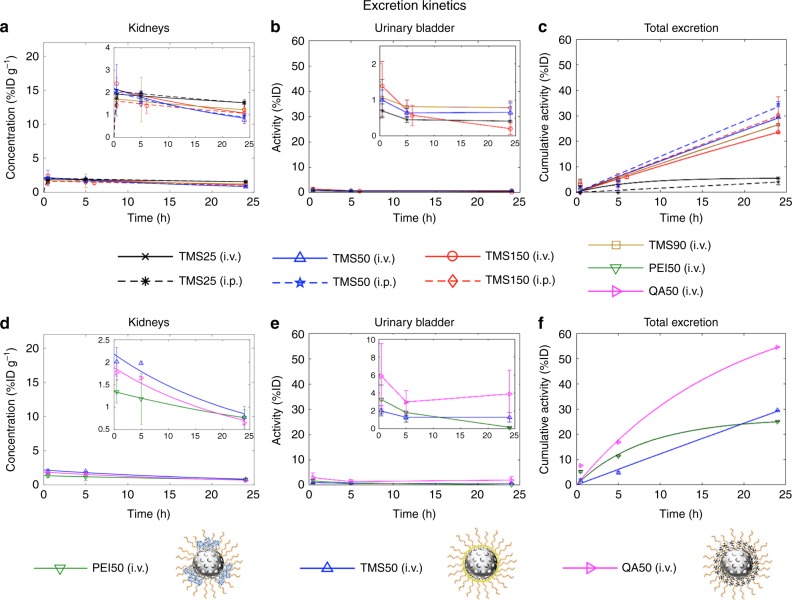
The progress of nanoparticle (NP)-based drug delivery has been hindered by an inability to establish structure-activity relationships in vivo. Here, using stable, monosized, radiolabeled, mesoporous silica nanoparticles (MSNs), we apply an integrated SPECT/CT imaging and mathematical modeling approach to understand the combined effects of MSN size, surface chemistry and routes of administration on biodistribution and clearance kinetics in healthy rats. We show that increased particle size from ~32- to ~142-nm results in a monotonic decrease in systemic bioavailability, irrespective of route of administration, with corresponding accumulation in liver and spleen. Cationic MSNs with surface exposed amines (PEI) have reduced circulation, compared to MSNs of identical size and charge but with shielded amines (QA), due to rapid sequestration into liver and spleen. However, QA show greater total excretion than PEI and their size-matched neutral counterparts (TMS). Overall, we provide important predictive functional correlations to support the rational design of nanomedicines.


Conflict of interest statement

The authors declare no competing interests.

Figures

Fig. 1
Fig. 1
Design of MSNs, SPECT/CT imaging, and mathematical modeling. a Molecular models of surface ligands and the resulting MSNs used in the study, characterized by TEM. Polyethylenimine (PEI) is “patchy” and may extend beyond the polyethylene glycol (PEG) layer and cover the MSN surface intermittently, unlike the smaller quaternary amine (QA) and trimethylsilane (TMS) groups that remain shielded within the PEG layer and cover the MSN surface uniformly. PEI and QA groups provide a strongly positive zeta potential (ζ) to MSNs, while TMS makes them neutral. Scale bars: 100 nm. b A schematic of the underlying modeling hypothesis depicts an organ i that receives influx of NPs from its major feeding artery, which after crossing the vasculature of organ i exit into venous blood. Assuming the influx and efflux processes to both follow first-order kinetics with rate constants kin,i and kout,i, respectively, we obtain a double-exponential function (Eq. (4)) to describe the concentration–time course of NPs in individual ROIs. c Regions of interest (ROIs) generated using inviCRO’s Multi Atlas Segmentation Tool to perform quantification of whole-body radioactivity concentration. d Representation of the whole-body framework to understand the disposition of NPs. I.p. administration, unlike i.v. injection, is associated with absorption of NPs from the peritoneal cavity into systemic circulation through bowel lymphatics, causing accumulation of NPs in thoracic lymph nodes. Once in the systemic circulation through either route of injection, NPs are distributed across all organs in the body in proportion to organ blood flow rates. Once inside the organ microvasculature, NPs encounter traps that sequester NPs from circulation into the interstitial space. Based on the low or high density of traps, we can classify the organs into “source-like” and “sink-like,” respectively. The former do not sequester NPs due to lack or low density of traps, unlike the latter, which generally trap NPs unless the physicochemical properties of NPs are unfavorable for entrapment. By allowing NPs to pass through their vasculature without sequestration, source-like organs thus become a secondary source of NPs for the sink-like organs (as depicted through the dotted white arrow), which eventually dispose of the NPs through metabolic and excretory pathways
Fig. 2
Fig. 2
SPECT/CT images showing the whole-body spatio-temporal evolution of MSNs. PEG-TMS-coated MSNs of nominal sizes 25 nm (a, d), 50 nm (b, e), 90 nm (Supplementary Fig. 6), and 150 nm (c, f) were injected via. i.v. (ac, Supplementary Fig. 6) or i.p. (df) route to understand the effect of MSN size and route of administration. PEG-PEI-coated and PEG-QA-coated MSNs, namely, QA50 (h) and PEI50 (i), were administered i.v. to explore the effect of surface chemistry. Note that (b) and (g) are identical images (shown twice for ease of comparison). Also, TMS50 (b) and QA50 (h) were compared to understand the effect of zeta potential on disposition of MSNs. Injections were followed by SPECT/CT imaging at 30 min, 5 h (6 h in case of TMS150 (i.v.)), and 24 h. All SPECT images were scaled from 0.5 to 12%ID g−1. Note: TMS90 MSN was not injected i.p.; lymph nodes and abdominal aorta were not analyzed as ROIs in the i.v. and i.p. cases, respectively
Fig. 3
Fig. 3
Whole-body quantitative biodistribution of MSNs. Bar plots of mean concentration–time data for various ROIs following a, i.v. and b, i.p. injection of MSNs are shown. For each MSN-type, concentration (%ID g−1) of MSNs in ten ROIs is shown at 30 min, 5 h (6 h for TMS150 (i.v.)), and 24 h, represented by three adjacent bars of same color (see inset in a). Data represents mean ± s.d., n = 4 (except TMS50 (i.p.) and TMS25 (i.p.), where n = 3). Note: Data for urinary bladder ROI is presented as activity (%ID) and not as concentration
Fig. 4
Fig. 4
Systemic kinetics. a, b One-compartment PK model (Eq. (6) for i.v. and Eq. (4) for i.p.) was fit to the concentration–time data for different MSNs in the heart ROI (Supplementary Tables 4 and 5). Fitted concentration–time curves demonstrate the effect of MSN size and route of administration for TMS-modified MSNs (a) and surface chemistry and zeta potential for 50 nm diameter MSNs modified with TMS, QA, or PEI (b). The inset in a is a rescaled version of the figure for a clearer view. Solid lines, i.v. cases; dotted lines, i.p. cases. ce 3-D stem plots show area under the concentration–time curves (AUC0–24 h) (c) and model parameter estimates ((d) uptake rate constant, kin, and (e) elimination rate constant, kout), obtained for different MSNs from a, b, in multiparameter space. Data represent mean ± s.d., n = 4 (except TMS50 (i.p.) and TMS25 (i.p.), where n = 3)
Fig. 5
Fig. 5
Organ kinetics. Panel shows kinetic analysis for lungs, liver, and spleen. For analysis of the remaining ROIs refer to Supplementary Figs. 11–15. af For each ROI, non-linear regression of Eq. (4) or its adaptation was performed to the concentration–time data (Supplementary Tables 4 and 5). Fitted concentration–time curves demonstrate the effect of MSN size and route of administration for TMS-modified MSNs (ac) and surface chemistry and zeta potential for 50 nm diameter MSNs modified with TMS, QA, or PEI (df). The inset in a is a rescaled version of the figure for a clearer view. Solid lines, i.v. cases; dotted lines, i.p. cases. gi Observed concentration of ROIs normalized to concentration of heart (substitute for plasma) is shown over time on a log–log plot. jl 3-D stem plots show area under the concentration–time curves (AUC0–24 h), obtained for different MSNs from af, in multiparameter space. Data represent mean ± s.d., n = 4 (except TMS50 (i.p.) and TMS25 (i.p.), where n = 3)
Fig. 6
Fig. 6
Excretion kinetics. Urine and feces were not collected during the in vivo study, we thus examine the kidneys, urinary bladder, and total excreted activity to infer excretion kinetics of MSNs. a, d Concentration–time data of kidneys was fit to Eq. (6) for i.v. cases and Eq. (4) for i.p. cases. b, e No model was fit to the urinary bladder activity data due to the lack of urine collection. Data are presented as activity in the bladder as a percentage of the injected dose (%ID) over time. c, f To the total excreted activity (100%ID—whole-body activity) data, Eq. (7) was fit to all cases (Supplementary Tables 4 and 5). The insets in a, b, d, and e are rescaled versions of their corresponding figures for a clearer view. Solid lines, i.v. cases; dotted lines, i.p. cases. Data represent mean ± s.d., n = 4 (except TMS50 (i.p.) and TMS25 (i.p.), where n = 3)

References

    1. Bertrand N, Wu J, Xu X, Kamaly N, Farokhzad OC. Cancer nanotechnology: the impact of passive and active targeting in the era of modern cancer biology. Adv. Drug Deliv. Rev. 2014;66:2–25. doi: 10.1016/j.addr.2013.11.009. - DOI - PMC - PubMed
    1. Brocato Terisse, Dogra Prashant, Koay Eugene J., Day Armin, Chuang Yao-Li, Wang Zhihui, Cristini Vittorio. Understanding Drug Resistance in Breast Cancer with Mathematical Oncology. Current Breast Cancer Reports. 2014;6(2):110–120. doi: 10.1007/s12609-014-0143-2. - DOI - PMC - PubMed
    1. Wilhelm S, et al. Analysis of nanoparticle delivery to tumours. Nat. Rev. Mater. 2016;1:16014. doi: 10.1038/natrevmats.2016.14. - DOI
    1. Blanco E, Shen H, Ferrari M. Principles of nanoparticle design for overcoming biological barriers to drug delivery. Nat. Biotechnol. 2015;33:941–951. doi: 10.1038/nbt.3330. - DOI - PMC - PubMed
    1. Choi HS, et al. Renal clearance of nanoparticles. Nat. Biotechnol. 2007;25:1165. doi: 10.1038/nbt1340. - DOI - PMC - PubMed

Publication types

Substances