. 2018 Oct 31;9(1):4539.
doi: 10.1038/s41467-018-06563-w.

Lévy-like movement patterns of metastatic cancer cells revealed in microfabricated systems and implicated in vivo

Affiliations

Lévy-like movement patterns of metastatic cancer cells revealed in microfabricated systems and implicated in vivo

Sabil Huda et al. Nat Commun. .

Abstract

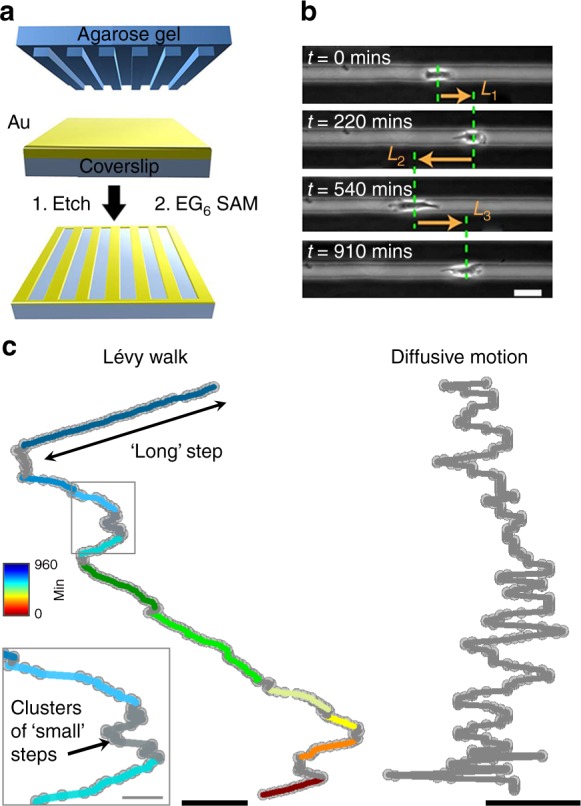
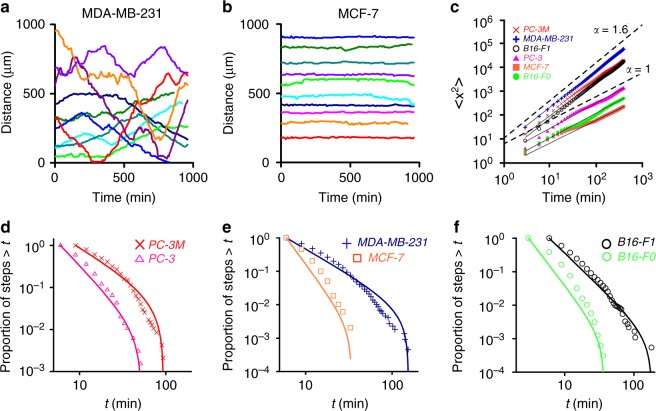
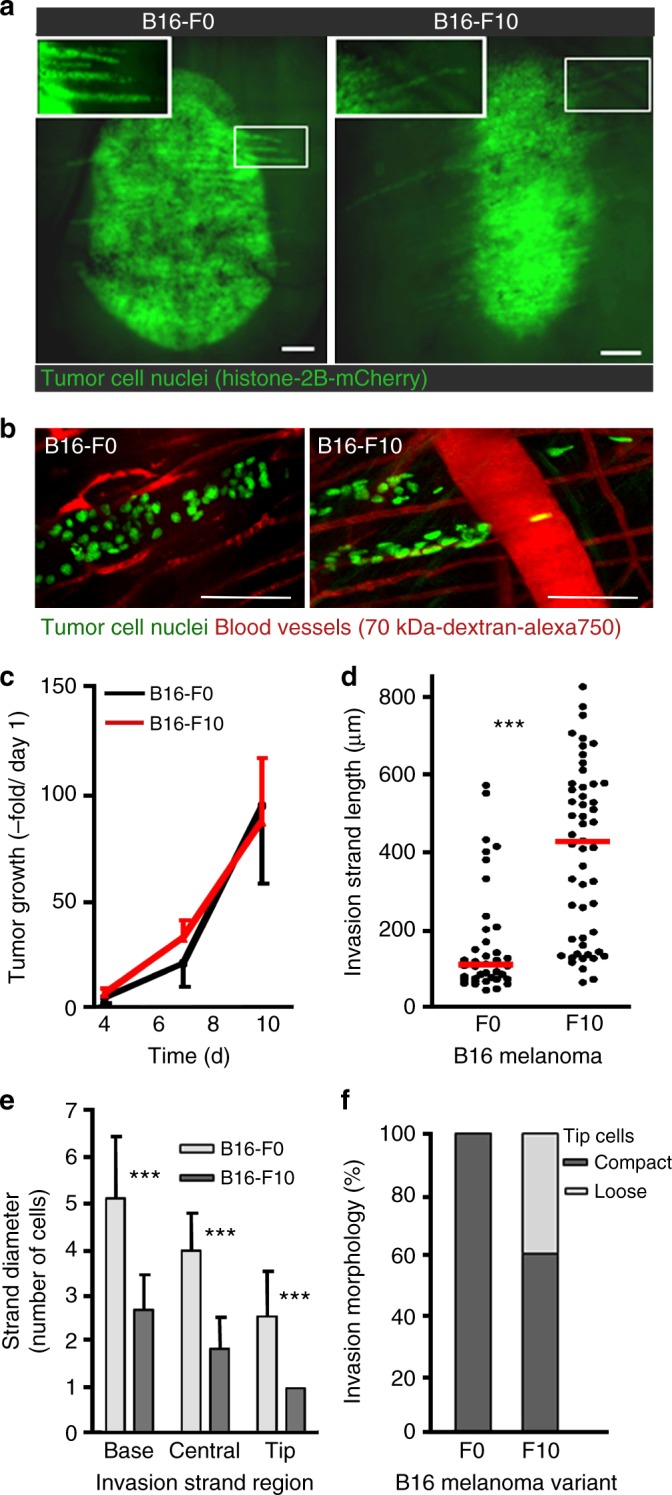
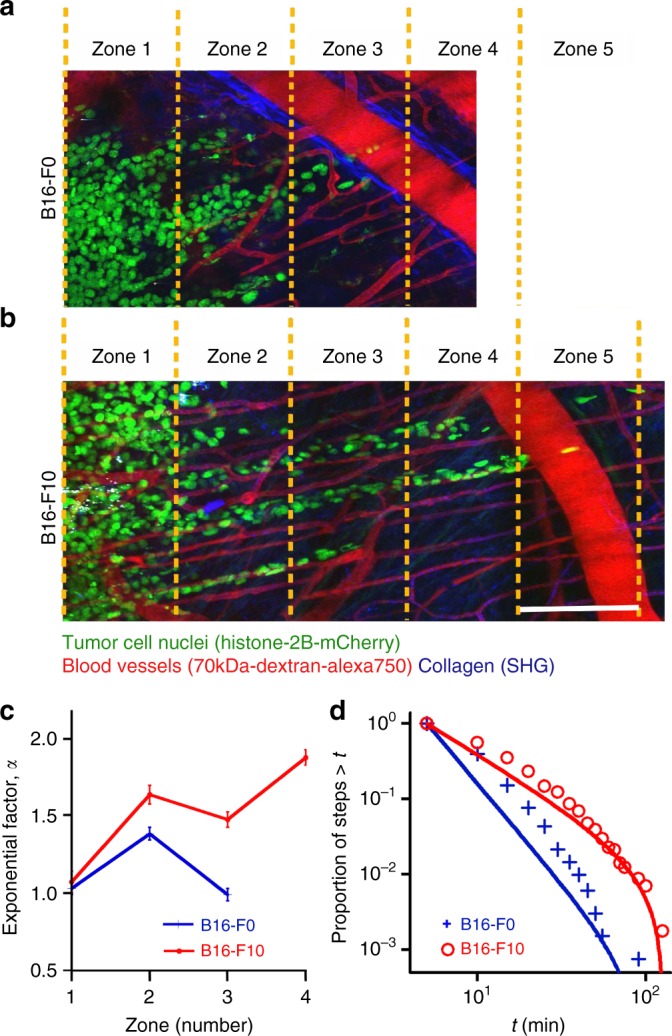
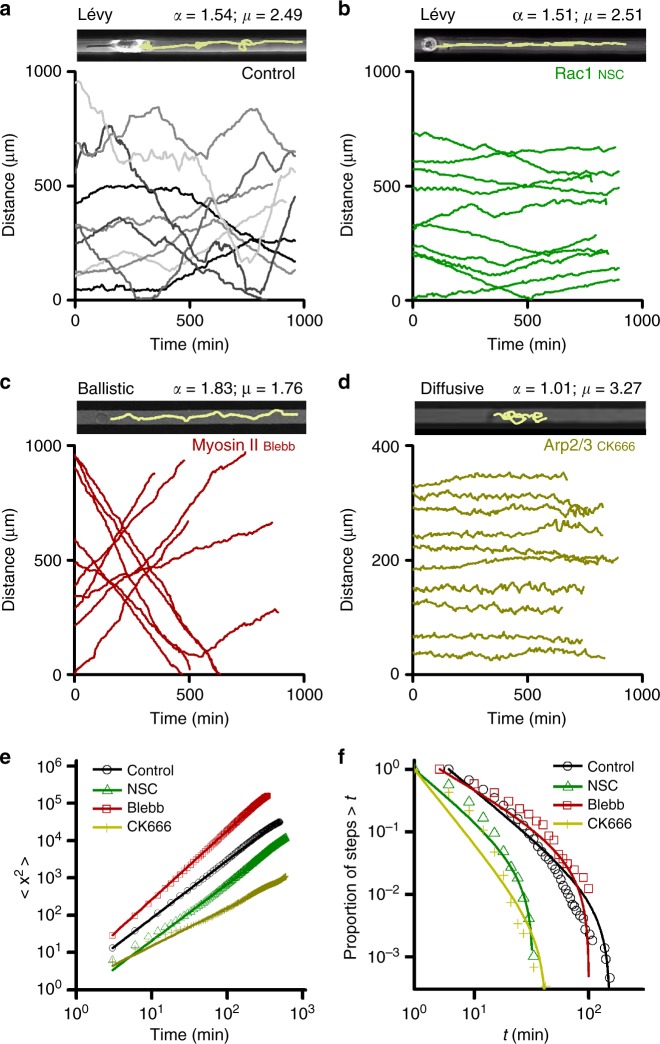
Metastatic cancer cells differ from their non-metastatic counterparts not only in terms of molecular composition and genetics, but also by the very strategy they employ for locomotion. Here, we analyzed large-scale statistics for cells migrating on linear microtracks to show that metastatic cancer cells follow a qualitatively different movement strategy than their non-invasive counterparts. The trajectories of metastatic cells display clusters of small steps that are interspersed with long "flights". Such movements are characterized by heavy-tailed, truncated power law distributions of persistence times and are consistent with the Lévy walks that are also often employed by animal predators searching for scarce prey or food sources. In contrast, non-metastatic cancerous cells perform simple diffusive movements. These findings are supported by preliminary experiments with cancer cells migrating away from primary tumors in vivo. The use of chemical inhibitors targeting actin-binding proteins allows for "reprogramming" the Lévy walks into either diffusive or ballistic movements.


Conflict of interest statement

The authors declare no competing interests.

Figures

Fig. 1
Fig. 1
Trajectories of cancer cell motions on linear microtracks. a Scheme of substrate fabrication using the Wet Etching technique, , . b Optical micrographs showing a cell migrating on a microtrack (scale bar = 20 µm). The cell moves along the etched, optically transparent microtrack, and not across cell-adhesion-resistant dark regions. The definition of step persistence length/time is the distance/time the cell travels in one direction before it reverts the direction of motion. The arrows labeled L1, L2, and L3 indicate three consecutive “steps” of the cell (here, to the right, to the left, and to the right again). c A representative trajectory of a metastatic cell comprised of clusters of “small” steps (shown in gray) interspersed with “large” steps (color denotes elapsed time and each long step is in different color) is characteristic of a Lévy walk (see also Supplementary Figure 2 for long-term trajectories). Scale bar is 100 μm for Lévy trajectory and 20 μm for the inset. This can be contrasted with a trajectory of a non-metastatic cell exhibiting diffusive motion (all steps are small and shown in gray, scale bar is 20 μm). Note that while cell motions in experiments are in 1D (along microtracks), the vertical axis in the trajectories shown here corresponds to time (from top to bottom). Total length of each trajectory is 960 min with each point 3 min apart. See also Supplementary Movies 1–6. The distinction between “small” and “large” steps is best appreciated by viewing long-term Supplementary Movies 13–15
Fig. 2
Fig. 2
Superdiffusive and Lévy walks of metastatic cancer cells on linear microtracks. a Typical trajectories/displacement versus time of highly metastatic cells (here for MDA-MB-231) feature characteristic small steps interspersed with unidirectional, long excursions. b In contrast, trajectories of non-metastatic cells (here for MCF-7) are more random/”jiggly”. Ten representative trajectories per cell type are shown. The starting points for trajectories are randomly positioned along the y axis (“Distance”) for clarity. See also Supplementary Movies 1–6 and 13–15 and Supplementary Figure 1 for trajectories for PC-3, PC-3M, B16-F0, and B16-F1 cells and Supplementary Figure 2 for long-term trajectories. c Differences in the two modes of motility are quantified in the log–log plots of the cells’ mean square displacement (in μm2) versus time, x2tα. The values of α close to unity (PC-3: α= 1.04, 95% confidence interval ± 0.03; MCF-7: α = 0.96 ± 0.04; B16F0: α = 1.05 ± 0.02) indicate diffusive walks of non-metastatic cells. Metastatic cells are superdiffusive (PC-3M: α = 1.58 ± 0.02; MD-MB-231: α = 1.54 ± 0.01; B16F1: α = 1.52 ± 0.02). df The cumulative frequency distributions, CFDs, of persistence times (t) for all types of cells studied on microtracks. Markers are experimental statistics: magneta triangles for PC-3, red crosses for PC-3M, blue crosses for MDA-MB-231, orange rectangles for MCF-7, green circles for B16-F0, and black circles for B16-F1. Solid lines are theoretical truncated power law fits. Statistical analysis of cancer cell movements on 1D microtracks is shown in Table 1
Fig. 3
Fig. 3
Structure of the linear invasion strands in vivo. a Live B16-F0 (non-metastatic) and B16-F10 (metastatic) tumors in mouse skin imaged with epifluorescence microscopy (cell nuclei marked with Histone-2B/mCherry, green). Images are representative of least six tumors from at least three independent mice per group. Insets show finger-like invasion strands moving away from the main tumor mass. Scale bar is 100 μm. b Enlarged images corresponding to the tips of the invasion strands. Few (~2–4) B16-F10 cells, so-called tip cells, detached from the invasion strands and exhibited trajectories that over limited observation time appeared ballistic (see also Fig. 4b, Zone 5). These tip cells were observed only in the very outer zone 5 which was not included in Lévy walk analysis because of small number of cells in this zone. Scale bar is 100 μm. Quantification of (c) tumor growth (quantification based on tumor volume and expressed as an increase over volume measured on day 1; time, days) and (d) invasion strand length on day 6. Invasion strands were statistically longer in metastatic tumors (average ~400 μm in B16-F10 vs. ~100 μm in B16-F0, red horizontal lines). Error bars in c are standard deviations based on ≥ 30 invasion strands from at least six tumors of three individual mice. e The widths of invasion strands near the base (i.e., beginning of strand at tumor’s edge), center between base and tip, and the tip region (recorded on day 6; error bars give standard deviations of ≥7 invasion strands from at least four tumors of three individual mice). f Individualized (with separation above two nuclear diameters) versus compact cell positioning in leading tips of invasion strands
Fig. 4
Fig. 4
Migration of non-metastatic and metastatic cells from live tumors in mouse skin. a, b Cell movements within invasion strands formed by up to 100 tumor cells and relation to the guidance structures of the tumor microenvironment, observed by using high-resolution multiphoton microscopy (see Supplementary Movies 7 and 8 for trajectories). The snapshots from these movies are shown for (a) B16-F0 and (b) B16-F10 tumors. AlexaFluor 750-labeled dextran was used to visualize blood vessels (red), Histone-2B/mCherry marks the nuclei of cells (green), and fibrillar collagen was revealed by SHG (second-harmonic generation; blue). Dashed yellow lines divide the invasion strands into five zones, each 150-μm wide. Scale bar is 150 μm. c The values of the “diffusion exponents” α indicate that both B16-F0 and B16-F10 cells are diffusive at the tumor margin (zone 1, α~1) and superdiffusive (zone 2, α~1.4–1.6) with entering the invasion zone. Away from the tumor (zones 3–4), however, the metastatic cells remain superdiffusive while the non-metastatic ones show diffusive behavior. Error bars correspond to 95% confidence intervals. d The cumulative frequency distributions, CFDs, of persistence times are truncated power law with μ>3 for diffusive B16-F0 (blue crosses, Zones 1–3) and truncated power law with μ~2.36 for B16-F10 (red circles, Zones 2–4) performing Lévy walks. Markers are experimental statistics for persistence times. Solid lines are truncated power law fits. Statistical analysis of cancer cell movements in vivo is shown in Table 2
Fig. 5
Fig. 5
Altering the motility strategy of metastatic cancer cells. Examples of typical cell trajectories: Lévy walking (control MDA-MB-231 cells, a or with Rac1 inhibited, b), ballistic (Myosin II inhibited, c) diffusive (Arp2/3 inhibited, d). Line width = 20 μm, same for all three images. In displacement plots, ten representative trajectories for each treatment are shown. Quantification of motility characteristics (exponents μ, α along with the ± 95% confidence intervals) for MDA-MD-231 cells moving on microtracks and having individual actin-binding proteins inhibited is summarized in Table 3. e Log–log plots of the cells’ mean square displacement versus time, x2=tα. The slopes correspond to exponents α; note that inhibition of Arp2/3 with CK666 results in diffusive motion, α ~ 1, while inhibition of Myosin II results in ballistic motion, α~2. f The corresponding cumulative frequency distributions, CFDs, of persistence times. Markers are experimental statistics for persistence times. Solid lines are truncated power law fits with respective μ values shown in Table 3. For the chemical inhibitors data shown corresponds to: 40 μM CK666 (for Arp2/3, yellow crosses), 100 μM NSC23755 (Rac1, green triangles), 10 μM Blebbistatin (Myosin II, red rectangles), and control (black circles). The additional results for all drug and siRNA concentrations tested are shown in Supplementary Figures 10–13. See Supplementary Movies 9–12 and 16–18

References

    1. Codling EA, Plank MJ, Benhamou S. Random walk models in biology. J. R. Soc. Interface. 2008;5:813–834. doi: 10.1098/rsif.2008.0014. - DOI - PMC - PubMed
    1. Lauffenburger DA, Horwitz AF. Cell migration: a physically integrated molecular process. Cell. 1996;84:359–369. doi: 10.1016/S0092-8674(00)81280-5. - DOI - PubMed
    1. Dunn GA, Brown AF. A unified approach to analysing cell motility. J. Cell. Sci. Suppl. 1987;8:81–102. doi: 10.1242/jcs.1987.Supplement_8.5. - DOI - PubMed
    1. Gail MH, Boone CW. The locomotion of mouse fibroblasts in tissue culture. Biophys. J. 1970;10:980–993. doi: 10.1016/S0006-3495(70)86347-0. - DOI - PMC - PubMed
    1. Stokes CL, Lauffenburger DA, Williams SK. Migration of individual microvessel endothelial cells: stochastic model and parameter measurement. J. Cell. Sci. 1991;99:419–430. - PubMed

Publication types