. 2018 Oct 31;9(1):4533.
doi: 10.1038/s41467-018-07004-4.

Fluidity onset in graphene

Affiliations

Fluidity onset in graphene

Denis A Bandurin et al. Nat Commun. .

Abstract

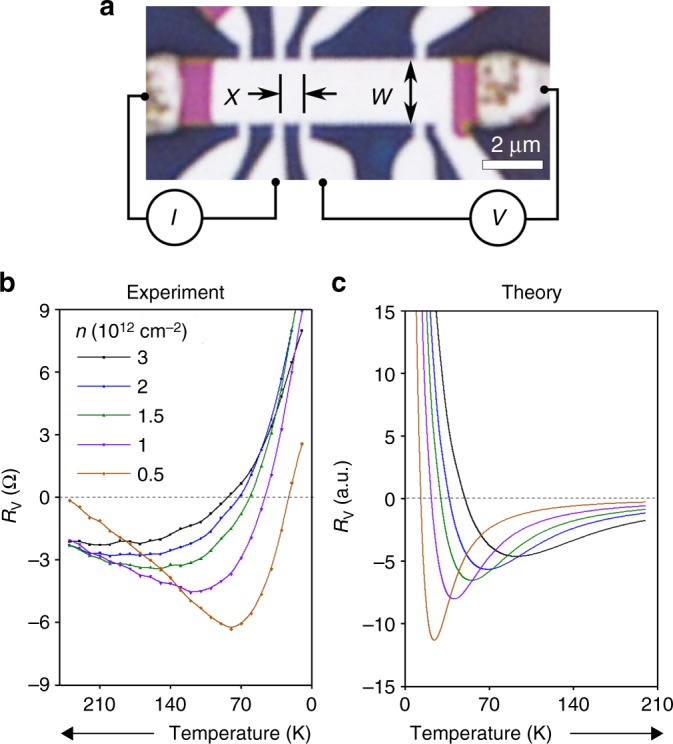
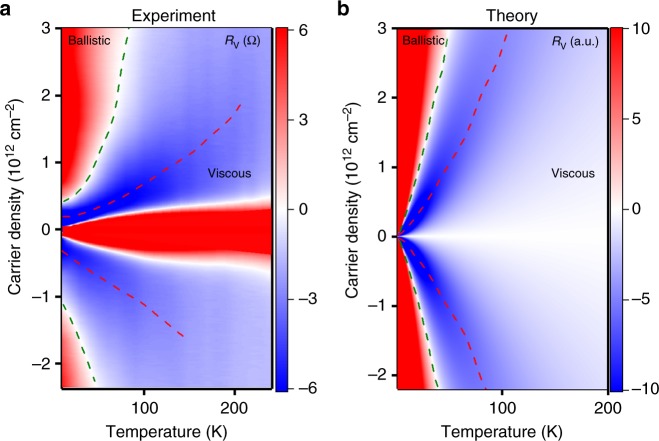
Viscous electron fluids have emerged recently as a new paradigm of strongly-correlated electron transport in solids. Here we report on a direct observation of the transition to this long-sought-for state of matter in a high-mobility electron system in graphene. Unexpectedly, the electron flow is found to be interaction-dominated but non-hydrodynamic (quasiballistic) in a wide temperature range, showing signatures of viscous flows only at relatively high temperatures. The transition between the two regimes is characterized by a sharp maximum of negative resistance, probed in proximity to the current injector. The resistance decreases as the system goes deeper into the hydrodynamic regime. In a perfect darkness-before-daybreak manner, the interaction-dominated negative response is strongest at the transition to the quasiballistic regime. Our work provides the first demonstration of how the viscous fluid behavior emerges in an interacting electron system.


Conflict of interest statement

The authors declare no competing interests.

Figures

Fig. 1
Fig. 1
Vicinity resistance Rv. a Optical photograph of one of our devices on which the measurement geometry is indicated: current I is injected into the graphene channel through a 300 nm contact and the voltage drop is measured at a distance x from the injection point. Device width W is 2.3 μm. b, c Temperature dependence of the vicinity resistance measured experimentally and computed theoretically for different carrier densities n in bilayer graphene. The most negative value occurs at the fluidity onset, Kn~1, where Kn is the Knudsen number, (1)
Fig. 2
Fig. 2
Vicinity resistance Rv as a function of carrier density and temperature. The dashed green line indicates zero resistance. Dashed red lines: minima in the resistance. a Experiment: Rv(n,T) for bilayer graphene. The central red region indicates the density range around the CNP where our hydrodynamic analysis is inapplicable. b Theory: resistance obtained by solving the kinetic equation. The key features in both panels: sign reversal at quasiballistic-to-hydrodynamic transition, the maximal negative signal at the onset of the viscous regime, and a slow decay of the signal at higher temperatures
Fig. 3
Fig. 3
Vicinity resistance versus T for several positions x of the voltage probe. a Experimental Rv(T) for n = 1.5 × 1012 cm−2 and W = 2.3 μm. b Theoretical dependence Rv (T) predicted from the kinetic equation for the device in Fig. 1a. Temperature enters through the ee scattering rate γeeTe2εF. The top axis corresponds to the electron Knudsen number Kn = lee/x calculated for the blue curve. The purple rectangles and arrows mark, respectively, the sign change and minima in the Rv (T) dependences. Upper inset: Schematics of electron transport in the ballistic regime. The potential at the source is transported by carriers throughout the sample and into the probe. Lower inset: Schematics of the voltage sign change in the quasiballistic regime. Collisions between injected carriers (red arrows) and ambient thermal carriers (green arrows) diminish the number of thermal carriers reaching the probe. This reduces the potential, which reverses its sign and becomes negative. Arrows link the insets with the corresponding portions of the Rv (T) dependence
Fig. 4
Fig. 4
Potential at the edge of a halfplane as a function of the distance to the current injector, calculated for the no-slip boundary conditions. The exact result (green curve) can be approximated by a direct sum of the Ohmic and viscous contributions (dashed blue curve). The residual (dashed red curve) is the non-additive part, defined as the difference of the exact and approximate potentials. At x~ξ the residual constitutes no more than 10–15% of the net potential value, becoming much smaller at xξ and xξ
Fig. 5
Fig. 5
The vicinity geometry in a strip of width w. The red lines illustrate current injected through the source at x = 0 and drained far to the left, at x = −∞. Voltage probe, positioned at a distance x from the source, is used to measure potential Vp(x) relative to the ground far to the right, at x = + ∞. The source and drain contacts, as well as the probe, were positioned at the y = 0 boundary. The angle θ between the electron momentum p and the strip edge parameterizes states at the two-dimensional Fermi surface

References

    1. Damle K, Sachdev S. Nonzero-temperature transport near quantum critical points. Phys. Rev. B. 1997;56:8714–8733. doi: 10.1103/PhysRevB.56.8714. - DOI
    1. Müller M, Schmalian J, Fritz L. Graphene: a nearly perfect fluid. Phys. Rev. Lett. 2009;103:025301. doi: 10.1103/PhysRevLett.103.025301. - DOI - PubMed
    1. Andreev AV, Kivelson SA, Spivak B. Hydrodynamic description of transport in strongly correlated electron systems. Phys. Rev. Lett. 2011;106:256804. doi: 10.1103/PhysRevLett.106.256804. - DOI - PubMed
    1. Forcella D, Zaanen J, Valentinis D, van der Marel D. Electromagnetic properties of viscous charged fluids. Phys. Rev. B. 2014;90:035143. doi: 10.1103/PhysRevB.90.035143. - DOI
    1. Tomadin A, Vignale G, Polini M. Corbino disk viscometer for 2D quantum electron liquids. Phys. Rev. Lett. 2014;113:235901. doi: 10.1103/PhysRevLett.113.235901. - DOI - PubMed

Publication types