. 2018 Oct 31;9(1):4538.
doi: 10.1038/s41467-018-06820-y.

Interactions between callose and cellulose revealed through the analysis of biopolymer mixtures

Affiliations

Interactions between callose and cellulose revealed through the analysis of biopolymer mixtures

Radwa H Abou-Saleh et al. Nat Commun. .

Abstract

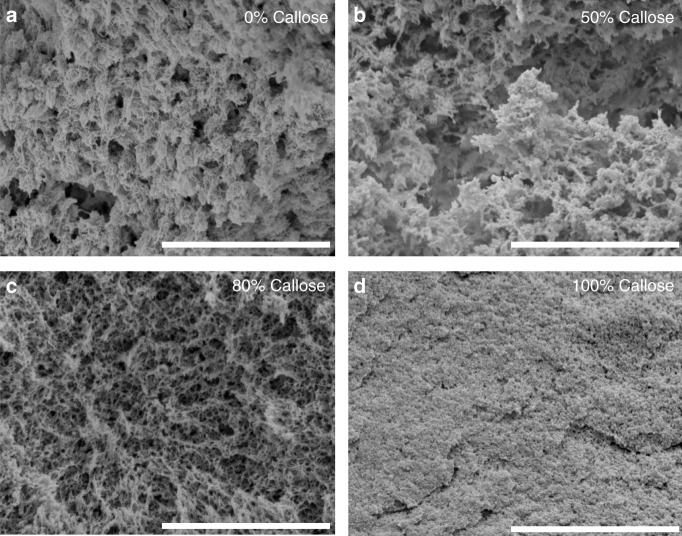
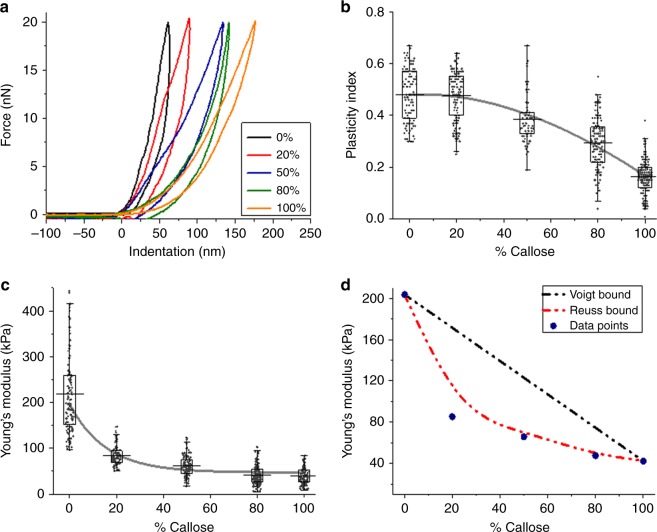
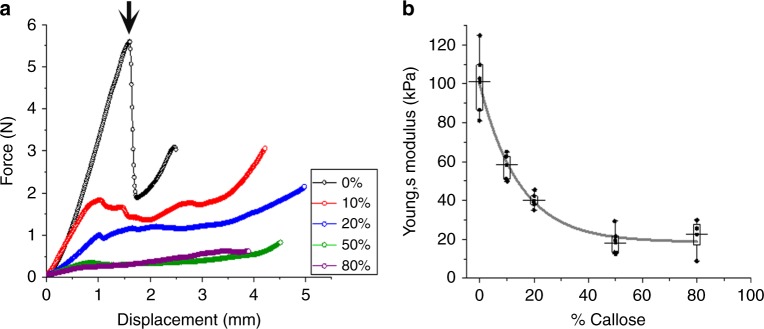
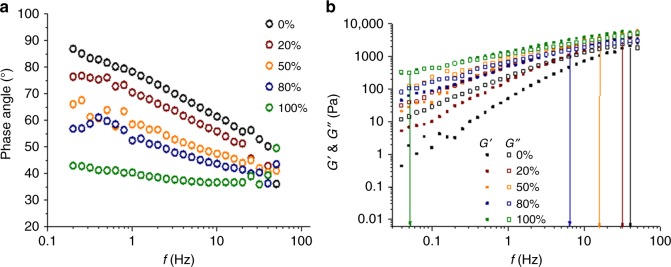
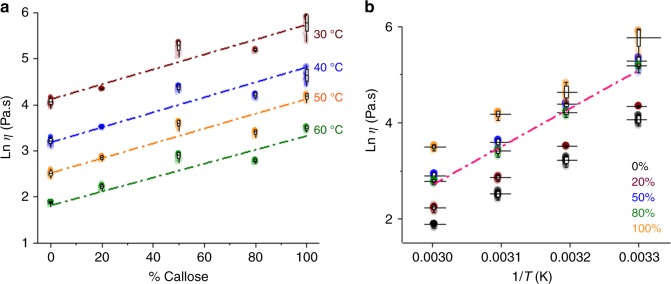
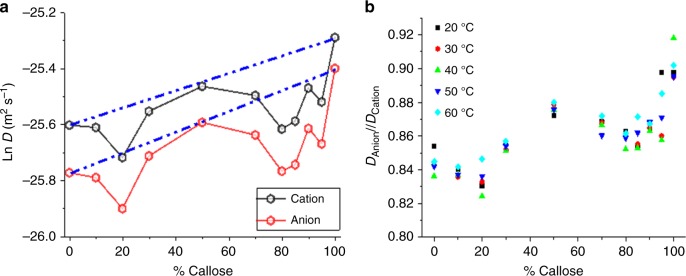
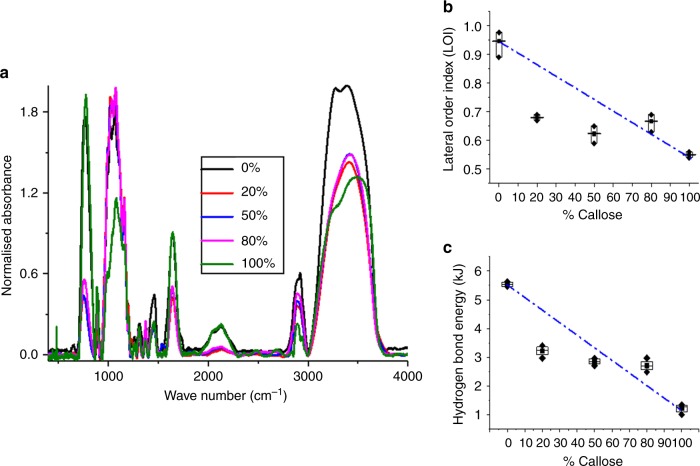
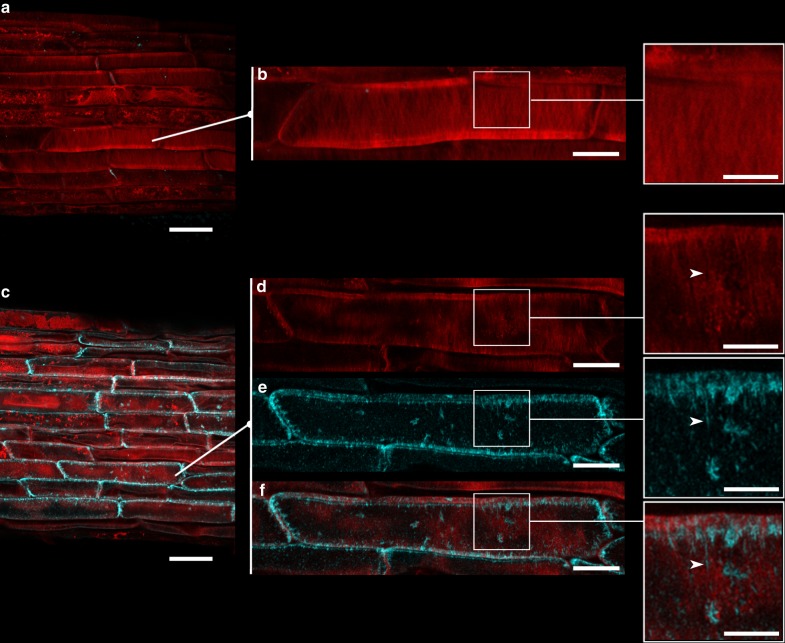
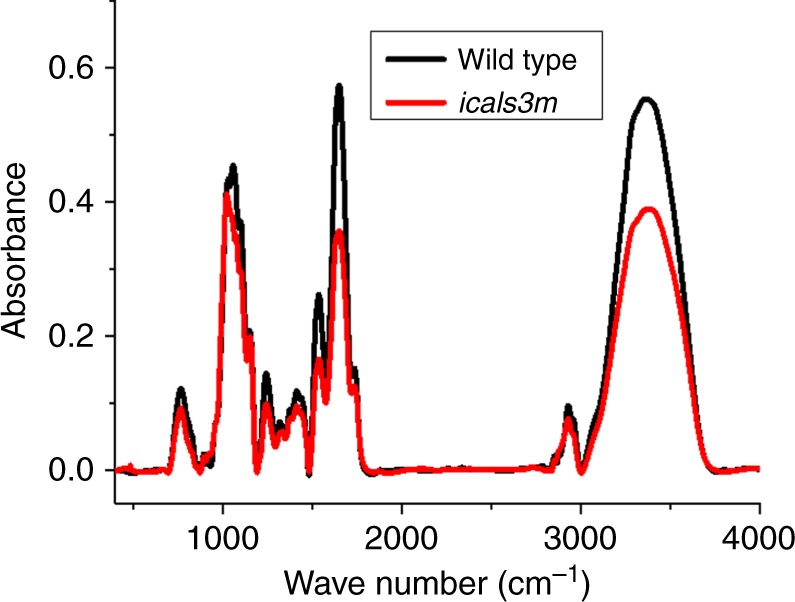
The properties of (1,3)-β-glucans (i.e., callose) remain largely unknown despite their importance in plant development and defence. Here we use mixtures of (1,3)-β-glucan and cellulose, in ionic liquid solution and hydrogels, as proxies to understand the physico-mechanical properties of callose. We show that after callose addition the stiffness of cellulose hydrogels is reduced at a greater extent than predicted from the ideal mixing rule (i.e., the weighted average of the individual components' properties). In contrast, yield behaviour after the elastic limit is more ductile in cellulose-callose hydrogels compared with sudden failure in 100% cellulose hydrogels. The viscoelastic behaviour and the diffusion of the ions in mixed ionic liquid solutions strongly indicate interactions between the polymers. Fourier-transform infrared analysis suggests that these interactions impact cellulose organisation in hydrogels and cell walls. We conclude that polymer interactions alter the properties of callose-cellulose mixtures beyond what it is expected by ideal mixing.


Conflict of interest statement

The authors declare no competing interests.

Figures

Fig. 1
Fig. 1
Morphology of hydrogels with different callose concentrations. Cross-sections of dried hydrogels with different amounts of cellulose and callose were prepared as described in the methods and visualised using scanning electron microscopy (SEM). The pictures (ad) are representative of each mixture composition and are labelled as percentage of callose. Scale bar = 3 µm
Fig. 2
Fig. 2
Nano-mechanical properties of the hydrogels. a shows typical loading and unloading force curves obtained for the different hydrogels (0% callose in black, 20% in red, 50% in blue, 80% in green an 100% in orange) using AFM-nanoindentation. b shows plasticity values as a function of callose concentration; the solid line is presented to guide the eye. c shows the calculated Young’s modulus (data points) as a function of the callose concentration in the hydrogel (solid line is to guide the eye). d Mean Young’s modulus (blue circles, individual data points displayed in c are represented in relation to values obtained as a result of applying the Voigt and Reuss hypothetical model (dashed lines in black and red, respectively). Box plots in b and c represent the first (25%) and third (75%) quartiles, the central horizontal line is the mean, and outliers at the 1% and 99% level are indicated by the whiskers, the data points are averages for 3 individual samples, with 5 areas imaged for each sample
Fig. 3
Fig. 3
Mechanical properties of cellulose-callose hydrogels. a shows force-displacement curves obtained for the hydrogels at different callose concentrations (0% in black, 10% in red, 20% in blue, 50% in green and 80% in magenta) using a Texture Analyser and a 2 mm flat-ended probe in compression mode. The yield point for 100% cellulose (0% callose), which coincides with a yield stress of 1.4 MPa, is arrowed. b shows Young’s modulus values as a function of callose concentration represented in a box plot. The solid line is drawn to guide the eye. The Young’s modulus was calculated according to the Sneddon model as described in methods. Boxes represent the first (25%) and third (75%) quartiles, the central horizontal line is the mean, and outliers at the 1% and 99% level are indicated by the whiskers. Individual data correspond to four-five independent replicas
Fig. 4
Fig. 4
Viscoelastic properties of the cellulose-callose mixtures in ionic liquid solution at 25 °C. a represents changes in the phase angle (δ, open circles) as a function of frequency (f) for the five callose concentrations. b Changes in the viscous (G”, open squares) and elastic (G’, filled squares) components as a function of frequency at different percentage (%) of callose in the mixtures. Graph elements in black correspond to 0% callose, in dark-red to 20%, orange to 50%, blue to 80% and green to 100%. The arrows indicate the approximate frequency where G” and G’ overlap
Fig. 5
Fig. 5
Zero shear rate viscosity values as a function of callose concentration and temperature in the mixtures of ionic liquid solution. a shows the Ln of the viscosity (η) at the different callose percentage and within the temperature range 30-60 °C. A linear fitting (mixing rule) is presented in discontinuous lines in brown for 30 °C, blue for 40 °C, orange for 50 °C and green for 60 °C. The graph in b shows changes in the viscosity values as a function of temperature at the different callose concentrations (%). The discontinuous pink line in b shows the theoretical values predicted for the 50% composition as calculated using the ideal mixing rule. Box plots represent the first (25%) and third (75%) quartiles, the central horizontal line is the mean, and outliers at the 1% and 99% level are indicated by the whiskers. Individual data points for four-five independent replicas are shown, with between 20 and 40 repeat measurements for each concentration/temperature combination. Every individual data point is plotted at 80% transparency
Fig. 6
Fig. 6
Illustration of the non-ideal behaviour of the diffusion of the ions determined by 1H NMR. a represents the Ln diffusion coefficient (D) of the anion (red circles) and the cation (black circles) in [C2mim][OAc] at 30 °C as a function of mixture composition (% of callose). The blue dashed lines represent the theoretical values calculated based on the ideal mixing rule. Average percentage errors (calculated based on the uncertainty in the diffusion values for the cation) are below 2%. b shows the ratio of diffusion coefficients for the anion and the cation (Danion/Dcation) as a function of callose concentrations at 20 °C (black square), 30 °C (red circle), 40 °C (green triangle), 50 °C (blue inverted triangle) and 60 °C (light blue diamond). The values are individual data points. Percentage differences in technical replicas at 30 °C and 40 °C are shown in Supplementary Fig. 6
Fig. 7
Fig. 7
Fourier-transform infrared spectra show the spectra in hydrogels with increasing callose concentration. a The image shows the superimposed normalised FTIR spectra obtained for hydrogel samples with 0% (black trace), 20% (red), 50% (blue), 80% (magenta) and 100% (green) concentrations of callose. b shows the lateral order index (LOI) and c shows hydrogen bond energy as a function of the different callose concentration. These parameters measure the degree of structural organisation. In both cases, values at 20% callose deviate from ideal mixing (blue dashed line). Boxes represent the first (25%) and third (75%) quartiles, the central line is the mean, and outliers at the 1% and 99% level are indicated by the whiskers. Individual data points correspond to three independent replicas
Fig. 8
Fig. 8
Induction of pG1090::icals3m increases callose which decorates cellulose microfibrils. DMSO-treated and estradiol-treated icals3m roots were co-stained with aniline blue (cyan) and direct red 23 (red) which fluorescently stain callose and cellulose, respectively. a, b show confocal images of a region in the elongation zone of the root 24 h after treatment with DMSO (control). b and close-up show the merged signal at higher magnification. cf show comparative regions in icals3m roots 24 h after estradiol induction (activation of icals3m). Notice the increased accumulation of callose (cyan signal) in c comparing to a. Consult also Supplementary Fig. 9. d, e and f show enlargements of a cell from c, with their associated close-ups in the separate channels (d, direct red 23); e, aniline blue and f, merged image). Arrowhead highlights an area where callose integrates very closely to cellulose microfibrils. Scale bars (a, b) = 25 µm; (b, d, e, f) = 10 µm; (b, d, e, f close-ups) = 5 µm
Fig. 9
Fig. 9
Fourier-transform infrared analysis of cell walls 24 h after estradiol treatment. The image shows an example of the FTIR profile for one replica per each genotype: wild type (black trace) and transgenic line pG1090::icals3m (icals3m, in red). Estradiol-treated icals3m accumulates callose in comparison to control (Fig. 8 and Supplementary Fig. 9). Notice that the absorbance of the OH- stretching vibration broad band (3100–3600 cm−1) is reduced in icals3m

References

    1. Bacic, A., Fincher, G. B., Stone, B. A. Chemistry, Biochemistry, and Biology of 1-3 Beta Glucans and Related Polysaccharides, First edn. (Academic press, Elsevier, USA, 2009).
    1. Brown GD, Gordon S. Fungal beta-glucans and mammalian immunity. Immunity. 2003;19:311–315. doi: 10.1016/S1074-7613(03)00233-4. - DOI - PubMed
    1. Ferreira Ana, Alves Vítor, Coelhoso Isabel. Polysaccharide-Based Membranes in Food Packaging Applications. Membranes. 2016;6(2):22. doi: 10.3390/membranes6020022. - DOI - PMC - PubMed
    1. Carreño Neftali L. V., Barbosa Ananda M., Noremberg Bruno S., Salas Mabel M. S., Fernandes Susana C. M., Labidi Jalel. Advances in Nanostructured Cellulose-based Biomaterials. Cham: Springer International Publishing; 2017. Advances in Nanostructured Cellulose-based Biomaterials; pp. 1–32.
    1. Zhang RR, Edgar KJ. Properties, chemistry, and applications of the bioactive polysaccharide curdlan. Biomacromolecules. 2014;15:1079–1096. doi: 10.1021/bm500038g. - DOI - PubMed

Publication types