. 2018 Oct 31;8(1):16123.
doi: 10.1038/s41598-018-34522-4.

The PDL1-inducible GTPase Arl4d controls T effector function by limiting IL-2 production

Affiliations

The PDL1-inducible GTPase Arl4d controls T effector function by limiting IL-2 production

Felix Tolksdorf et al. Sci Rep. .

Abstract

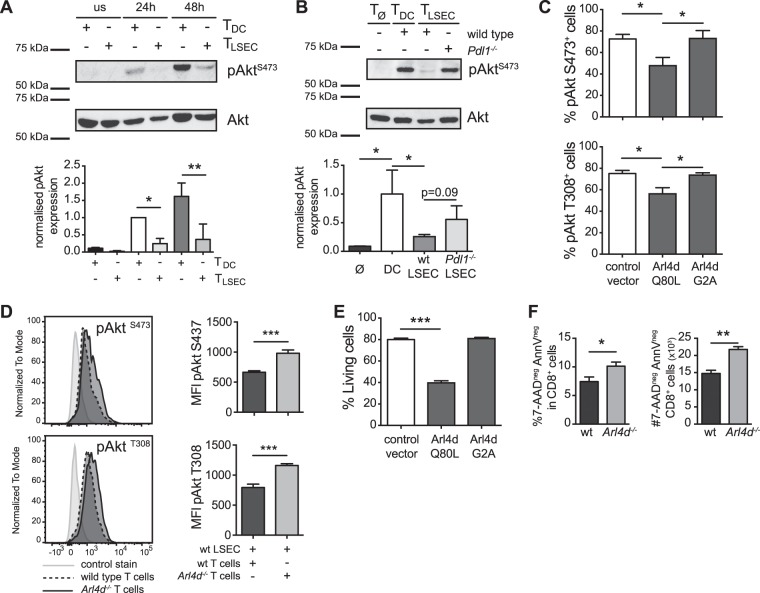
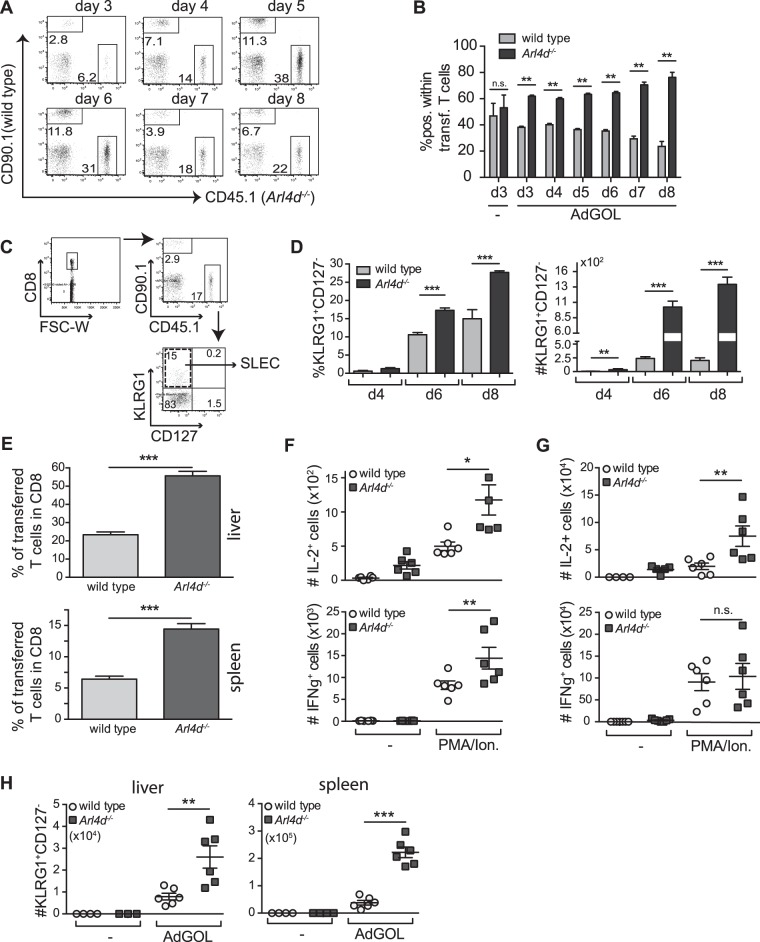
Interleukin-2 (IL-2) is a key regulator of adaptive immune responses but its regulation is incompletely understood. We previously found that PDL1-dependent signals were pivotal for liver sinusoidal endothelial cell-mediated priming of CD8 T cells, which have a strongly reduced capacity to produce IL-2. Here, we show that the expression of the ARF-like GTPase Arl4d is PD-L1-dependently induced in such LSEC-primed T cells, and is associated with reduced IL-2 secretion and Akt phosphorylation. Conversely, Arl4d-deficient T cells overproduced IL-2 upon stimulation. Arl4d-deficiency in CD8 T cells also enhanced their expansion and effector function during viral infection in vivo. Consistent with their increased IL-2 production, Arl4d-deficient T cells showed enhanced development into KLRG1+CD127- short-lived effector cells (SLEC), which is dependent on IL-2 availability. Thus, our data reveal a PD-L1-dependent regulatory circuitry that involves the induction of Arl4d for limiting IL-2 production in T cells.


Conflict of interest statement

The authors declare no competing interests.

Figures

Figure 1
Figure 1
Arl4d expression is PD-L1/PD-1 dependently regulated in CD8 T cells. (A,B) Naive OT-1 CD8 T cells were cultured for the indicated times on C57BL/6 (wild type) LSEC, Pdl1/ LSEC or C57BL/6 (wild type) DC in the presence of antigen (100 μg/ml OVA). (A) relative Arl4d mRNA expression levels in CD8 T cells. (B) IL-2 concentration in the culture supernatant. (C) Wild type CD8 T cells were cultured in the presence or absence of coated anti-CD3ε/CD28 antibodies. After 24 h T cells were harvested and Arl4d and Il2 mRNA levels were determined by qPCR and IL-2 content in the supernatant by ELISA. The data shown are representative of 3 separate experiments. Data are shown as mean +/− s.e.m. Statistical significance was calculated using a one-way ANOVA, * p ≤ 0.05, ** p ≤ 0.01, ***p ≤ 0.001.
Figure 2
Figure 2
Arl4d interferes with Akt phosphorylation in activated T cells. (A,B,D,F) naïve OT-1 CD8 T cells from wild type (A,B,D,F) and Arl4d/ OT-1 T cells (D,F) were co-cultured with antigen-loaded wild type DC, wild type LSEC or Pdl1/ LSEC as indicated. (A,B) At the indicated times T cells were analysed by western blot for expression of pAktS473 and total Akt. Shown are cropped images of the blot (full length blots are presented in Supplementary Figure S2). Bar graphs show normalised expression levels of pAkt. (C,E) A constitutive active Arl4d mutant (Q80L), a myristoylation-deficient Arl4d mutant (G2A) or an empty pEGFP vector were expressed in Jurkat T cells. (C) Jurkat cells were stimulated with anti-CD3 antibodies and analysed for expression of phosphorylated Akt (S473, T308) by flow cytometry in GFP+ Jurkat T cells (n = 5). (D) wt and Arl4d/ T cells stimulated by wild type LSEC for 48 h were stained for pAktS473 and pAktT308 Representative histograms and mean fluorescence intensity (MFI) of CD8+ cells are shown. (E,F) Survival of Jurkat cells (E) 24 h after transfection with Arl4d-mutant constructs or (F) wild type and Arl4d/ OT-1 T cells stimulated by wild type LSEC. Cells were stained with Propidium iodide or 7-AAD and Annexin V. Live cells were defined as being GFPpos/CD8αpos and AnnVneg and PI/7-AADneg. The data shown are representative of 3 (A,B), 5 (C,D,E) and 2 (F) separate experiments. Data are shown as mean +/− s.e.m. Statistical significance was calculated using a one-way ANOVA or a Student’s t-test, *p ≤ 0.05, **p ≤ 0.01, ***p ≤ 0.001.
Figure 3
Figure 3
Arl4d-deficiency does not affect T cell development, but leads to enhanced IL-2 production. (A) CD8+ T cells and CD19+ B cells were isolated from the spleen of Arl4d/ mice and their wild type littermate controls. qPCR was performed to determine Arl4d mRNA expression. (B) Organ weights of Arl4d/ mice (n = 6) and their wild type littermate controls (n = 6). (C) Total cell counts in different lymphatic (peripheral lymph node, spleen) and the bone marrow in Arl4d/ mice (n = 6) and their wild type littermate controls (n = 6). (D) Analysis of the T cell compartment in the spleen from 6–8 week old Arl4d/ mice (n = 6) and their wild type littermate controls (n = 6). Cells were gated according to CD4 or CD8 expression and according to their expression of CD44 and CD62L (Tnaiv: CD44lowCD62Lhigh, Teff: CD44highCD62Llow, Tmem: CD44highCD62Lhigh). (E) Arl4d/ and wild type CD8 T cells were stimulated with plate-bound anti-CD3ε (1 μg/ml) and anti-CD28 (10 μg/ml) antibodies for the indicated times, after which IL-2 content in the supernatant was assed by ELISA. The data shown are representative of 3 (A) and 4 (E) separate experiments, respectively, and shown as mean +/− s.e.m. Statistical significance was calculated using a two-way ANOVA, *p ≤ 0.05, **p ≤ 0.01, ***p ≤ 0.001.
Figure 4
Figure 4
Enhanced expansion and effector cell differentiation of Arl4d-deficient CD8 T cells upon viral infection. Wild type CD90.1 OT-1 CD8 T cells and Arl4d/ CD45.1 OT-1 T cells were adoptively transferred into CD45.2 congenic recipient mice in a 1:1 ratio, which 1 day later were infected with an adenovirus expressing OVA (AdGOL) (n = 6) or were left untreated (n = 4). (A) Expansion of adoptively transferred T cells. Dot plots are gated on total CD8 T cells. (B) Relative contribution of wild type and Arl4d/ CD8 T cells to the total population of transferred CD8 OT-1 T cells during AdGOL infection in blood. (C) Gating strategy for short-lived effector cells (SLEC): CD8+CD127-KLRG1+. (D) Percentages and absolute numbers of CD8+CD127-KLRG1+ SLEC in the blood within the transferred wild type and Arl4d/ OT-1 T cells at the indicated times after AdGOL infection. (E) 8 days after AdGOL infection lymphocytes were isolated from the liver and spleen and the percentage of transferred wild type OT-1 and Arl4d/ OT-1 T cells was determined within the total CD8+ T cell population. (F,G) Absolute numbers of cytokine producing CD8 T cells 8 days after infection with AdGOL within the transferred T cell population from liver (F) and spleen (G) 4 h after PMA/ionomycin restimulation. (H) Absolute numbers of CD8+CD127-KLRG1+ SLEC in the spleen and liver 8 days after AdGOL infection within the transferred T cell population. The data shown are representative of 3 separate experiments. Data are shown as mean +/− s.e.m. Statistical significance was calculated using a one-way ANOVA, *p ≤ 0.05, **p ≤ 0.01, ***p ≤ 0.001.

References

    1. Liao W, Lin J-X, Leonard WJ. Interleukin-2 at the crossroads of effector responses, tolerance, and immunotherapy. Immunity. 2013;38:13–25. doi: 10.1016/j.immuni.2013.01.004. - DOI - PMC - PubMed
    1. Malek TR, Castro I. Interleukin-2 Receptor Signaling: At the Interface between Tolerance and Immunity. Immunity. 2010;33:153–165. doi: 10.1016/j.immuni.2010.08.004. - DOI - PMC - PubMed
    1. Malek TR. The main function of IL-2 is to promote the development of T regulatory cells. J. Leukoc. Biol. 2003;74:961–965. doi: 10.1189/jlb.0603272. - DOI - PubMed
    1. Cheng G, et al. IL-2 receptor signaling is essential for the development of Klrg1+ terminally differentiated T regulatory cells. The Journal of Immunology. 2012;189:1780–1791. doi: 10.4049/jimmunol.1103768. - DOI - PMC - PubMed
    1. Busse D, et al. Competing feedback loops shape IL-2 signaling between helper and regulatory T lymphocytes in cellular microenvironments. Proc. Natl. Acad. Sci. USA. 2010;107:3058–3063. doi: 10.1073/pnas.0812851107. - DOI - PMC - PubMed

Publication types

MeSH terms