. 2018 Dec;21(12):1728-1741.
doi: 10.1038/s41593-018-0262-6. Epub 2018 Oct 31.

Electrical spinal cord stimulation must preserve proprioception to enable locomotion in humans with spinal cord injury

Affiliations

Electrical spinal cord stimulation must preserve proprioception to enable locomotion in humans with spinal cord injury

Emanuele Formento et al. Nat Neurosci. 2018 Dec.

Abstract

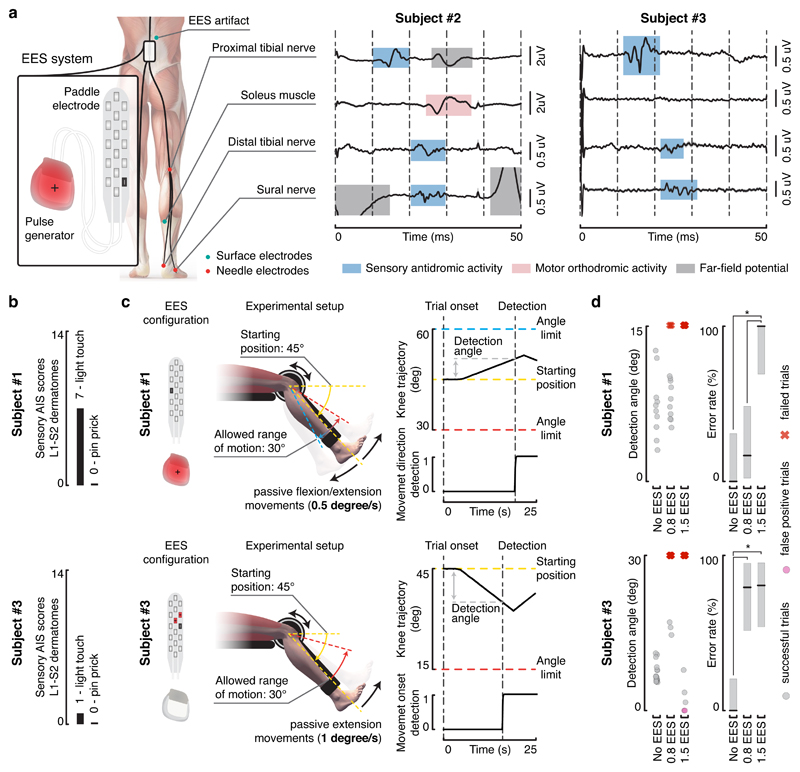
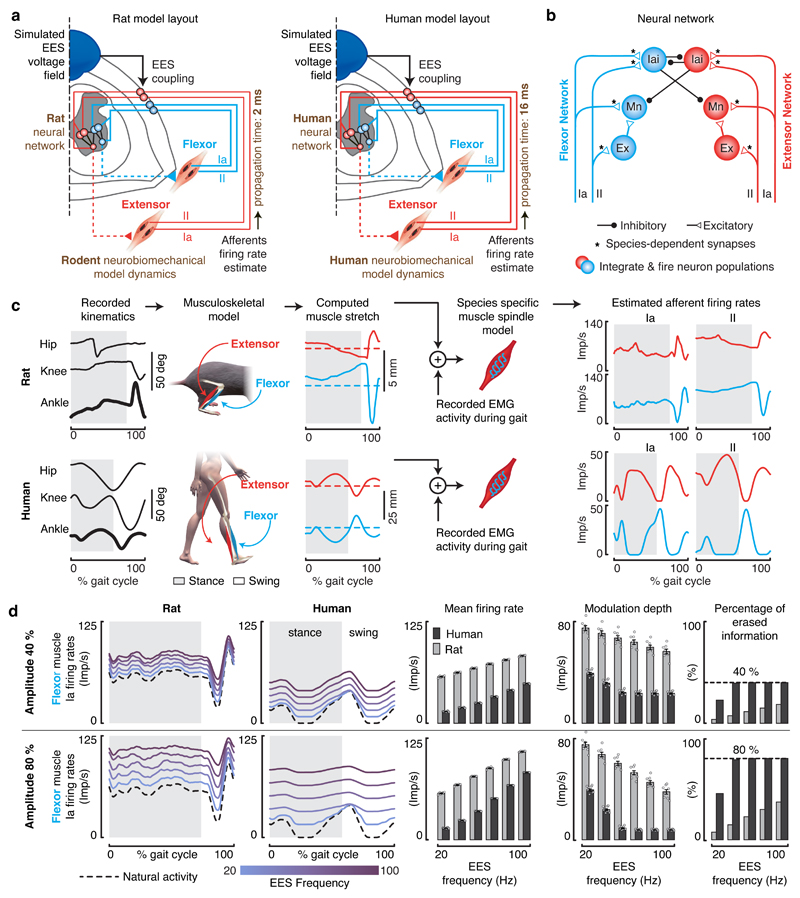
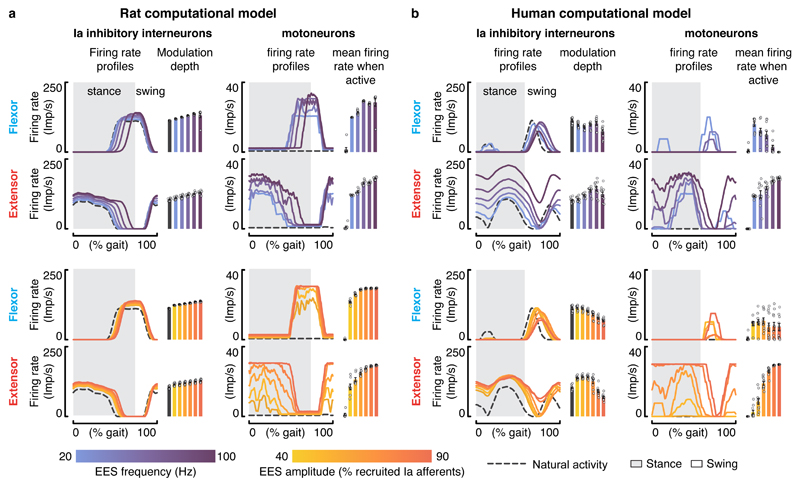
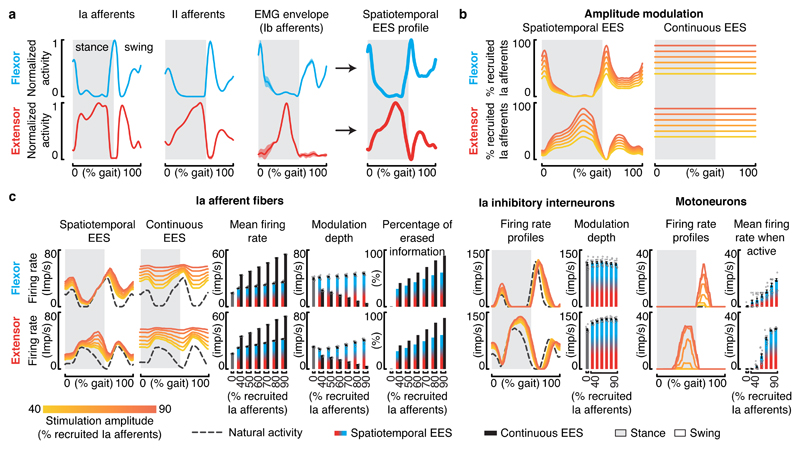
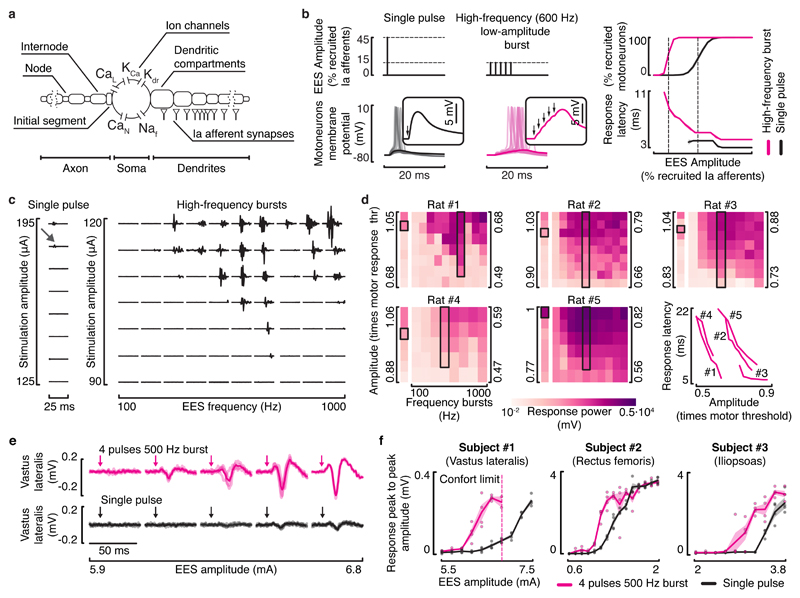
Epidural electrical stimulation (EES) of the spinal cord restores locomotion in animal models of spinal cord injury but is less effective in humans. Here we hypothesized that this interspecies discrepancy is due to interference between EES and proprioceptive information in humans. Computational simulations and preclinical and clinical experiments reveal that EES blocks a significant amount of proprioceptive input in humans, but not in rats. This transient deafferentation prevents modulation of reciprocal inhibitory networks involved in locomotion and reduces or abolishes the conscious perception of leg position. Consequently, continuous EES can only facilitate locomotion within a narrow range of stimulation parameters and is unable to provide meaningful locomotor improvements in humans without rehabilitation. Simulations showed that burst stimulation and spatiotemporal stimulation profiles mitigate the cancellation of proprioceptive information, enabling robust control over motor neuron activity. This demonstrates the importance of stimulation protocols that preserve proprioceptive information to facilitate walking with EES.


Conflict of interest statement

Competing interests

G.C. and S.M. are founders and shareholders of GTXmedical SA, a company developing neuroprosthetic systems in direct relationship with the present work. E.F., M.C., G.C. and S.M. hold several patents related to electrical spinal cord stimulation.

Figures

Figure 1
Figure 1. Probability of antidromic collisions during EES in rats and humans.
a, Schematic illustration of antidromic collisions between EES-induced antidromic action potentials and natural action potentials traveling along the recruited proprioceptive afferent fibers. b, c, Probability for a natural action potential to collide with EES-induced antidromic action potential in the proprioceptive afferent fibers of rats (b; action potential propagation time along the entire length of the fiber: 2 ms) and in the proximal and distal proprioceptive afferent fibers of humans (c; action potential propagation time along the entire length of the fiber: 10 and 20 ms, respectively). The probability is calculated as a function of EES frequency and natural firing rate along afferent fibers. EES frequencies that are commonly used to facilitate locomotion in rats and humans are highlighted in blue. Physiological proprioceptive firing rates reported in rats and humans are highlighted in red. The vertical dashed white line highlights the estimated maximum firing rate of human proprioceptive afferents during gait. Imp, impulse.
Figure 2
Figure 2. EES induces antidromic activity along proprioceptive afferents and disrupts proprioception.
a, Recordings of antidromic activity from sensory nerves during EES. Needle electrodes were inserted subcutaneously close to peripheral nerves and surface electrodes over the soleus muscle, as depicted in the scheme. Continuous EES (20 Hz, monopolar stimulation, black cathode and red anode) was delivered for approximatively one minute. Averaged evoked potentials (±SEM, n = 1198 and n = 1180 independent measurements for subject #2 and #3, respectively). Evoked potentials highlighted in blue, red and grey were respectively classified as antidromic afferent volleys, efferent orthodromic activity, and far-field potentials (e.g. electromyographic activity of nearby muscles). b, Sensory subscores of the L1-S2 dermatomes for the two subjects that performed the threshold to detection of passive movement (TTDPM) test. c, Setup of the TTDPM test. Randomly selected flexion or extension movements were imposed to the knee joint of subject #1 (top). A movement speed of 0.5 degree per second and a maximum allowed range of motion of 15 degrees was used. Subject #3 (bottom) was not able to perceive movement direction. Hence, only the ability to detect extension movements was assessed. A movement speed of 1 degree per second and a maximum allowed range of motion of 30 degrees was used. EES configurations used to target knee flexor and extensor muscles were applied as indicated. d, Scatter plots reporting the detection angle and plots reporting the error rate (percentage correct trials ± 95% CI, n = 32 and n = 47 independent measurements for subject #1 and #3, respectively) on the TTDPM test performance without EES and when delivering continuous EES (50 Hz) at 0.8 and 1.5 times muscle response threshold amplitudes. Grey dots report the detection angle for successful trials, while pink dots and red crosses indicate false positive and failure to detect movement within the allowed range of motion, respectively. *, P < 0.05, Clopper-Pearson non-overlapping intervals, two-sided.
Figure 3
Figure 3. Effect of EES on the natural modulation of proprioceptive circuits during passive movements.
a, Configuration of the experimental setup for subject #2. The subjects were secured in a robotic system that moved the ankle or knee joint passively within the reported range of motion. EES electrodes were configured to target a muscle that underwent stretching cycles during the selected joint movement, as highlighted in red. Configuration of the experimental setup for subjects #1 and #3 are reported in Supplementary Figure 2. b, Plots showing EES pulses, EMG activity of the vastus medialis, and changes in knee joint angle during passive oscillations of the knee for two different EES frequencies (20 and 40 Hz) in subject #2 — similar results were obtained in subject #1 and #3. The same plots for 60 Hz are reported in Supplementary Figure 2. The rectangular windows highlight muscle responses induced by a single pulse of EES. Red and grey arrows depict the onset of the stimulation pulse and of the muscle response, respectively. c, The cycle of joint oscillation was divided into 10 bins of equal durations during which muscle responses were extracted and regrouped. Superimposed muscle responses are displayed for each bin for two EES frequencies (subject #2). Muscle responses used to compute the normalized modulation depth are depicted in light blue. d, Plots reporting the median and 95% CI of the normalized modulation depth, for each EES condition tested and for the different subjects. The CI was bootstrapped (10000 iterations) over n = 2344, n = 1080, and n = 2820 muscle responses, respectively for subject #1, #2, and #3. Low frequencies of stimulation often induced spasms in the muscles. Consequently, subjects #2 and #3 could not be tested with EES frequencies below 20 and 10 Hz, respectively. *, P < 0.05, bootstrap, two-sided. e-h, Configuration of the experimental setup for rats with severe contusion SCI (250 kdyn) and results following the same conventions as in (b-d) for human subjects. Results in f and g are for rat #1, similar results were obtained for all rats. The CI in h was bootstrapped (10000 iterations) over n = 1834, n = 1982, n = 1984, and n = 1983 muscle responses, respectively for rat #1, #2, #3, and #4.
Figure 4
Figure 4. Impact of continuous EES on proprioceptive afferent firings during locomotion in rats and humans.
a, Layout of the computational models built for rats and humans. The components highlighted in brown are tuned to match the anatomical and physiological features of rats versus humans. b, Spiking neural network model of muscle spindle feedback circuits for a pair of antagonist muscles. Mn, motoneuron. Ex, excitatory interneurons. Iai, Ia-inhibitory interneurons. The synapses highlighted with an asterisk (*) are tuned to match the known properties of humans and rats. c, Estimated stretch profiles and afferent firing rates of ankle flexor and extensor muscles over an entire gait cycle in rats (top) and humans (bottom). Similar results were obtained for n = 8 gait cycles in rats, and n = 11 gait cycles in humans. d, Impact of EES on the predicted natural firing rate profiles of group-Ia afferents innervating a flexor muscle of the ankle during locomotion in rats (left) and humans (right). From left to right: averaged firing rate profiles of the simulated population of afferent fibers over one gait cycle, mean afferent firing rate (± SEM, n = 8 gait cycles in rats, n = 11 gait cycles in humans), modulation depth of afferents firing rate profiles (mean ± SEM, n=8 gait cycles in rats, n = 11 gait cycles in humans), and total amount of sensory information erased by EES. Results are reported over a range of EES frequencies. Top and bottom panels reports the results for EES amplitudes recruiting 40% (top) or 80% (bottom) of the entire population of modeled group-Ia afferents.
Figure 5
Figure 5. Interactions between EES and muscle spindle feedback circuits during locomotion in rats and humans.
a,b, Impact of EES on the modeled natural activity of Ia-inhibitory interneurons and on the activation of motoneurons during locomotion in rats and humans. Left, average firing rate profiles and modulation depth of the Ia-inhibitory interneuron populations embedded in the flexor or extensor part of the neural network (mean ± SEM., n=8 gait cycles in rats, n = 11 gait cycles in humans). Right, average firing rate profiles and mean firing rate during the active phase for flexor and extensor motoneurons embedded in the flexor or the extensor neural network (mean ± SEM., n=8 gait cycles in rats, n = 11 gait cycles in humans). The impact of EES frequencies and amplitudes are reported in the top and bottom panels, respectively. EES amplitude was set to a value recruiting 65% of the modeled Ia afferents when EES frequency was scaled up, while EES frequency was set to 60 Hz when the amplitude was increased.
Figure 6
Figure 6. Impact of EES frequencies on muscle activity and leg kinematics during locomotion in rats and humans.
a, Experimental setup in rats. Rats with a severe contusion SCI were positioned in a robotic body weight support system located above a treadmill. Continuous EES was applied over L4 and L2 segments through chronically implanted electrodes secured over the midline of the dorsal spinal cord. b, EMG activity of the tibialis anterior muscle and foot height trajectory over two gait cycles without EES and with EES delivered at 40 Hz, 60 Hz and 80 Hz in rat #1 — similar results were obtained for rat #2, #3 and #4. c, Scatter plots reporting the step height at different gait cycles for the tested EES frequencies (n = 111, n = 139, n = 101, and n = 231 gait cycles, respectively for rat #1, #2, #3, and #4). Dashed lines report the linear regression between the EES frequency and the step height. Slope (m) and R2 are reported. ***, P < 0.001 two-sided Wald test slope ≠ 0. d, Experimental setup in humans. Subjects were positioned in a gravity-assist system that provided personalized forward and upward forces to the trunk. Subjects were asked to step on the treadmill while holding the handlebars, since they were not able to step independently with the hands free. e, EMG activity of flexor (semitendinosus/tibialis anterior) and extensor (rectus femoris/soleus) muscles spanning the right knee and ankle joints, together with the changes in the knee ankle angles and foot elevation over four gait cycles without EES and with EES delivered at 20 Hz, 40 Hz and 80 Hz in subject #1 — similar results were obtained for 49 gait cycles (analyzed in f). EES amplitude was set to 1.2 times the muscle response threshold. Notice the opposite modulation of EMG activity in extensor and flexor muscles with increase in frequencies together with co-activation of flexor with extensor muscles. f, Violin plots reporting the root mean square activity of the recorded muscles, the range of motion of the knee and ankle angles, and the step height at different gait cycles for subject #1 (n = 77 gait cycles). Small grey dots represent the different data points, while the large white dots represent the median of the different distributions. Box and whiskers report the interquartile range and the adjacent values, respectively. *, P < 0.05, ***, P < 0.001, Wilcoxon rank-sum two-sided test with Bonferroni correction for multiple comparisons. The same results are reported for subjects #2 and #3 in Supplementary Figures 4 and 5.
Figure 7
Figure 7. Spatiotemporal EES protocols encoding proprioceptive sensory information.
a, Estimation of spatiotemporal stimulation profiles that match the natural flow of proprioceptive information generated from flexor and extensor muscles of the ankle during gait. From left to right: estimated averaged firing rate profiles of group-Ia, group-II and group-Ib (equivalent to the muscle activity) afferents over a gait cycle, and the sum of these profiles that yielded the estimated stimulation profiles. b, Percentage of primary afferents that are recruited when applying the estimated spatiotemporal stimulation profile and during continuous stimulation. c, Impact of the estimated spatiotemporal stimulation profile on the modulation of muscle spindle feedback circuits from flexor and extensor muscles, including from left to right: group-Ia afferents firings, bar plots reporting the averaged mean firing rate and modulation depth of primary afferents (mean ± SEM., n = 11 gait cycles), overall percentage of sensory information erased by EES, modulation of Ia-inhibitory interneurons, and motoneuron activity (mean ± SEM., n = 11 gait cycles). For comparison, the impact of continuous EES on the group-Ia afferent firings is also reported. Results of simulations are shown for a range of EES amplitudes. Conventions are the same as in Figure 5.
Figure 8
Figure 8. High-frequency low-amplitude bursts of EES recruit motoneurons through temporal summation of EPSPs.
a, Multicompartmental model of alpha motoneurons with realistic strength and distribution of group-Ia synaptic contacts. b, Simulations showing the response of motoneurons to a single pulse of EES at an amplitude recruiting 45% of the afferent population, and to high-frequency bursts (5 pulses, 600 Hz) at an amplitude recruiting 15% of the afferent population. Windows show a zoomed view of the motoneuron membrane potential depolarizations in response to the pulses of EES (arrows). Right: plots showing the percentage of recruited motoneurons and the average (mean ± SEM, n = 5 simulations with different random seed) latency before the onset of an action potential. c, Responses recorded from the tibialis anterior muscle following a single pulse of EES (left) and high-frequency bursts of EES (right) applied to the rat lumbar (L2) spinal cord with severe contusion SCI over a range of amplitudes and burst frequencies (rat #1, shown for all rats in d). The grey arrow indicates the responses induced by a single pulse of EES at the motor response threshold amplitude, emphasizing the need to deliver high amplitudes to elicit responses with single pulses compared to high-frequency bursts. d, Heatmaps representing the average power of motor responses (n=4) to single pulses (column on the left) and high-frequency bursts (matrix on the right) of EES over a range of EES amplitudes and bursts frequencies, for 5 rats. EES amplitude is reported as a multiple of motor response threshold, amplitude corresponding to the response highlighted by the black box. The highlighted column corresponds to the bursts with a frequency inducing the largest motor responses. Right, latencies of motor responses elicited by EES bursts with the frequency highlighted in the black boxes, at increasing amplitudes. e, Motor responses recorded from the vastus lateralis muscle induced by single pulses (bottom) and high-frequency bursts of EES for different stimulation amplitudes (subject #1). Shaded curves represent single trials (n = 4 for each amplitude tested), solid curves represent the average responses. Arrows indicate the onset of the stimulation. f, Plots representing the response peak to peak amplitudes (mean ± SEM, n = 4 for each amplitude tested) as a function of EES amplitude, for both single pulses (black) and high-frequency bursts (pink) and for the different subjects. In subject #1, EES amplitudes higher than 7 mA elicited uncomfortably powerful contractions and were thus not tested.

Comment in

  • A giant step for spinal cord injury research.
    Moritz C. Moritz C. Nat Neurosci. 2018 Dec;21(12):1647-1648. doi: 10.1038/s41593-018-0264-4. Nat Neurosci. 2018. PMID: 30382195 No abstract available.
  • Restoring walking.
    Yates D. Yates D. Nat Rev Neurosci. 2019 Jan;20(1):1. doi: 10.1038/s41583-018-0109-x. Nat Rev Neurosci. 2019. PMID: 30518965 No abstract available.

References

    1. Kiehn O. Decoding the organization of spinal circuits that control locomotion. Nature Publishing Group. 2016:1–15. doi: 10.1038/nrn.2016.9. - DOI - PMC - PubMed
    1. Van den Brand R, et al. Restoring Voluntary Control of Locomotion after Paralyzing Spinal Cord Injury. Science. 2012;336:1182–1185. - PubMed
    1. Wenger N, et al. Closed-loop neuromodulation of spinal sensorimotor circuits controls refined locomotion after complete spinal cord injury. Science Translational Medicine. 2014;6:255ra133–255ra133. - PubMed
    1. Musienko P, et al. Somatosensory control of balance during locomotion in decerebrated cat. J Neurophysiol. 2012;107:2072–2082. - PMC - PubMed
    1. Capogrosso M, et al. A brain–spine interface alleviating gait deficits after spinal cord injury in primates. Nature Publishing Group. 2016;539:284–288. - PMC - PubMed

Publication types