. 2018 Oct 31;8(1):16116.
doi: 10.1038/s41598-018-34414-7.

Corticohippocampal Dysfunction In The OBiden Mouse Model Of Primary Oligodendrogliopathy

Affiliations

Corticohippocampal Dysfunction In The OBiden Mouse Model Of Primary Oligodendrogliopathy

Daniel Z Radecki et al. Sci Rep. .

Abstract

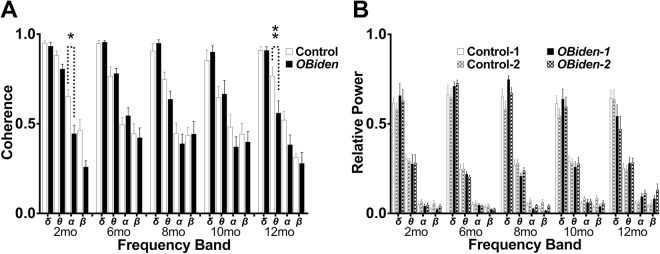
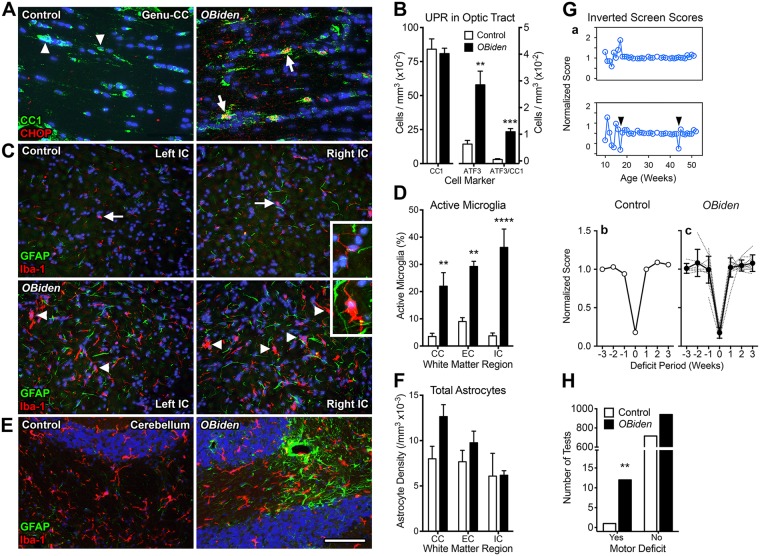
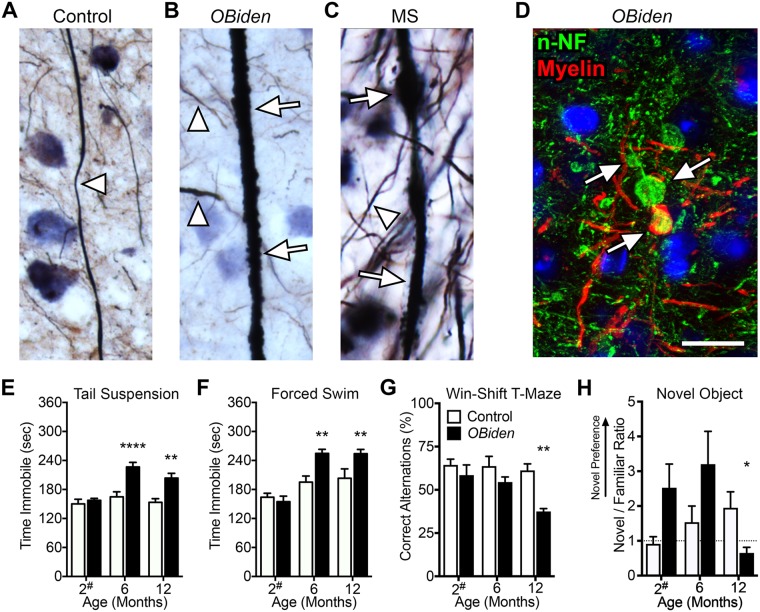
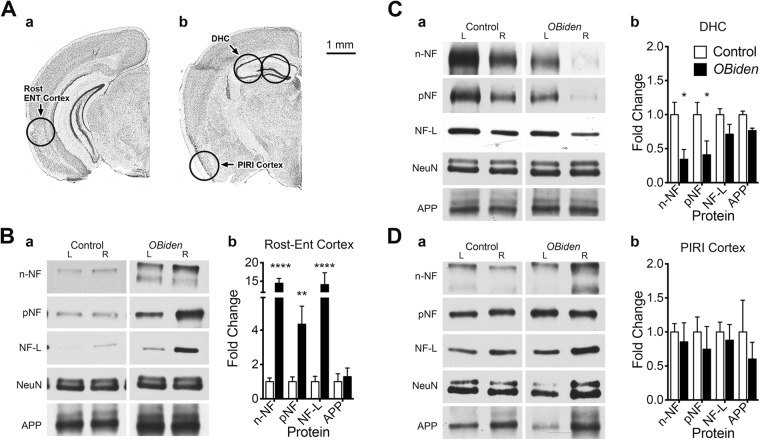
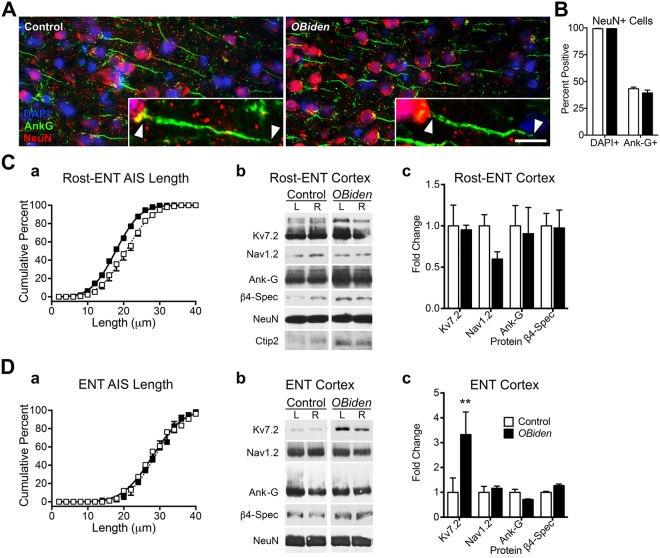
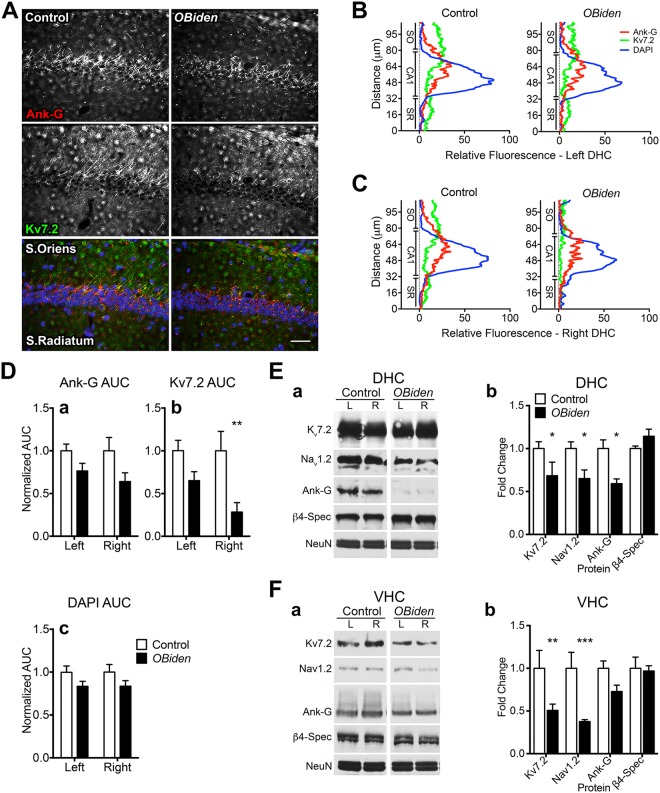
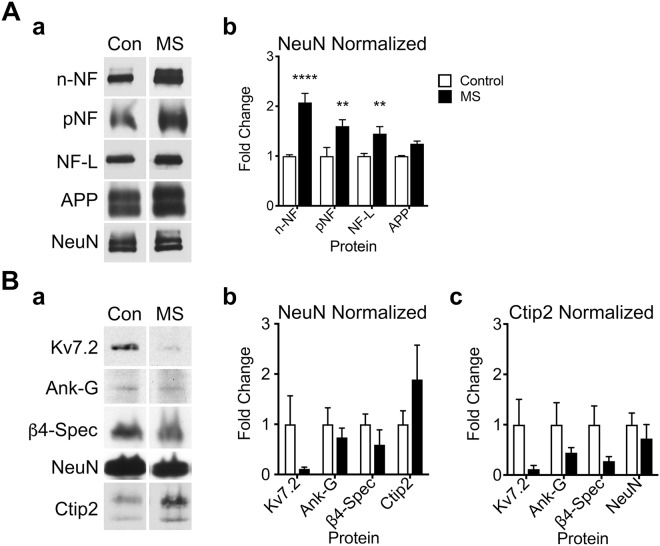
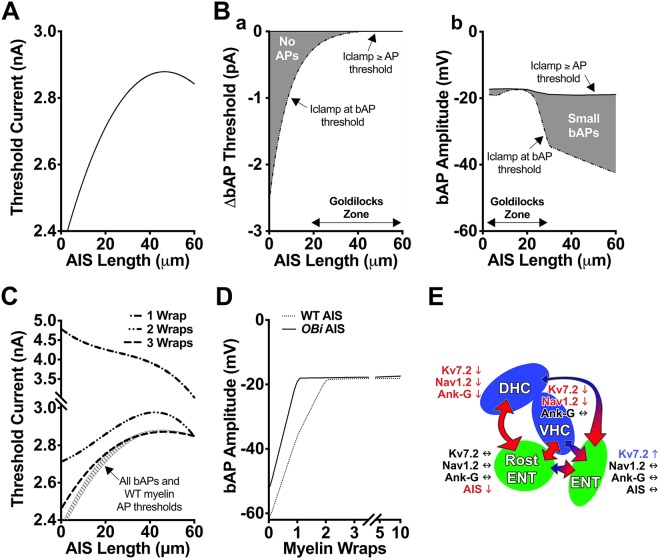
Despite concerted efforts over decades, the etiology of multiple sclerosis (MS) remains unclear. Autoimmunity, environmental-challenges, molecular mimicry and viral hypotheses have proven equivocal because early-stage disease is typically presymptomatic. Indeed, most animal models of MS also lack defined etiologies. We have developed a novel adult-onset oligodendrogliopathy using a delineated metabolic stress etiology in myelinating cells, and our central question is, "how much of the pathobiology of MS can be recapitulated in this model?" The analyses described herein demonstrate that innate immune activation, glial scarring, cortical and hippocampal damage with accompanying electrophysiological, behavioral and memory deficits naturally emerge from disease progression. Molecular analyses reveal neurofilament changes in normal-appearing gray matter that parallel those in cortical samples from MS patients with progressive disease. Finally, axon initial segments of deep layer pyramidal neurons are perturbed in entorhinal/frontal cortex and hippocampus from OBiden mice, and computational modeling provides insight into vulnerabilities of action potential generation during demyelination and early remyelination. We integrate these findings into a working model of corticohippocampal circuit dysfunction to predict how myelin damage might eventually lead to cognitive decline.


Conflict of interest statement

The authors declare no competing interests.

Figures

Figure 1
Figure 1
Interhemispheric electroencephalogram abnormalities in OBi mice. (A) Two channel continuous EEG data recorded from anesthetized mice using an A1-Cz-A2 montage (average of 12.3 ± 6.0 min per mouse, range: 1.90–32.17 min) were epoched at 2 sec for automated artifact rejection and spectral analysis. Real interhemispheric coherence (a) and relative power (b) were averaged across the delta (1–4 Hz), theta (4–10 Hz), alpha (10–15 Hz) and beta (15–30 Hz) frequency bands at 2 (baseline), 6, 8, 10 and 12 mo of age from control and OBi mice. Coherence data were analyzed by pairwise comparisons for each frequency band using two-way RM-ANOVA (frequency band × genotype) and controlled for type I errors using false discovery rate (Q = 0.05). Interhemispheric theta band coherence is reduced in OBi mice at 12 mo compared to littermate controls (q < 0.01; unadjusted p < 0.002) which is consistent with emerging damage to the corpus callosum and/or other myelinated commissures. In addition, we find a statistically significant decrease in alpha coherence for OBi mice at 2 mo (q < 0.03; unadjusted p < 0.003); however, this is likely spurious because of low relative power in alpha (<7%). Further, genotype differences in alpha are absent for the 6–12 mo time points. Overall relative power in each frequency band is stable with age (Controls: delta = 61.9 ± 1.2%, theta = 27.2 ± 0.7%, alpha = 6.1 ± 0.4%, beta = 4.7 ± 0.6%; OBi: delta = 64.0 ± 2.7%, theta = 25.4 ± 1.0%, alpha = 5.8 ± 0.8%, beta = 4.9 ± 1.1%) and there are no differences between EEG channels for either genotype at any age (q > 0.1; unadjusted p > 0.06).
Figure 2
Figure 2
Metabolic stress in OBi oligodendrocytes, associated secondary gliosis and transient physical motor deficits. (A) Immunofluorescence antibody labeling in the genu of corpus callosum from 6 mo OBi mice demonstrates metabolic stress in CC1+ mature oligodendrocytes (green) expressing the canonical UPR transcription factor, CHOP (red). CHOP is not expressed in control oligodendrocytes. (B) Morphometric analysis of cells expressing CC1 and ATF3 proteins in optic tract of 12 mo OBi mice. The density of CC1+ oligodendrocytes in OBi mice is similar to controls (left graph; t-test, p > 0.7, n = 4). Overall expression of ATF3 is increased in OBi mice compared to controls (middle graph; t-test, p < 0.006, n = 4), as is ATF3 expression by CC1+ oligodendrocytes (right graph, p = 0.0001, n = 4). (C) Immunofluorescence staining for GFAP (green) and Iba-1 (red) in internal capsule from 12 mo OBi and control mice. Quiescent microglia dominate in control mice (arrows and inset), while activated microglia are common in OBi (arrowheads and inset). (D) Proportions of morphologically activated microglia are significantly increased in corpus callosum, external capsule and internal capsule from OBi mice (two-way RM-ANOVA, genotype × WM region, p < 0.006, n = 4). (E) Astrogliosis occasionally surrounding blood vessels is apparent in cerebellar WM of OBi mice. (F) Astrocyte densities are normal in WM tracts of OBi mice (two-way RM-ANOVA, genotype × WM region, p > 0.1, n = 3). (G) (a) Longitudinal inverted screen results for control (top) and OBi (bottom) mice showing instances of 3–fold changes in median performance scores (arrowheads). (b,c) Median weekly inverted screen performance scores from control (b) and OBi (c) mice immediately prior to and following 3–fold score changes. (H) Number of inverted screen motor deficits significantly exceeds expectations in OBi mice (Fisher’s exact test, p < 0.01). Scale bar in E: 40 μm (A); 100 μm, insets 40 μm (C); 100 μm (E). See also Supplementary Figs S1–S4.
Figure 3
Figure 3
Cortical pathology in OBi mice and associated cognitive deficits. (A) Bielschowsky silver stain for 12 mo control mouse GM axons (arrowhead). (B) 12 mo OBi mouse showing normal-appearing axons (arrowheads) and a dystrophic axon with surface membrane blebbing (arrows). (C) Normal (arrowhead) and dystrophic axons (arrows) in normal-appearing GM (NAGM) from an MS patient (MS-4663; Supplementary Fig. S7). (D) Cortical immunofluorescence labeling of 12 mo OBi mouse cortex for non-phosphorylated neurofilament (n-NF, green) and myelin (red) shows three adjacent spheroids, two unmyelinated (upper) and one myelinated (lower). The absence of an axon exiting the lower spheroid suggests axon transection. (E,F) Depression-like endophenotype in OBi mice. Tail suspension (E) and forced swim (F) tests show that OBi mice are comparable to controls during 2 mo baseline tests (ordinary two-way ANOVA, genotype × age, p > 0.56: E,F n = 10). OBi mice exhibit increased immobility at 6 and 12 mo compared to controls for tail suspension (E: p < 0.003, 7 ≤ n ≤ 12) and forced swim (F: p < 0.01, 8 ≤ n ≤ 10). (G) Win-Shift T-Maze foraging test shows no genotype differences at 2 and 6 mo (ordinary two-way ANOVA, genotype × age, p > 0.2, 8 ≤ n ≤ 10), but reveals reduced recognition memory and alternating exploration of the goal arms for OBi mice at 12 mo (p < 0.002, n = 8). (H) The novel object test shows a recognition memory deficit in 12 mo OBi mice (ordinary two-way ANOVA, genotype × age, 2 and 6 mo, p > 0.08 7 ≤ n ≤ 8; 12 mo, p < 0.05, 9 ≤ n ≤ 11). Scale bar in D, 20 μm (for A–D). See also Supplementary Figs S3–S6.
Figure 4
Figure 4
Altered neuron specific axonal transport markers. Western blots for neuron specific axonal transport proteins in left and right GM of 12 mo OBi mice. (A) Locations of bilateral 1.0 mm diameter brain punches from (a) rostral entorhinal cortex (Rost-ENT Cortex) (b) rostral piriform cortex (PIRI Cortex) and dorsal hippocampus (DHC) in tissue slices (caudal surfaces of slices shown; Nissl Image Credit: Allen Institute). All punches were harvested caudorostrally. (B) Representative ENT cortex blots (a) for non-phosphorylated neurofilament (n-NF), phosphorylated NF (pNF), light chain NF (NF-L), amyloid precursor protein (APP) and NeuN as loading control, and (b) quantification showing increases in n-NF, pNF and NF-L in OBi mice (ordinary two-way ANOVA, genotype × protein, p < 0.002, 4 ≤ n ≤ 8). (C) Representative DHC blots (a) and quantification (b) showing reduced n-NF and pNF from OBi mice (ordinary two-way ANOVA, genotype × protein, p < 0.03, 3 ≤ n ≤ 4). (D) Representative PIRI cortex blots (a) and quantification (b) showing normal protein levels from OBi mice (ordinary two-way ANOVA, genotype × protein, p > 0.8, 4 ≤ n ≤ 6). See also unprocessed western blots in Supplementary Information.
Figure 5
Figure 5
Secondary consequences of demyelination/remyelination pathology on axon initial segment (AIS) length in 12 mo entorhinal cortex. (A) Immunofluorescence labeling of control and OBi cortical layer 5 neurons for Ank-G (green) and NeuN (red). (B) Proportions of NeuN+ cell bodies, both DAPI+ and Ank-G+, are similar between genotypes (ordinary two-way ANOVA, genotype × cell marker, p > 0.2, n = 3). (C) Average AIS length in OBi rostral entorhinal (Rost-ENT) cortex (a) is significantly shorter than controls (extra sum-of-squares F test for comparison of Gaussian fits, 17.8 ± 0.1 μm versus 20.6 ± 0.2 μm; p < 0.0001, n = 3). (b) Representative western blots from rostral entorhinal cortex (Rost-ENT) for AIS functional and structural proteins and neuronal cell body markers, NeuN and Ctip2, a specific marker for post-mitotic layer 5 neurons. (c) Quantification shows no differences between genotypes (two-way RM-ANOVA, genotype × AIS protein, p > 0.3, n = 4). (D) AIS length in layer 5 entorhinal (ENT) cortex (a) is similar between genotypes (extra sum-of-squares F test for comparison of Gaussian fits, 28.7 ± 0.2 μm versus 28.0 ± 0.2 μm; p = 0.011, n = 3). (b) Representative western blots from left and right ENT cortex for AIS proteins and (c) quantification shows significantly increased Kv7.2 levels (two-way RM-ANOVA, genotype × AIS protein, p < 0.002, n = 4). Abbreviations: Ank-G, ankyrin-G; β4-Spec, β4-spectrin; NeuN as loading control. Scale bar in A, 25 μm; inset, 8.3 μm. See unprocessed western blots in Supplementary Information.
Figure 6
Figure 6
Ion channel disruptions in AIS of hippocampal CA1 neurons. (A) Immunofluorescence labeling for Ank-G (red) and Kv7.2 (green) in the CA1 from control and OBi dorsal hippocampus (DHC). DAPI (blue) shows nuclei. (B,C) Fluorescence intensity plots for each marker in (A) across the left (B) and right (C) DHC CA1. Measurements are orthogonal to CA1 along a 107 μm trace from stratum radiatum (SR) to stratum oriens (SO) (n = 5 mice, 3 slides/mouse). (D) Areas under the curves (AUC) in (B) and (C) for (a) Ank-G, (b) Kv7.2 and (c) DAPI. Kv7.2 intensity in the right DHC CA1 region from OBi mice is reduced compared to controls (two-way RM-ANOVA, genotype × hemisphere, p < 0.008, n = 5). (E) Representative western blots of DHC punches from control and OBi mice for AIS proteins (a) and quantification (b) shows significant reductions in Ank-G, Kv7.2 and Nav1.2 in OBi mice (two-way RM-ANOVA, genotype × AIS protein, p < 0.05, n = 4). (F) Representative western blots of left and right ventral hippocampus (VHC) from control and OBi mice for AIS proteins (a) and quantification (b) shows reduced Kv7.2 and Nav1.2 in OBi mice (two-way RM-ANOVA, genotype × AIS protein, p < 0.01, n = 4). Scale bar in A, 50 μm. Abbreviations: β4-Spec, β4-spectrin; Ank-G, ankyrin-G; NeuN as loading control. See unprocessed western blots in Supplementary Information.
Figure 7
Figure 7
Neurofilament and AIS pathology in frontal cortex of MS patients. Western blot changes in NAGM for structural and AIS proteins in human frontal cortex. (A) Representative blots (a) of NAGM from non-neurological control (Con) and multiple sclerosis (MS) patients for non-phosphorylated neurofilament (n-NF), phosphorylated NF (pNF), light chain NF (NF-L), amyloid precursor protein (APP) and NeuN as loading control. (b) Quantification of blots and two-way ANOVA (disease x protein) indicates statistical significance between the control and MS groups (F(1,23) = 64.3, p < 0.0001). Holm-Sidak posthoc tests show increases in n-NF (p < 0.0001, n = 4), pNF (p < 0.002, n = 3 or 4) and NF-L (p < 0.008, n = 4) in MS NAGM compared to controls. (B) Representative blots (a) of AIS proteins for Kv7.2, Ank-G, β4-spectrin (β4-Spec), NeuN and Ctip2 as loading controls. (b) Quantification of western blots normalized to NeuN shows a large variance in the Ctip2 marker of layer 5/6 pyramidal cells. These data suggest variability in tissue sampling that is not adequately controlled after normalizing to the NeuN pan-neuronal marker. (c) Quantification of blots and normalizing to the Ctip2 marker for layer 5/6 pyramidal neurons controls sampling variability. Overall two-way ANOVA (disease x protein) indicates statistical significance between the control and MS groups (F(1,24) = 8.05, p = 0.009); however, Holm-Sidak posthoc tests do not reveal changes in MS for any individual AIS protein (p > 0.18). See also Supplementary Fig. S7, and unprocessed western blots in Supplementary Information.
Figure 8
Figure 8
Neuron simulations suggest AIS length changes compensate for proximal demyelination. Current clamp simulations of Rost-ENT cortex neurons. (A) Threshold current is proportional to AIS length in a wild type cell. (B) Analytical detection (gray zone) of (a) uncoupling between bAP and AP threshold currents during extreme AIS shortening and (b) diminished bAP amplitudes during extreme AIS lengthening. Mid-range AIS lengths appear stable (Goldilocks zones). (C) Changes to bAP and AP threshold currents caused by proximal demyelinating and early remyelinating lesions as functions of AIS length. The bAP threshold currents (gray striped region) are refractory to myelin pathology, while AP threshold currents (dashed lines) are markedly sensitive to demyelination and early remyelination. With four or more lamellae around axons, bAP and AP threshold currents are similar. (D) Comparisons of bAP amplitudes generated by wild type (WT) and OBi AIS lengths (Fig. 5C) as a function of the number of myelin wraps. The bAP thresholds are invariant with myelin thickness, while AP thresholds are elevated for thin myelin. AIS shortening in OBi mice restores bAP amplitudes to normalcy with the first myelin wrap. (E) Schematic summarizing our findings and the major conserved neural circuits between three brain regions involved in behavior, memory and learning: entorhinal cortex (Rost-ENT and ENT), dorsal hippocampus (DHC) and ventral hippocampus (VHC). Primary pathology in oligodendrocytes leads to demyelination/remyelination in 12 mo OBi mice and may cause degenerative changes in the corticohippocampal loop circuit. Large arrows (red) signify likely increases in synaptic tone, while small arrows reflect likely decreases associated with hypomyelination/demyelination or altered components in the AIS (blue). Overall, the data suggest increased input (higher synaptic tone) into entorhinal cortex and decreased input (lower tone) into hippocampus. We hypothesize that episodic induction of pathology in OBi mice increasingly damages WM, disrupts cognitive networks and affects higher-order behavior, memory and learning. These changes are reminiscent of behavioral symptoms in MS patients. See also Supplementary Fig. S8.

References

    1. Duddy M, Palace J. The UK Risk-Sharing Scheme for interferon-beta and glatiramer acetate in multiple sclerosis. Outcome of the year-6 analysis. Pract Neurol. 2016;16:4–6. doi: 10.1136/practneurol-2015-001209. - DOI - PubMed
    1. Giovannoni G, et al. Daclizumab high-yield process in relapsing-remitting multiple sclerosis (SELECTION): a multicentre, randomised, double-blind extension trial. Lancet Neurol. 2014;13:472–481. doi: 10.1016/S1474-4422(14)70039-0. - DOI - PubMed
    1. Kappos L, et al. Atacicept in multiple sclerosis (ATAMS): a randomised, placebo-controlled, double-blind, phase 2 trial. Lancet Neurol. 2014;13:353–363. doi: 10.1016/S1474-4422(14)70028-6. - DOI - PubMed
    1. Trapp BD, Nave KA. Multiple sclerosis: an immune or neurodegenerative disorder? Annu Rev Neurosci. 2008;31:247–269. doi: 10.1146/annurev.neuro.30.051606.094313. - DOI - PubMed
    1. Southwood CM, Garbern J, Jiang W, Gow A. The unfolded protein response modulates disease severity in Pelizaeus-Merzbacher disease. Neuron. 2002;36:585–596. doi: 10.1016/S0896-6273(02)01045-0. - DOI - PMC - PubMed

Publication types

MeSH terms

Substances