

Demographic supply-demand imbalance in industrial structure in the super-aged nation Japan
- PMID: 30382893
- PMCID: PMC6211503
- DOI: 10.1186/s12976-018-0091-z
Demographic supply-demand imbalance in industrial structure in the super-aged nation Japan
Abstract
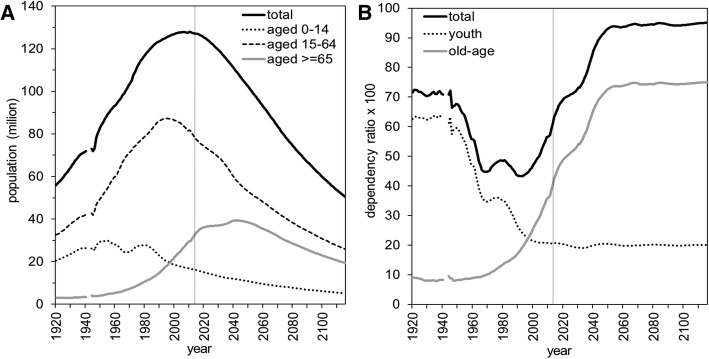
Background: Japan has a rapidly decreasing population, with ultra-low fertility and extremely fast aging. The rapid dynamics constitute a warning that change in the industrial structure may be unable to meet the changing pace of age-dependent demand.
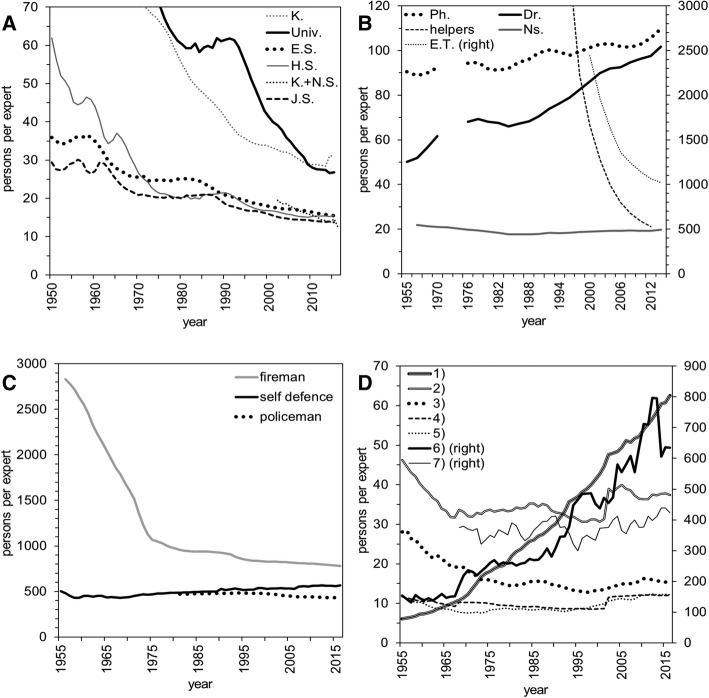
Methods: The present study estimated the supply-demand imbalance by industrial sector, and we investigated the effectiveness of possible countermeasures. To quantify the demographic burden of different industry experts, we employed the dependency ratio to calculate the supply and demand of each industrial sector and occupation.
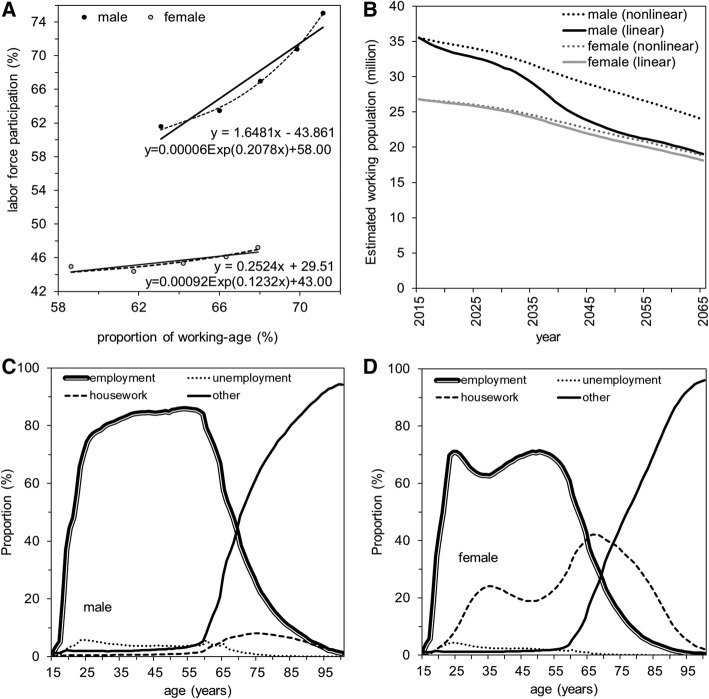
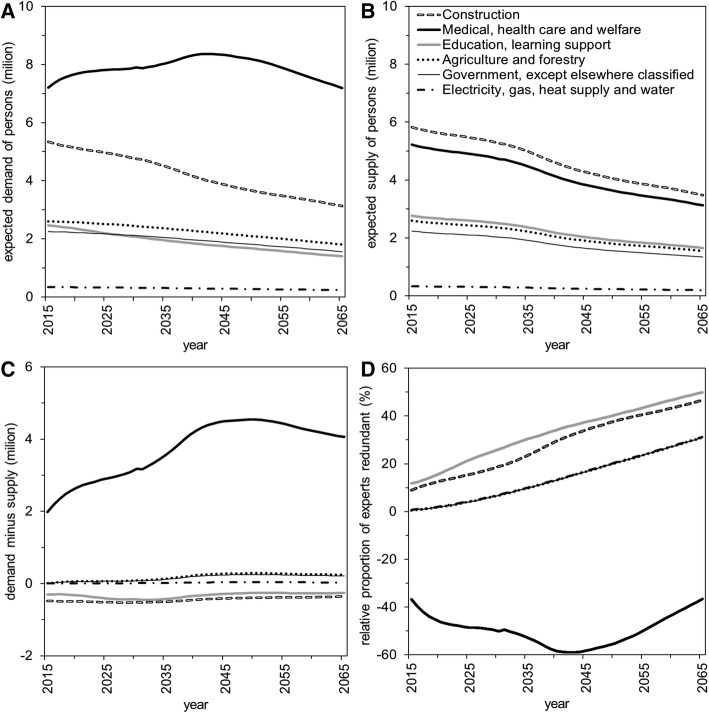
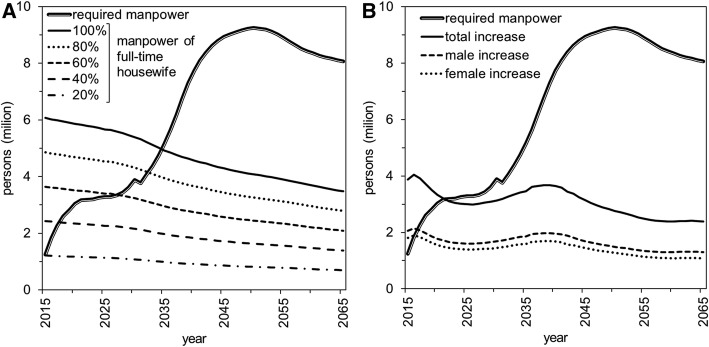
Results: We identified an expected excess of demand in the health-care sector; the growth in that deficiency is likely to continue until 2045, when the elderly population is likely to reach a peak. By contrast, oversupply is expected in the education and construction sectors. An overall shortage of full-time workers is likely to continue until 2050, when we predict that Japan will lack 3.1-9.3 million full-time workers to satisfy the baseline demand level.
Conclusions: Considering that the imbalance is evident over different sectors, interministerial regulation of occupational choice may need to be imposed, e.g., by drastically changing student sizes in different area of higher education. Japan may have to decide to downgrade its social services and potentially consider increasing immigrant workers.
Keywords: Ageing; Dependency ratio; Mathematical model; Occupation; Population.
Conflict of interest statement
Authors’ information
The authors are experts with interest in Theoretical Epidemiology and Demographic Modelling, and the corresponding author acts as the chairperson and team leader of the Department of Hygiene, Hokkaido University Graduate School of Medicine.
Ethics approval and consent to participate
Not applicable.
Consent for publication
Not applicable.
Competing interest
The authors declare that co-author H. Nishiura is the Editor-in-Chief of Theoretical Biology and Medical Modelling. This does not alter the authors’ adherence to all the Theoretical Biology and Medical Modelling policies on sharing data and materials.
Publisher’s Note
Springer Nature remains neutral with regard to jurisdictional claims in published maps and institutional affiliations.
Figures
Similar articles
-
Japan as the front-runner of super-aged societies: Perspectives from medicine and medical care in Japan.Geriatr Gerontol Int. 2015 Jun;15(6):673-87. doi: 10.1111/ggi.12450. Epub 2015 Feb 5. Geriatr Gerontol Int. 2015. PMID: 25656311
-
Alternative demographic futures and the composition of the demand for labor, by industry and by occupation.Res Popul Econ. 1981;3:209-23. Res Popul Econ. 1981. PMID: 12265061
-
[The evolution of employment in Mexico: 1895-1980].Estud Demogr Urbanos Col Mex. 1987 May-Aug;2(2):189-230, 381. Estud Demogr Urbanos Col Mex. 1987. PMID: 12314997 Spanish.
-
Demographics and the social reckoning in the Arab region.East Mediterr Health J. 2013 Apr;19(4):382-8. East Mediterr Health J. 2013. PMID: 23882965 Review.
-
Developments in the Role of Clinical Engineers in Blood Purification Therapy.Blood Purif. 2018;46(2):136-142. doi: 10.1159/000489195. Epub 2018 Apr 26. Blood Purif. 2018. PMID: 29698953 Review. No abstract available.
Cited by
-
Positive psychology as a strategy for promoting sustainable population policies.Heliyon. 2020 Apr 7;6(4):e03696. doi: 10.1016/j.heliyon.2020.e03696. eCollection 2020 Apr. Heliyon. 2020. PMID: 32280798 Free PMC article.
-
Predicting the Epidemiological Dynamics of Lung Cancer in Japan.J Clin Med. 2019 Mar 8;8(3):326. doi: 10.3390/jcm8030326. J Clin Med. 2019. PMID: 30857126 Free PMC article.
-
Depopulation, super aging, and extreme heat events in South Korea.Clim Risk Manag. 2022;38:100456. doi: 10.1016/j.crm.2022.100456. Epub 2022 Aug 23. Clim Risk Manag. 2022. PMID: 37799350 Free PMC article.
References
-
- United Nations, Department of Economic and Social Affairs, Population Division. World population prospects: The 2017 revision, key findings and advance tables. Working Paper No. ESA/P/WP/248. UNDP. https://esa.un.org/unpd/wpp/Publications/Files/WPP2017_KeyFindings.pdf (2017).
-
- Costa DL. The economics and demography of aging. Proc Natl Acad Sci U S A. 2007;104:13217–13218. doi: 10.1073/pnas.0702940104. - DOI
-
- Lee R. The demographic transition: three centuries of fundamental change. J Econ Perspect. 2003;17:167–190. doi: 10.1257/089533003772034943. - DOI
-
- Bloom DE, Canning D. Global demographic change: dimensions and economic significance. Popul Dev Rev. 2008;34:17–51.
-
- Dore RP. Japanese rural fertility; some social and economic factors. Popul Stud. 1953;7:62–88. doi: 10.1080/00324728.1953.10416461. - DOI
Publication types
MeSH terms
LinkOut - more resources
Full Text Sources
Molecular Biology Databases
