. 2018 Oct 31;16(1):85.
doi: 10.1186/s12951-018-0413-7.

The impact of nanoparticle-driven lysosomal alkalinization on cellular functionality

Affiliations

The impact of nanoparticle-driven lysosomal alkalinization on cellular functionality

Bella B Manshian et al. J Nanobiotechnology. .

Abstract

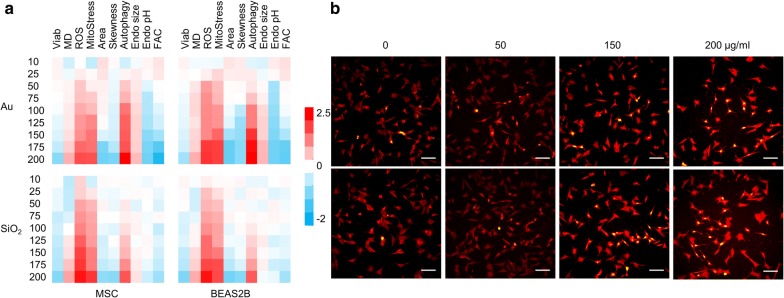
Background: The biomedical use of nanosized materials is rapidly gaining interest, which drives the quest to elucidate the behavior of nanoparticles (NPs) in a biological environment. Apart from causing direct cell death, NPs can affect cellular wellbeing through a wide range of more subtle processes that are often overlooked. Here, we aimed to study the effect of two biomedically interesting NP types on cellular wellbeing.

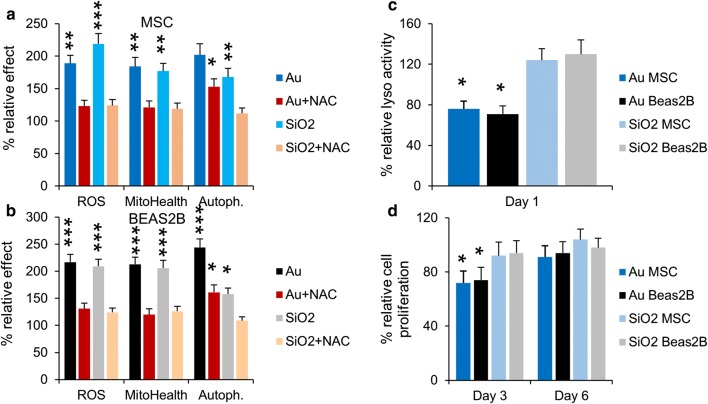
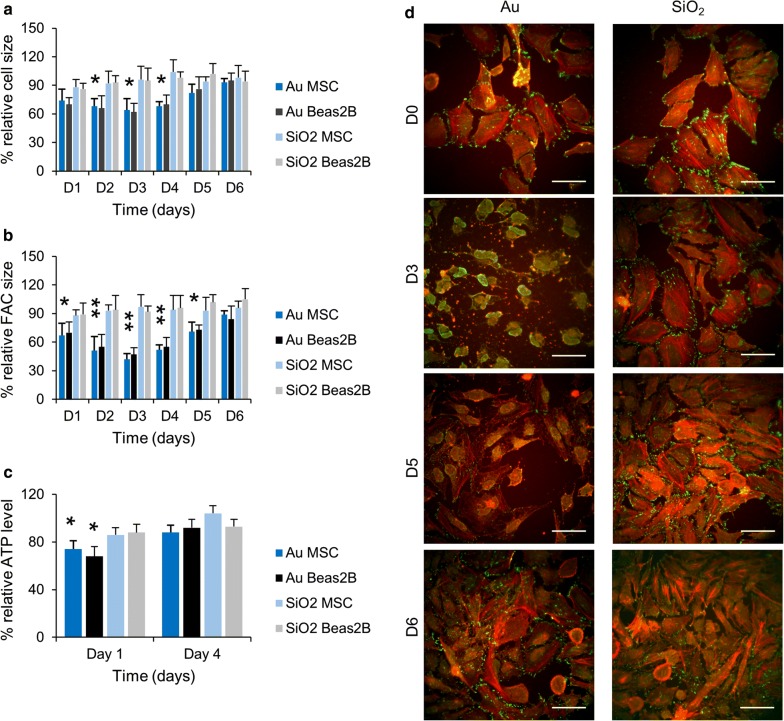
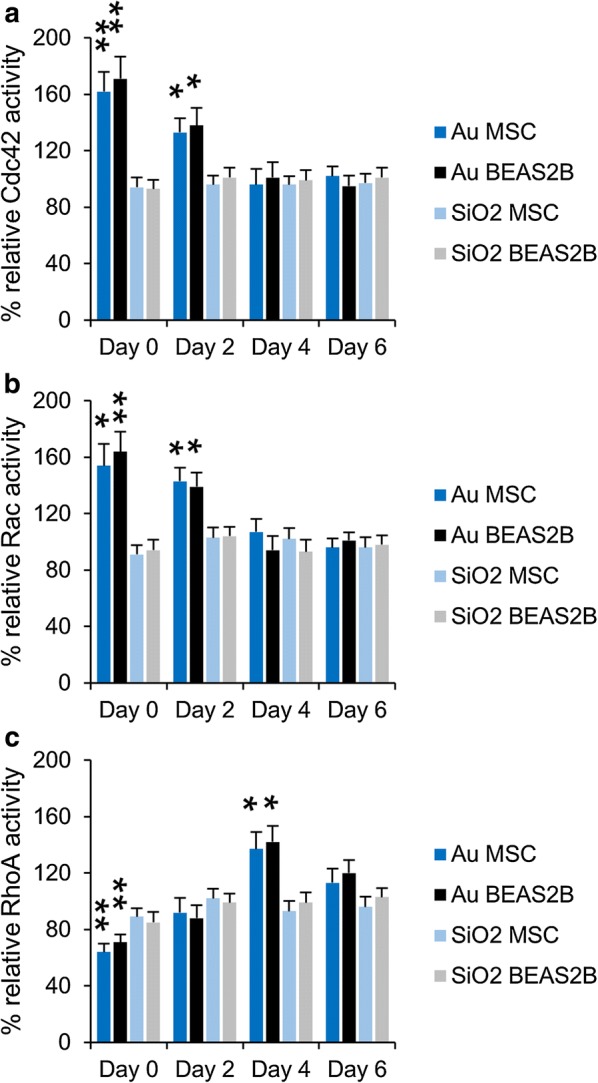
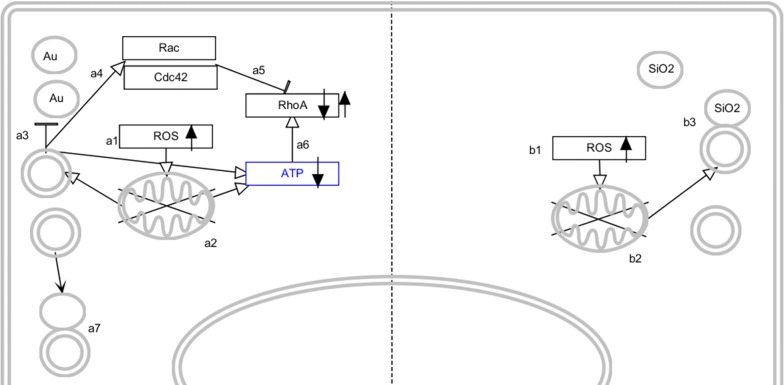
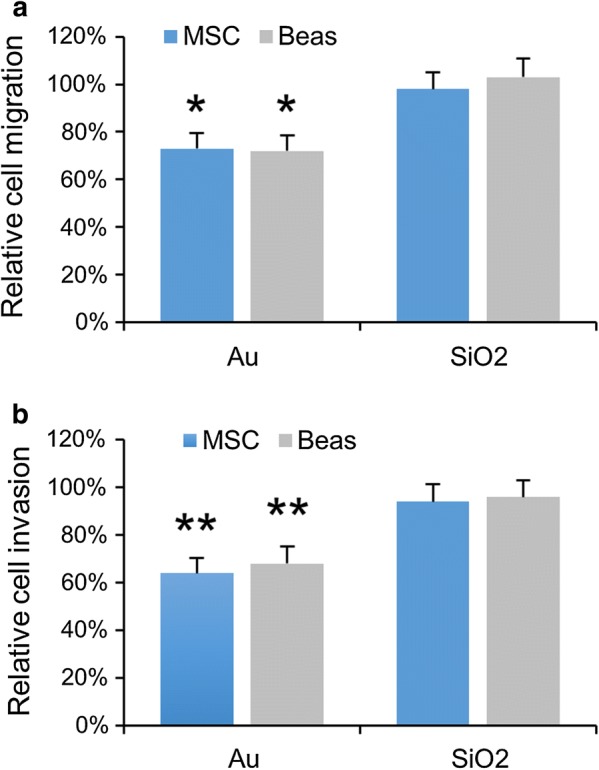
Results: In the present work, gold and SiO2 NPs of similar size and surface charge are used and their interactions with cultured cells is studied. Initial screening shows that at subcytotoxic conditions gold NPs induces cytoskeletal aberrations while SiO2 NPs do not. However, these transformations are only transient. In-depth investigation reveals that Au NPs reduce lysosomal activity by alkalinization of the lysosomal lumen. This leads to an accumulation of autophagosomes, resulting in a reduced cellular degradative capacity and less efficient clearance of damaged mitochondria. The autophagosome accumulation induces Rac and Cdc42 activity, and at a later stage activates RhoA. These transient cellular changes also affect cell functionality, where Au NP-labelled cells display significantly impeded cell migration and invasion.

Conclusions: These data highlight the importance of in-depth understanding of bio-nano interactions to elucidate how one biological parameter (impact on cellular degradation) can induce a cascade of different effects that may have significant implications on the further use of labeled cells.

Keywords: Gold nanoparticles; Nanomedicine; Nanotoxicity; Silicon dioxide nanoparticles.


Figures

Fig. 1
Fig. 1
Representative transmission electron microscopy images of the Au (left) and SiO2 (right) NPs used in the present work
Fig. 2
Fig. 2
a Heat maps of the high content imaging data obtained for MSC (left), or Beas2B cells (right) exposed to various concentrations (10–200 µg/ml) of Au (top half) or SiO2 (bottom half) NPs for 24 h and analyzed for relative cellular health (Viab), membrane damage (MD), mitochondrial ROS (ROS), mitochondrial health (MitoStress), cell area (Area), cell skewness (Skewness), the level of autophagy, size of the endosomal network (Endo size), average endosomal pH (Endo pH) and total size of cellular focal adhesion complexes (FAC). Data are shown as relative values after z-normalization compared to untreated control cells (= 1) where the fold-change is indicated by the respective color-code. Data have been acquired for a minimum of 5000 cells/condition which were gathered from three independent experiments. b Representative high content images of MSCs either unlabeled (0 µg/ml) or labelled with Au (top row) or SiO2 (bottom row) NPs at the concentrations indicated for 24 h. Cells were stained with Live Dead dead cell stain (green) and MitoTracker Red CMXRos (red). Scale bars: 100 µm
Fig. 3
Fig. 3
a, b Histograms representing the high content imaging data for a MSC and b Beas2B cells exposed to Au or SiO2 NPs at 150 µg/ml for 24 h (subcytotoxic conditions) in the absence or presence of 5 mM NAC, a free radical scavenger. The results for ROS, mitochondrial health and autophagy are presented relative to the level observed for untreated control cells. c Histograms representing the lysosomal activity of MSC and Beas2B exposed to Au or SiO2 NPs (150 µg/ml for 24 h) at 1 days after NP exposure. Data are expressed relative to the level for untreated control cells (100%). d Histograms representing the cellular proliferation of MSC and Beas2B exposed to Au or SiO2 NPs (150 µg/ml for 24 h) at 3 and 6 days post NP exposure. Data are expressed relative to the level for untreated control cells (100%). ad Data are expressed as mean ± SD (n = 3). The degree of statistical significance is indicated when relevant (*p < 0.05; **p < 0.01; ***p < 0.001)
Fig. 4
Fig. 4
a, b Histograms representing high content imaging data for MSC and Beas2B cells exposed to Au or SiO2 NPs at 150 µg/ml for 24 h (subcytotoxic conditions). The data for a cell size and b FAC size are expressed as mean ± SD (n = 3) relative to the level for untreated control cells (100%). The results for ROS, mitochondrial health and autophagy are presented relative to the level observed for untreated control cells. c Histograms representing the cellular ATP levels of MSC and Beas2B exposed to Au or SiO2 NPs (150 µg/ml for 24 h) at 1 day and 4 days after NP exposure. Data are expressed as mean ± SD (n = 3) relative to the level for untreated control cells (100%). The degree of statistical significance is indicated when relevant (*p < 0.05; **p < 0.01). d Representative high content images of control MSC (D0) or MSC labelled with the Au or SiO2 NPs at 150 µg/ml for 24 h and then stained for actin (red) and vinculin (green), a marker for focal adhesion complexes 3, 5 and 6 days after labelling. Scale bars: 50 µm
Fig. 5
Fig. 5
ac Histograms representing a Cdc42, b Rac and c RhoA activity levels for MSC and Beas2B cells exposed to Au or SiO2 NPs at 150 µg/ml for 24 h (subcytotoxic conditions). The data are expressed as mean ± SD (n = 3) relative to the level for untreated control cells (100%) and are given for 0, 2, 4 and 6 days post NP exposure. The degree of statistical significance is indicated when relevant (*p < 0.05; **p < 0.01)
Scheme 1
Scheme 1
Schematic representation of the cellular effects of Au (left side) and SiO2 NP (right side) exposure. Au NPs enter the cells and induce ROS (a1) which causes mitochondrial damage (a2). This stimulates autophagy induction, but autophagosomes cannot be efficiently cleared due to the reduced lysosomal activity (a3), resulting in an accumulation of autophagosomes. This stimulates Rac and Cdc42 activity (a4), which affects cytoskeletal organization and actin-mediated signaling. Simultaneously, Cdc42 and Rac inhibit RhoA activity (a5). Mitochondrial damage and accumulation of autophagosomes lowers cellular ATP levels which in turn stimulates RhoA activity. Upon recovery of the cellular degradative capacity, autophagosome clearance occurs more efficiently (a7), which reduces cellular autophagy levels and Rac and Cdc42 activity. The low ATP levels then result in increased RhoA activity, which will return back to baseline levels as turnover of damaged mitochondria occurs more efficiently. RhoA activity will restore the cellular cytoskeleton and actin-mediated signaling. SiO2 NPs also enter the cells and induce ROS (b1), which affects mitochondrial health. This stimulates autophagy (b2) which promotes clearance of the damaged mitochondria. Upon fusion with the lysosomes, mitochondrial turnover remains normal, resulting in an efficient management of cellular ATP levels
Fig. 6
Fig. 6
a, b Histograms representing a relative cell migration and b relative cell invasion levels for MSC and Beas2B cells exposed to Au or SiO2 NPs at 150 µg/ml for 24 h (subcytotoxic conditions). The data are expressed as mean ± SD (n = 3) relative to the level for untreated control cells (100%). The degree of statistical significance is indicated when relevant (*p < 0.05; **p < 0.01)

References

    1. Gustafson HH, Holt-Casper D, Grainger DW, Ghandehari H. Nanoparticle uptake: the phagocyte problem. Nano Today. 2015;10(4):487–510. doi: 10.1016/j.nantod.2015.06.006. - DOI - PMC - PubMed
    1. Teodoro JS, Silva R, Varela AT, Duarte FV, Rolo AP, Hussain S, Palmeira CM. Low-dose, subchronic exposure to silver nanoparticles causes mitochondrial alterations in Sprague-Dawley rats. Nanomedicine. 2016;11(11):1359–1375. doi: 10.2217/nnm-2016-0049. - DOI - PubMed
    1. Webster CA, Di Silvio D, Devarajan A, Bigini P, Micotti E, Giudice C, Salmona M, Wheeler GN, Sherwood V, Bombelli FB. An early developmental vertebrate model for nanomaterial safety: bridging cell-based and mammalian toxicity assessment. Nanomedicine. 2016;11(6):643–656. doi: 10.2217/nnm.15.219. - DOI - PubMed
    1. Lorscheidt S, Lamprecht A. Safety assessment of nanoparticles for drug delivery by means of classic in vitro assays and beyond. Expert Opin Drug Deliv. 2016;13(11):1545–1558. doi: 10.1080/17425247.2016.1198773. - DOI - PubMed
    1. Manshian BB, Munck S, Agostinis P, Himmelreich U, Soenen SJ. High content analysis at single cell level identifies different cellular responses dependent on nanomaterial concentrations. Sci Rep. 2015;5:13890. doi: 10.1038/srep13890. - DOI - PMC - PubMed

LinkOut - more resources