. 2018 Nov 1;13(11):e0206827.
doi: 10.1371/journal.pone.0206827. eCollection 2018.

Hyperuricaemic UrahPlt2/Plt2 mice show altered T cell proliferation and defective tumor immunity after local immunotherapy with Poly I:C

Affiliations

Hyperuricaemic UrahPlt2/Plt2 mice show altered T cell proliferation and defective tumor immunity after local immunotherapy with Poly I:C

Camille Baey et al. PLoS One. .

Abstract

Hyperuricaemia is associated with various metabolic dysfunctions including obesity, type 2 diabetes mellitus, hypertension and in general metabolic syndrome, which are all associated with increased risk of cancer. However, the direct association between elevated uricemia and cancer mortality still remains unclear. In this study, we used a mouse model of hyperuricemia, the Urahplt2/plt2 (PLT2) mouse, to investigate the effect of high uric acid levels on anti-tumor immune responses and tumor growth. In normo-uricaemic C57BL/6 mice injected with B16 melanomas, immunotherapy by treatment with Poly I:C at the tumor site delayed tumor growth compared to PBS treatment. In contrast, Poly I:C-treated hyper-uricaemic PLT2 mice were unable to delay tumor growth. Conventional and monocyte-derived dendritic cells in the tumor-draining lymph nodes (dLN) of C57BL/6 and PLT2 mice were similarly increased after Poly I:C immunotherapy, and expressed high levels of CD40 and CD86. CD8+ T cells in the tumor-dLN and tumor of both WT and PLT2 mice were also increased after Poly I:C immunotherapy, and were able to secrete increased IFNγ upon in vitro restimulation. Surprisingly, tumor-specific CD8+ T cells in dLN were less abundant in PLT2 mice compared to C57BL/6, but showed a greater ability to proliferate even in the absence of cognate antigen. These data suggest that hyperuricaemia may affect the functionality of CD8+ T cells in vivo, leading to dysregulated T cell proliferation and impaired anti-tumor activity.


Conflict of interest statement

The authors have declared that no competing interests exist.

Figures

Fig 1
Fig 1. Poly I:C immunotherapy is ineffective in hyperuricaemic PLT2 mice.
C57BL/6 (WT) and PLT2 mice were challenged with B16 tumor cells and given peri-tumoral injections of PBS or Poly I:C on days 9, 11, 13 and 15. (A) Tumor growth. Graph shows mean tumor size±SEM in groups of 15 mice pooled from three independent experiments. Statistical analysis was by 2-way ANOVA with Tukey’s correction, the p values shown in Figure refer to the comparison between WT Poly I:C and PLT2 Poly I:C. ***p<0.001, ****p<0.0001. (B) Kaplan-Meier survival curves. Data are pooled from four independent experiments, n = 20 mice/group. Statistical analysis was by log-rank test with Bonferroni correction; *p<0.05, **p<0.01.
Fig 2
Fig 2. Poly I:C immunotherapy induces serum cytokine responses in both C57BL/6 and PLT2 mice.
(A) Uric acid levels in untreated C57BL/6 (WT) and PLT2 mice. Mice were gender and age-matched between groups. The bar graph shows mean±SEM for 11 females and 9 males/group, ranging between 9 and 13 weeks of age. Each dot corresponds to one mouse. Statistical analysis was by Mann-Whitney test with ranks comparison, ****p<0.0001. (B) C57BL/6 and PLT2 mice were challenged with B16 tumors and treated with PBS or Poly I:C on day 9. Serum samples were collected three hours later. Cytokine levels were measured by a multiplex bead assay. Bar graphs show the mean+SEM of pooled data from two independent experiments for a total of 8–12 mice/group; each dot corresponds to one mouse. Statistical analysis was by two-way ANOVA with Bonferroni’s post-test. *p<0.05, **p<0.01, ****p<0.0001.
Fig 3
Fig 3. Poly I:C immunotherapy similarly increases DC numbers in the tumor-dLN and tumor of C57BL/6 and PLT2 mice.
C57BL/6 (WT) and PLT2 mice were challenged with B16 tumor cells and treated with peri-tumoral injections of PBS or Poly I:C on days 9, 11, 13 and 15. On day 17 the tumors and tumor-dLN were removed and analyzed by flow cytometry using the gating strategy shown in S1 Fig. (A) Numbers of total DC (CD11c+MHCII+), CD11b+ DC (CD11c+MHCII+CD11b+ CD103-CD8-Ly6C-Ly6B-), CD103+ DC (CD11c+MHCII+CD11b-) and monocyte-derived DC (CD11c+MHCII+CD11b+Ly6C+Ly6B+) per LN. (B) Numbers of the same DC subsets in tumors. Bar graphs show mean+SEM for one of three independent experiments, each with 3–5 mice/group, that gave similar results. Each dot corresponds to one mouse. Statistical analysis was by two-way ANOVA with Bonferroni’s post-test, *p<0.05, **p<0.01.
Fig 4
Fig 4. Poly I:C immunotherapy increases the proportion of intratumoral CD8+IFNγ+ T cells in C57BL/6 and PLT2 mice.
C57BL/6 (WT) and PLT2 mice were challenged with B16 tumor cells and treated with peri-tumoral injections of PBS or Poly I:C on day 9, 11, 13 and 15. On day 17, tumor-dLN and tumors were removed for flow cytometry analysis. (A) Total numbers of CD8+ T cells in dLN and tumors. (B) Representative flow plots showing the proportion of IFNγ+ cells in the intratumoral CD8+ T cell population as determined by intracellular cytokine staining. (C) Proportions of CD8+IFNγ+ cells in tumors, expressed as percentage of the CD45+ population. Bar graphs show mean+SEM for pooled data from 2–5 independent experiments, each with 4–5 mice/group, that gave similar results. Each dot refers to one mouse. Statistical analysis was by two-way ANOVA with Bonferroni’s post-test. *p<0.05, **p<0.01, ***p<0.001, ****p<0.0001.
Fig 5
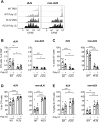
Fig 5. Tumor-specific CD8+ T cells proliferate more vigorously in PLT2 than C57BL/6 mice irrespective of Poly I:C immunotherapy.
C57BL/6 (WT) and PLT2 mice were challenged with B16.OVA tumor cells. CFSE-labelled OT-I T cells were adoptively transferred into tumor-bearing mice on day 8. Mice were treated with peri-tumoral injections of Poly I:C or PBS on day 9, and tumor-dLN were removed on day 12 for flow cytometry analysis. (A) Representative histograms of OT-I T cells in tumor-draining and contralateral LN. OT-I T cells were identified as CD8+CD45.1+. (B) Proportion of OT-I T cells in the CD8+ T cell population in draining and non-dLN. (C-E) Proportions of undivided, divided, and highly divided (4 or more divisions) OT-I T cells in draining and non-draining LN. Bar graphs show mean+SEM for pooled data from two independent experiments each with 4–5 mice/group. Each dot refers to one mouse. Statistical analysis was by two-way ANOVA with Bonferroni’s post-test. *p<0.05, **p<0.01, ***p<0.001, ****p<0.0001.

References

    1. Esposito K, Chiodini P, Colao A, Lenzi A, Giugliano D. Metabolic syndrome and risk of cancer: a systematic review and meta-analysis. Diabetes Care. 2012;35(11):2402–11. Epub 2012/10/25. 10.2337/dc12-0336 . - DOI - PMC - PubMed
    1. Mendonca FM, de Sousa FR, Barbosa AL, Martins SC, Araujo RL, Soares R, et al. Metabolic syndrome and risk of cancer: which link? Metabolism. 2015;64(2):182–9. Epub 2014/12/03. 10.1016/j.metabol.2014.10.008 . - DOI - PubMed
    1. Micucci C, Valli D, Matacchione G, Catalano A. Current perspectives between metabolic syndrome and cancer. Oncotarget. 2016;7(25):38959–72. Epub 2016/10/23. doi: 10.18632/oncotarget.8341 . - DOI - PMC - PubMed
    1. Esposito K, Chiodini P, Capuano A, Bellastella G, Maiorino MI, Rafaniello C, et al. Colorectal cancer association with metabolic syndrome and its components: a systematic review with meta-analysis. Endocrine. 2013;44(3):634–47. Epub 2013/04/03. 10.1007/s12020-013-9939-5 . - DOI - PubMed
    1. Ishino K, Mutoh M, Totsuka Y, Nakagama H. Metabolic syndrome: a novel high-risk state for colorectal cancer. Cancer Lett. 2013;334(1):56–61. Epub 2012/10/23. 10.1016/j.canlet.2012.10.012 . - DOI - PubMed

Publication types

MeSH terms