. 2018 Nov 30:9:71-83.
doi: 10.1016/j.isci.2018.10.011. Epub 2018 Oct 16.

Microglia Induce PDGFRB Expression in Glioma Cells to Enhance Their Migratory Capacity

Affiliations

Microglia Induce PDGFRB Expression in Glioma Cells to Enhance Their Migratory Capacity

Tatjana Wallmann et al. iScience. .

Abstract

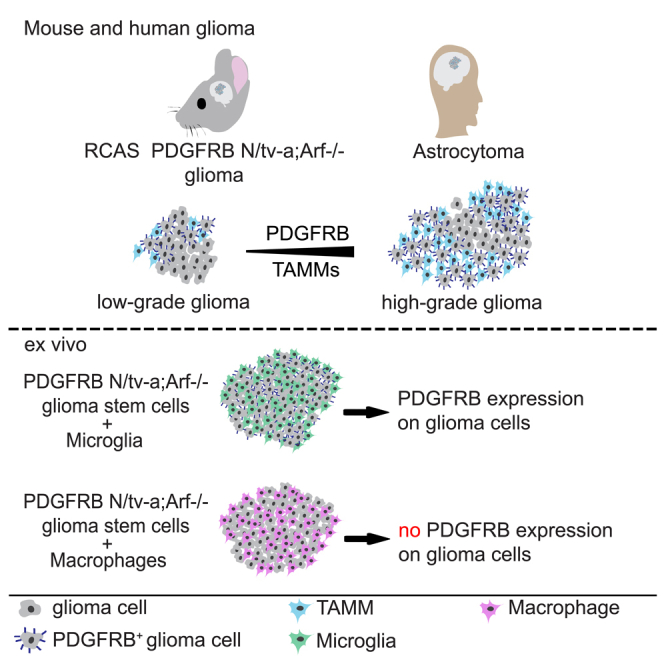
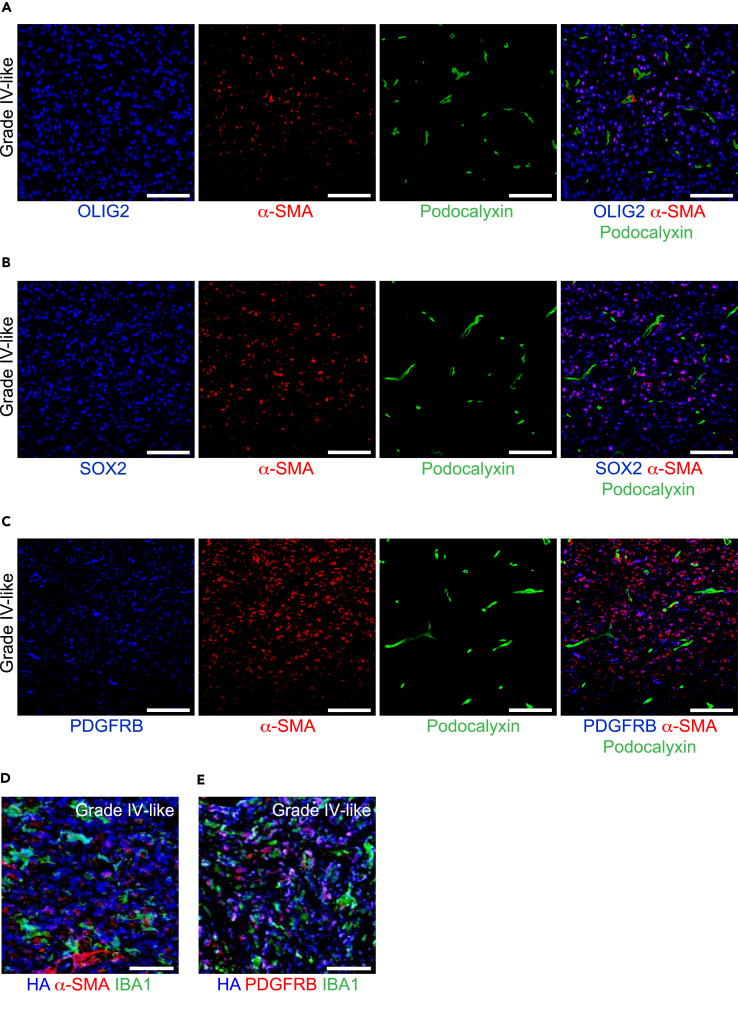
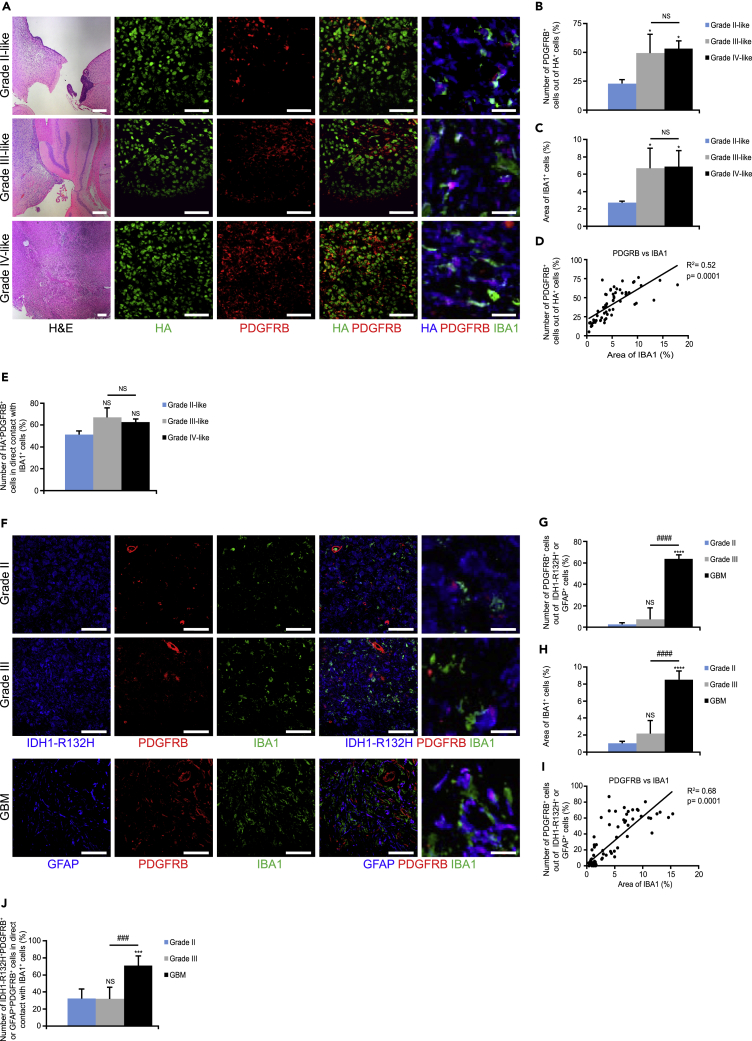
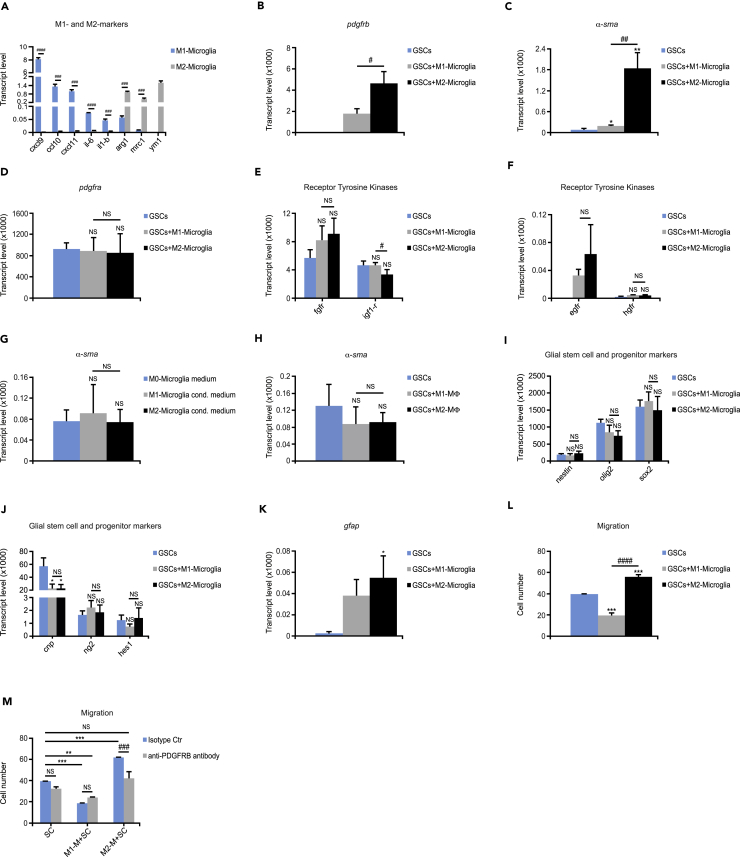
High-grade gliomas (HGGs) are the most aggressive and invasive primary brain tumors. The platelet-derived growth factor (PDGF) signaling pathway drives HGG progression, and enhanced expression of PDGF receptors (PDGFRs) is a well-established aberration in a subset of glioblastomas (GBMs). PDGFRA is expressed in glioma cells, whereas PDGFRB is mostly restricted to the glioma-associated stroma. Here we show that the spatial location of TAMMs correlates with the expansion of a subset of tumor cells that have acquired expression of PDGFRB in both mouse and human low-grade glioma and HCGs. Furthermore, M2-polarized microglia but not bone marrow (BM)-derived macrophages (BMDMs) induced PDGFRB expression in glioma cells and stimulated their migratory capacity. These findings illustrate a heterotypic cross-talk between microglia and glioma cells that may enhance the migratory and invasive capacity of the latter by inducing PDGFRB.

Keywords: Cancer; Immunology; Molecular Mechanism of Behavior; Pathophysiology.


Figures

None
Graphical abstract
Figure 1
Figure 1
PDGFB-Driven Gliomas in the N/tv-a;Arf−/− Mouse Model Display Necrosis and Decreased Vessel Perfusion (A) Images display tumor sections immunostained with H&E. Scale bars, 200 μm. (B) Glioma sections were immunostained for OLIG2 (green) and GFAP (red). Scale bars, 50 μm. (C–G) (C) Images display tumors perfused with fluorescein isothiocyanate-conjugated lectin (green) and immunostained for the endothelial marker CD31 (blue). Graphs display (D) vessel area, (E) vessel density, (F) area of perfused vessels, and (G) % number of perfused vessels. (n = 3–5). Scale bars, 100 μm. Statistical analysis: one-way ANOVA was used; *p < 0.05, **p < 0.01, ***p < 0.001; * indicates significance compared with grade II-like tumors; #p < 0.05; # indicates significance between grade III- and grade IV-like tumors.
Figure 2
Figure 2
PDGFB-Driven Gliomas in the N/tv-a;Arf−/− Mouse Model Display Hypoxia and Vessel Hyperproliferation (A and B) (A) Glioma sections were immunostained for CD31 (blue), fluorescein isothiocyanate (FITC)-conjugated lectin (green), and the hypoxic marker pimonidazole (PIMO; red). (B) Graph shows morphometric analysis of hypoxic areas (n = 3–5). Scale bars, 100 μm. (C and D) (C) Glioma sections were immunostained for podocalyxin (green) and Ki67 (red). (D) Graph depicts quantification of podocalyxin+Ki67+ vessels (n = 3). Scale bars, 100 μm. (E and F) (E) Glioma sections were immunostained for CD31 (blue), FITC-conjugated lectin (green), and the pericyte marker α-SMA (red). (F) Graph displays quantification of α-SMA (n = 3–5). Scale bars, 100 μm. (G and H) (G) Glioma sections were immunostained for OLIG2 (blue), FITC-conjugated lectin (green), and α-SMA (red). (H) Graph shows analysis of α-SMA+ sheets associated with vessels. Scale bars, 100 (left panel) and 50 (right panel) μm. (I) Glioma sections were immunostained for podocalyxin (blue), microglia marker IBA1 (green), and α-SMA (red). Scale bars, 100 (left panel) and 50 μm (right panel). Statistical analysis: one-way ANOVA (A–F) and student's t test (G and H) were used: *p < 0.05, **p < 0.01, ***p < 0.001, ****p < 0.0001; * indicates significance (A–F) compared with grade II-like tumors and (H) between α-SMA+ sheets associated and non-associated with vessels; #p < 0.05; # indicates significance between grade III- and grade IV-like tumors.
Figure 3
Figure 3
Glioma Cells Express Pericyte Markers in Mouse Gliomas (A–H) Mouse glioma sections were immunostained for (A) α-SMA (red) and the pericyte marker PDGFRB (green), (B) α-SMA (red) and the pericyte and oligodendrocyte marker NG2 (blue), (C) α-SMA (red) and the mesenchymal and stem cell marker CD44 (green), (D) α-SMA (red) and the GSC marker SOX2 (green), (E) α-SMA (red) and the oligodendrocyte marker OLIG2 (green), (F) α-SMA (red) and the astrocyte marker GFAP (green), and (G) α-SMA (red) and the HA tag expressed by PDGF-B-transformed cells (green). Left panels show α-SMA+ sheets, whereas right panels display round α-SMA+ cells. Scale bars, 100 (left panel) and 50 (right panel) μm. (H) Graph displays quantification of HA+, OLIG2+, SOX2+, and GFAP+ cells out of α-SMA+ cells (n = 3). Statistical analysis: one-way ANOVA was used.
Figure 4
Figure 4
Spatial Location of α-SMA+SOX2+, α-SMA+OLIG2+, and α-SMA+PDGFRB+ GCs in Mouse Gliomas (A–C) Mouse glioma sections were immunostained for (A) OLIG2 (blue), α-SMA (red), and podocalyxin (green); (B) SOX2 (blue), α-SMA (red), and podocalyxin (green); and (C) PDGFRB (blue), α-SMA (red), and podocalyxin (green). Scale bars, 100 μm. (D) Mouse grade IV-like glioma sections were immunostained for HA tag (expressed by PDGFB-transformed cells; blue), α-SMA (red), and IBA1 (green). Scale bars, 50 μm. (E) Mouse grade IV-like glioma sections were immunostained for HA tag (blue), PDGFRB (red), and IBA1 (green). Scale bars, 50 μm. See also Figure S1.
Figure 5
Figure 5
Glioma Cells Express PDGFRB and Correlate with IBA1+ TAMMs in Mouse and Human Gliomas (A–E) (A) Mouse glioma sections were immunostained for H&E, HA tag (green/blue), PDGFRB (red), and IBA1 (green). Graphs display (B) number of PDGFRB+HA+ cells out of HA+ cells, (C) area of IBA1+ cells, (D) Pearson's correlation between PDGFRB+ cells versus area of IBA1, and (E) number of PDGFRB+HA+ cells in contact with IBA1+ cells (n = 3–5). Scale bars 200 (left panel), 50 (middle panel), and 20 (far right panel) μm. (F–J) (F) Human glioma sections were immunostained for IDH1-R132H or GFAP (blue), PDGFRB (red), and IBA1 (green). Graphs depict (G) number of PDGFRB+IDH1-R132H+ cells or PDGFRB+GFAP+ cells out of IDH1-R132H+ or GFAP+ cells, (H) area of IBA1+ cells, (I) Pearson's correlation between PDGFRB+ cells versus area of IBA1, and (J) number of PDGFRB+IDH1-R132H+ or PDGFRB+GFAP+ cells in contact with IBA1+ cells (n = 5–6). Scale bars, 50 (left panel) and 20 (far right panel) μm. Statistical analysis: one-way ANOVA (B, C, E, G, H, and J) and Pearson's correlation (D and I) were used: *p < 0.05, ***p < 0.001, ****p < 0.0001; * indicates significance compared with grade II-like tumors; ###p < 0.001, ####p < 0.0001; # indicates significance between grade III- and grade IV-like tumors. See also Figure S2.
Figure 6
Figure 6
TAMMs Induce Mouse Glioma Cells to Express PDGFRB (A) Microglia were polarized to either an M1 or M2 phenotype. Graph shows gene expression levels of cxcl9, cxcl10, cxcl11, il-6, il-1b, arginase1, mrc1, and ym1 analyzed by qRT-PCR (n = 3). (B–F) GFP+GSCs were co-cultured with M1- or M2-polarized microglia. Graphs depict qRT-PCR analysis of gene expression levels of flow-sorted tumor cells for (B) pdgfrb, (C) α-sma, (D) pdgfra, (E) fgfr and igf-1r, and (F) egfr and hgfr (n = 3). (G) GFP+GSCs were cultured with M0 (not polarized)-, M1- or M2-like microglia conditioned media. Graph displays gene expression levels for α-sma quantified by quantitative RT-PCR (n = 3). (H) GFP+GSCs were co-cultured with M1- or M2-polarized BMDMs. Graph shows qRT-PCR analysis of gene expression levels of flow-sorted tumor cells for α-sma (n = 3). (I–K) GFP+GSCs were co-cultured with M1- or M2-polarized microglia. Graphs depict quantitative RT-PCR analysis of gene expression levels of flow-sorted tumor cells for (I) nestin, olig2, and sox2; (J) cnp, ng2, and hes1; and (K) gfap (n = 3). (L and M) GFP+GSCs were co-cultured with M1- or M2-polarized microglia, and migrated tumor cells were stained for the OLIG2 marker. Graphs display (L) migrated tumor cells (n = 3) and (M) migrated tumor cells with isotype control or neutralizing PDGFRB antibody (n = 3). Statistical analysis: Student's t test (A) and one-way ANOVA (B–M) were used: *p < 0.05, **p < 0.01, ***p < 0.001; * indicates significance (B–L) compared with tumor cells alone, and (M) compared with tumor cells without PDGFRB blockage; #p < 0.05, ##p < 0.01, ###p < 0.001, ####p < 0.0001; # indicates significance between (A) M1-like and M2-like microglia and (B–L) tumor cells co-cultured with M1 microglia compared with M2 microglia and (M) tumor cells co-cultured with M2-like microglia without PDGFRB blockage compared with PDGFRB blockage. All data represent one out of three independent experiments and are presented as the mean +SD. See also Table S1.

Similar articles

Cited by

References

    1. Ajami B., Bennett J.L., Krieger C., Tetzlaff W., Rossi F.M. Local self-renewal can sustain CNS microglia maintenance and function throughout adult life. Nat. Neurosci. 2007;10:1538–1543. - PubMed
    1. Baluk P., Morikawa S., Haskell A., Mancuso M., McDonald D.M. Abnormalities of basement membrane on blood vessels and endothelial sprouts in tumors. Am. J. Pathol. 2003;163:1801–1815. - PMC - PubMed
    1. Bowman R.L., Klemm F., Akkari L., Pyonteck S.M., Sevenich L., Quail D.F., Dhara S., Simpson K., Gardner E.E., Iacobuzio-Donahue C.A. Macrophage ontogeny underlies differences in tumor-specific education in brain malignancies. Cell Rep. 2016;17:2445–2459. - PMC - PubMed
    1. Brennan C.W., Verhaak R.G., McKenna A., Campos B., Noushmehr H., Salama S.R., Zheng S., Chakravarty D., Sanborn J.Z., Berman S.H. The somatic genomic landscape of glioblastoma. Cell. 2013;155:462–477. - PMC - PubMed
    1. Burton J.L., Madsen S.A., Yao J., Sipkovsky S.S., Coussens P.M. An immunogenomics approach to understanding periparturient immunosuppression and mastitis susceptibility in dairy cows. Acta Vet. Scand. 2001;42:407–424. - PubMed