

Quantifying Single mRNA Translation Kinetics in Living Cells
- PMID: 30385605
- PMCID: PMC6211384
- DOI: 10.1101/cshperspect.a032078
Quantifying Single mRNA Translation Kinetics in Living Cells
Abstract
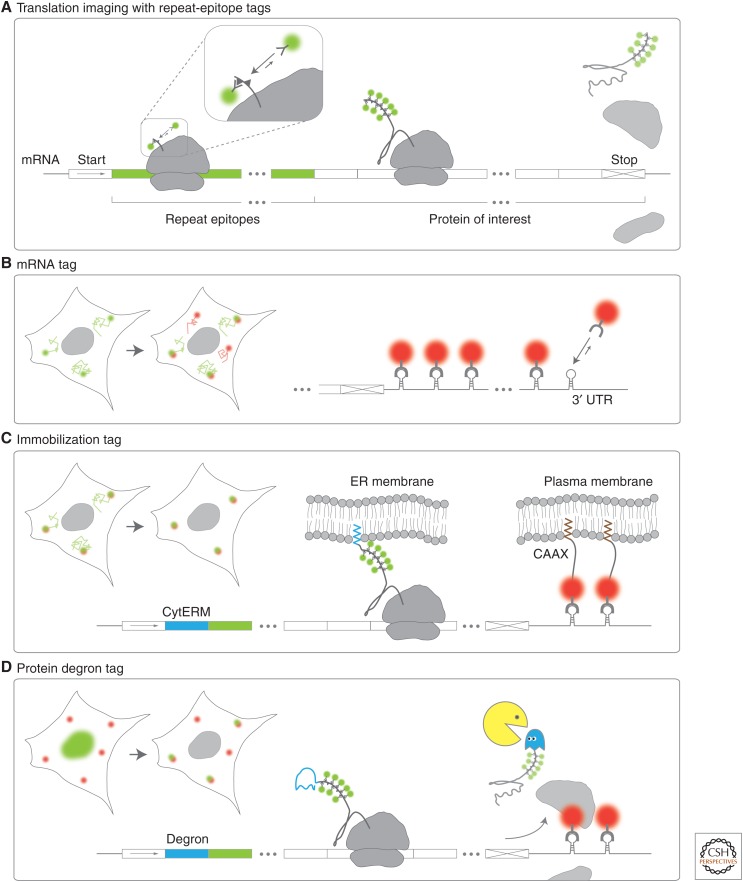
One of the last hurdles to quantifying the full central dogma of molecular biology in living cells with single-molecule resolution has been the imaging of single messenger RNA (mRNA) translation. Here we describe how recent advances in protein tagging and imaging technologies are being used to precisely visualize and quantify the synthesis of nascent polypeptide chains from single mRNA in living cells. We focus on recent applications of repeat-epitope tags and describe how they enable quantification of single mRNA ribosomal densities, translation initiation and elongation rates, and translation site mobility and higher-order structure. Together with complementary live-cell assays to monitor translation using fast-maturing fluorophores and mRNA-binding protein knockoff, single-molecule studies are beginning to uncover striking and unexpected heterogeneity in gene expression at the level of translation.
Copyright © 2018 Cold Spring Harbor Laboratory Press; all rights reserved.
Figures


Similar articles
-
Real-time quantification of single RNA translation dynamics in living cells.Science. 2016 Jun 17;352(6292):1425-9. doi: 10.1126/science.aaf0899. Epub 2016 May 5. Science. 2016. PMID: 27313040
-
What determines eukaryotic translation elongation: recent molecular and quantitative analyses of protein synthesis.Open Biol. 2020 Dec;10(12):200292. doi: 10.1098/rsob.200292. Epub 2020 Dec 9. Open Biol. 2020. PMID: 33292102 Free PMC article. Review.
-
Translation Dynamics of Single mRNAs in Live Cells.Annu Rev Biophys. 2024 Jul;53(1):65-85. doi: 10.1146/annurev-biophys-030822-034116. Epub 2024 Jun 28. Annu Rev Biophys. 2024. PMID: 38134333 Free PMC article. Review.
-
Translation dynamics of single mRNAs in live cells and neurons.Science. 2016 Jun 17;352(6292):1430-5. doi: 10.1126/science.aaf1084. Epub 2016 May 5. Science. 2016. PMID: 27313041 Free PMC article.
-
Translation complex profile sequencing to study the in vivo dynamics of mRNA-ribosome interactions during translation initiation, elongation and termination.Nat Protoc. 2017 Apr;12(4):697-731. doi: 10.1038/nprot.2016.189. Epub 2017 Mar 2. Nat Protoc. 2017. PMID: 28253237
Cited by
-
Computational design and interpretation of single-RNA translation experiments.PLoS Comput Biol. 2019 Oct 16;15(10):e1007425. doi: 10.1371/journal.pcbi.1007425. eCollection 2019 Oct. PLoS Comput Biol. 2019. PMID: 31618265 Free PMC article.
-
A genetically encoded probe for imaging nascent and mature HA-tagged proteins in vivo.Nat Commun. 2019 Jul 3;10(1):2947. doi: 10.1038/s41467-019-10846-1. Nat Commun. 2019. PMID: 31270320 Free PMC article.
-
Decomposing bulk signals to reveal hidden information in processive enzyme reactions: A case study in mRNA translation.PLoS Comput Biol. 2024 Mar 5;20(3):e1011918. doi: 10.1371/journal.pcbi.1011918. eCollection 2024 Mar. PLoS Comput Biol. 2024. PMID: 38442108 Free PMC article.
-
Imaging and Quantifying Ribosomal Frameshifting Dynamics with Single-RNA Precision in Live Cells.Methods Mol Biol. 2025;2875:99-110. doi: 10.1007/978-1-0716-4248-1_9. Methods Mol Biol. 2025. PMID: 39535643 Free PMC article.
-
Central dogma rates in human mitochondria.Hum Mol Genet. 2024 May 22;33(R1):R34-R41. doi: 10.1093/hmg/ddae036. Hum Mol Genet. 2024. PMID: 38779776 Free PMC article. Review.
References
-
- Bertrand E, Chartrand P, Schaefer M, Shenoy SM, Singer RH, Long RM. 1998. Localization of ASH1 mRNA particles in living yeast. Mol Cell 2: 437–445. - PubMed
Publication types
MeSH terms
Substances
Grants and funding
LinkOut - more resources
Full Text Sources
Other Literature Sources