Comparative Study
. 2018 Nov 2;3(21):e120451.
doi: 10.1172/jci.insight.120451.

Hemoglobin oxidation-dependent reactions promote interactions with band 3 and oxidative changes in sickle cell-derived microparticles

Affiliations
Comparative Study

Hemoglobin oxidation-dependent reactions promote interactions with band 3 and oxidative changes in sickle cell-derived microparticles

Sirsendu Jana et al. JCI Insight. .

Abstract

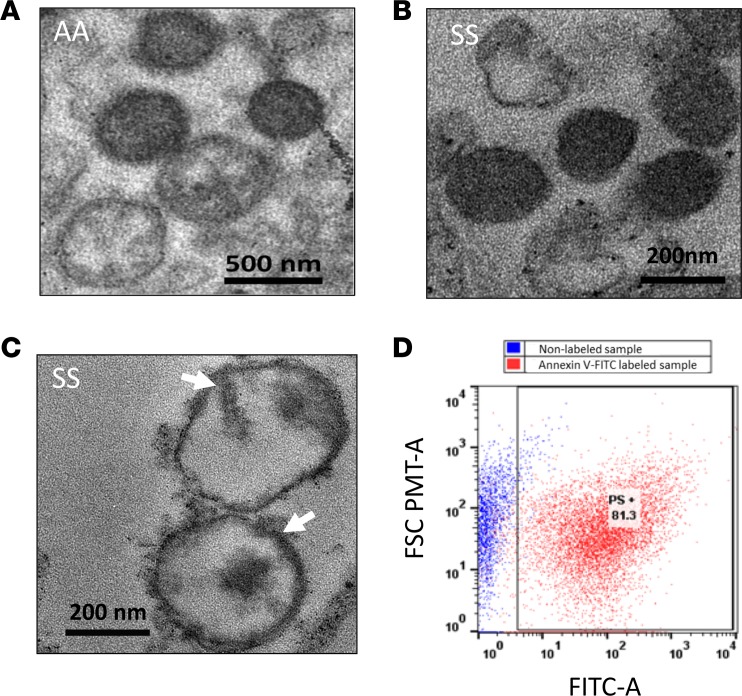
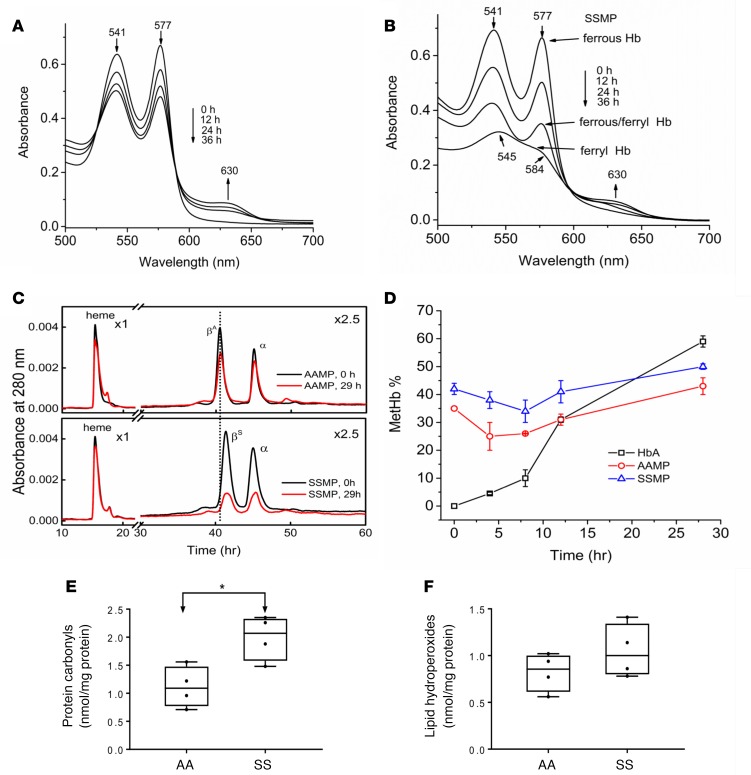
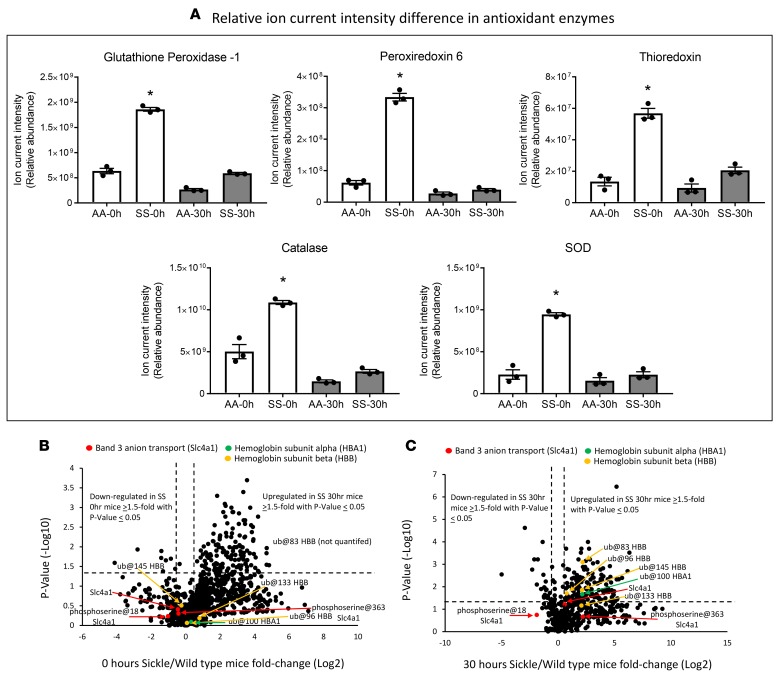
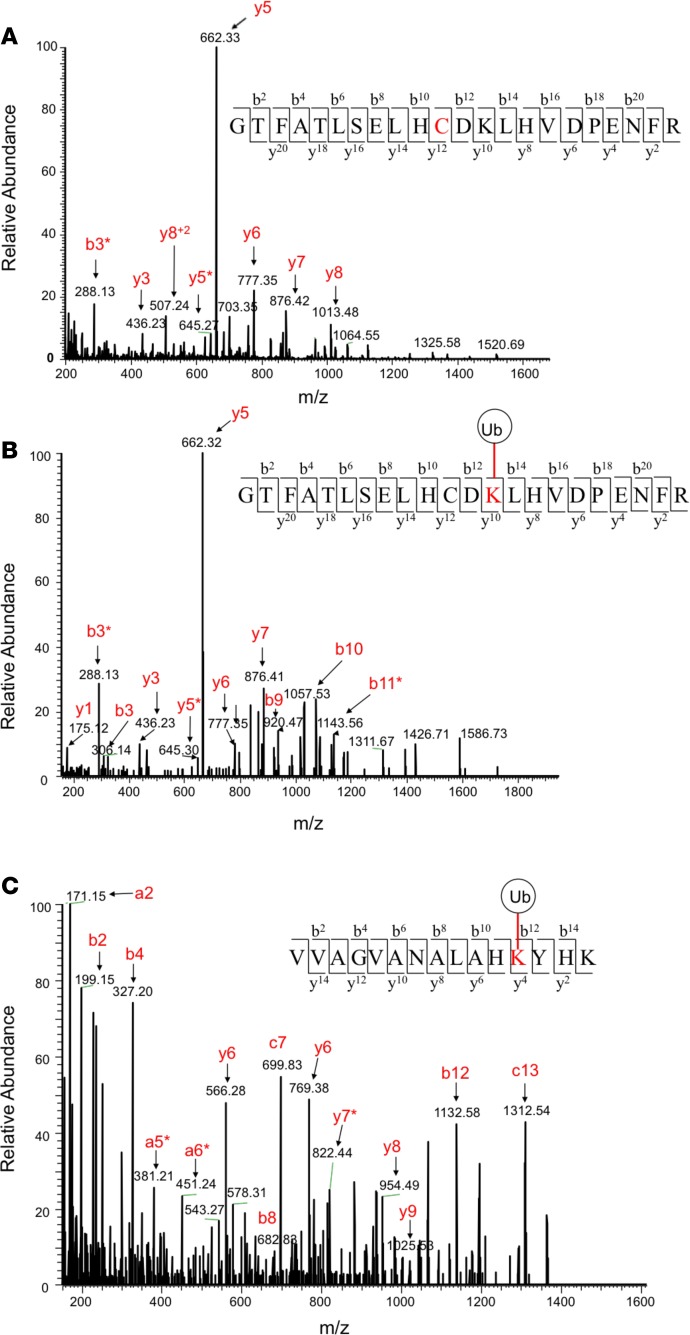
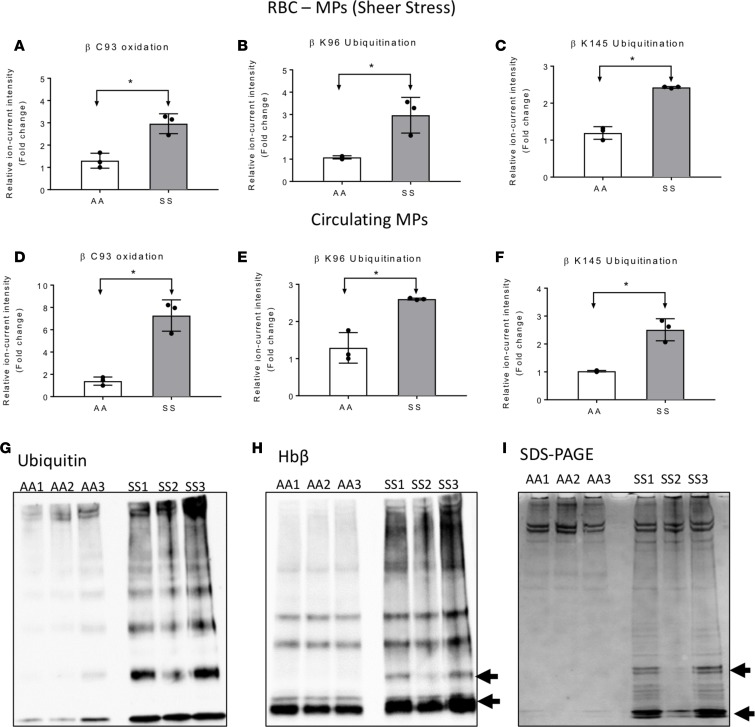
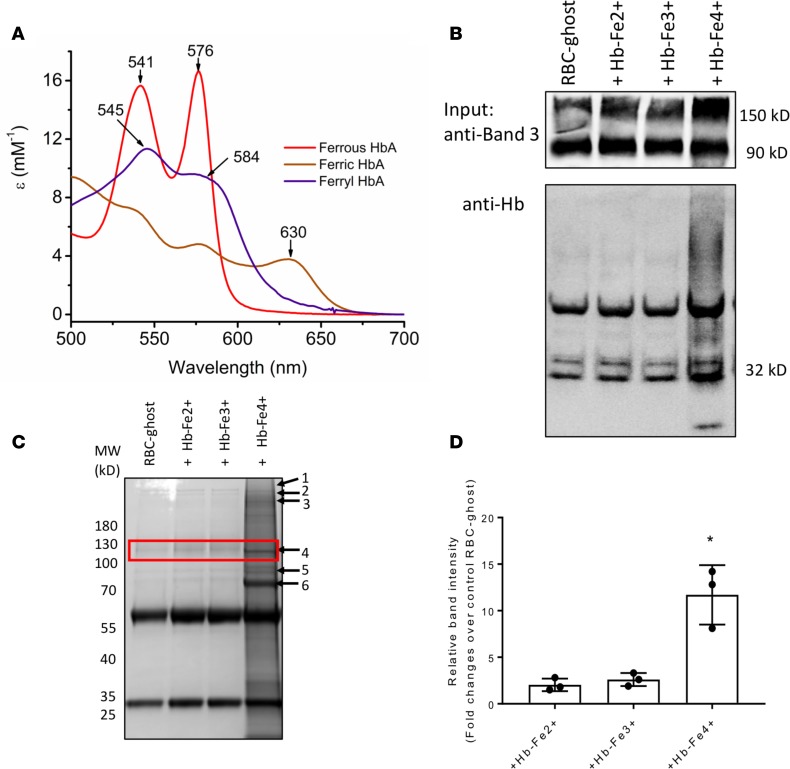
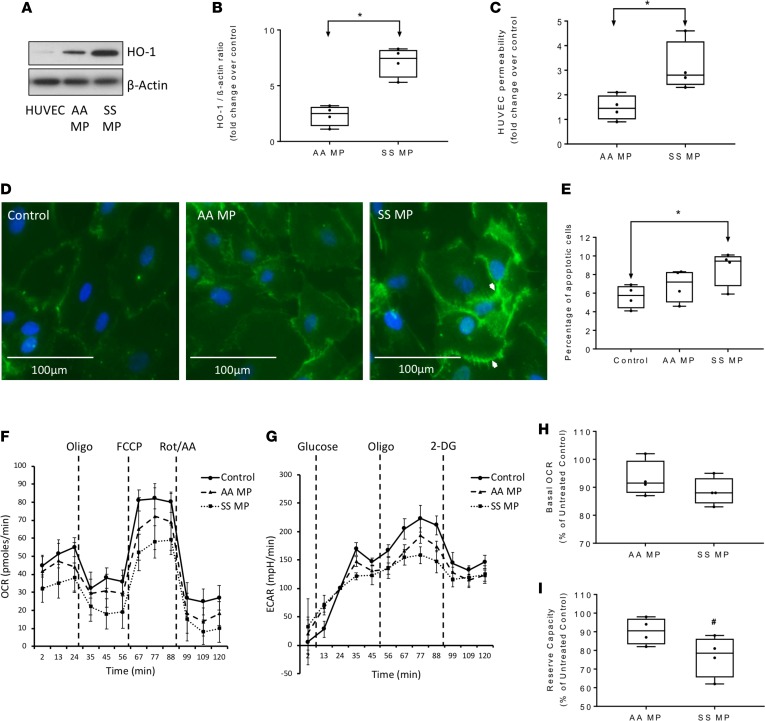
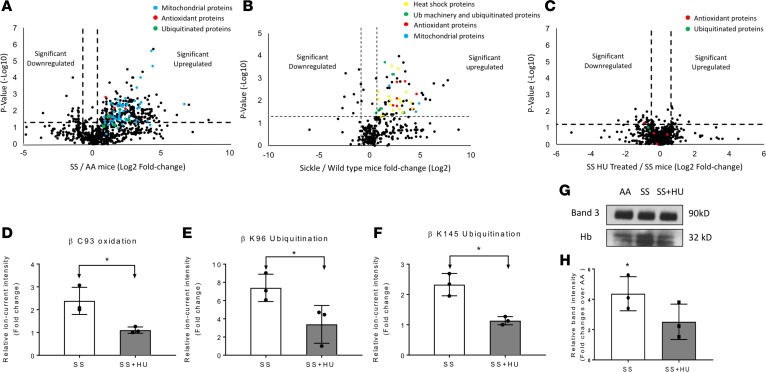
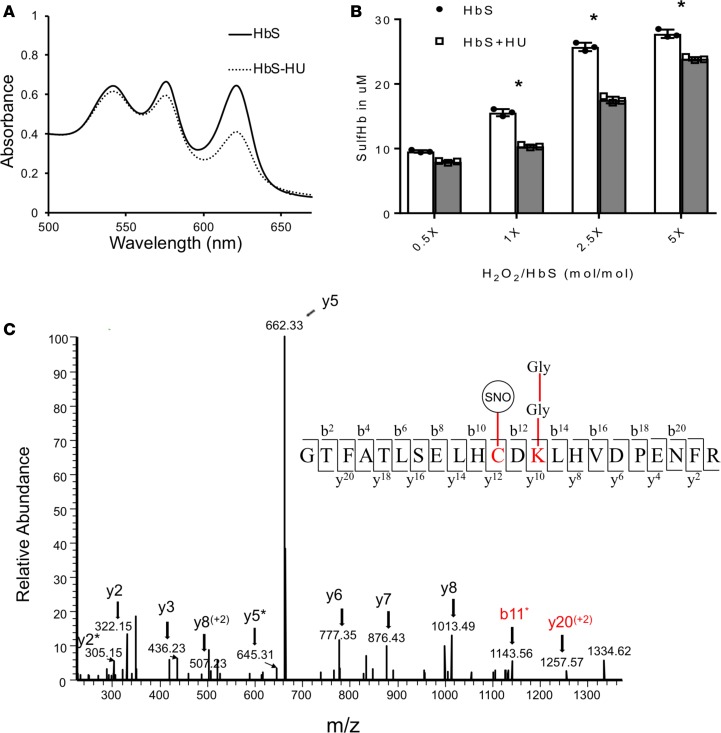
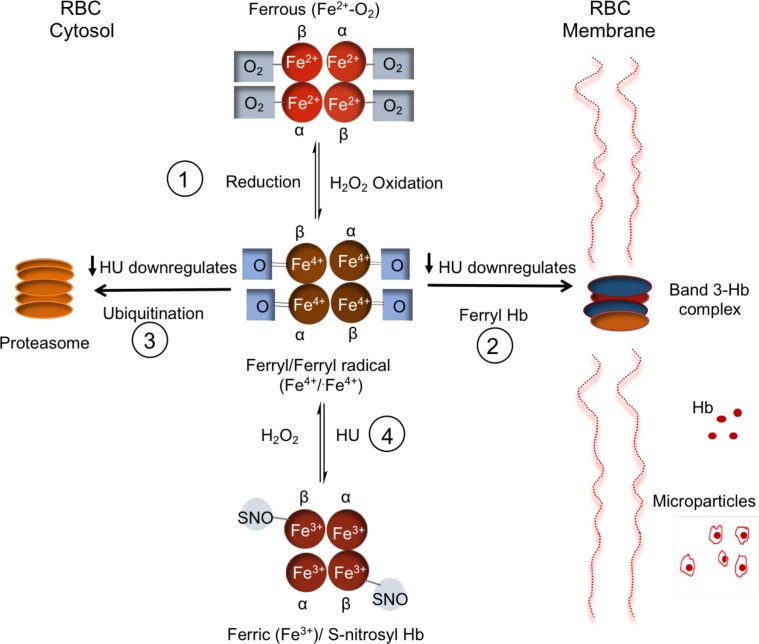
The contribution of intracellular hemoglobin (Hb) oxidation to RBC-derived microparticle (MP) formation is poorly defined in sickle cell disease (SCD). Here we report that sickle Hb (HbS) oxidation, coupled with changes in cytosolic antioxidative proteins, is associated with membrane alterations and MP formation in homozygous Townes-sickle cell (Townes-SS) mice. Photometric and proteomic analyses confirmed the presence of high levels of Hb oxidation intermediates (ferric/ferryl) and consequent β-globin posttranslational modifications, including the irreversible oxidation of βCys93 and the ubiquitination of βLys96 and βLys145. This is the first report to our knowledge to link the UPS (via ubiquitinated Hb and other proteins) to oxidative stress. Ferryl Hb also induced complex formation with band 3 and RBC membrane proteins. Incubation of Townes-SS MPs with human endothelial cells caused greater loss of monolayer integrity, apoptotic activation, heme oxygenase-1 induction, and concomitant bioenergetic imbalance compared with control Townes-AA MPs. MPs obtained from Townes-SS mice treated with hydroxyurea produced fewer posttranslational Hb modifications. In vitro, hydroxyurea reduced the levels of ferryl Hb and shielded its target residue, βCys93, by a process of S-nitrosylation. These mechanistic analyses suggest potential antioxidative therapeutic modalities that may interrupt MP heme-mediated pathophysiology in SCD patients.

Keywords: Cardiovascular disease; Hematology; Proteomics; Ubiquitin-proteosome system; Vascular Biology.


Conflict of interest statement

Conflict of interest: JDB and GMV receive research funding from CSL Behring.

Figures

Figure 1
Figure 1. Characterization of RBC-derived microparticles from Townes mice.
Representative transmission electron microscopic images showing Townes-AA (A) and Townes-SS RBC–derived (B and C) shear stress MPs of size ranging from 200 to 500 nm. Solid white arrows indicate dense protein aggregates within MPs. All images are representative of experiments repeated at least 3 times and obtained from different MP preparations. (D) Representative scatter plot shows quantification of PS+ MPs by flow cytometry using FITC-conjugated annexin V following calibration with standard silica beads. Scale bars: 500 nm (A); 200 nm (B and C).
Figure 2
Figure 2. Hemoglobin S within microparticles undergoes oxidation and oxidative changes.
Kinetic absorbance spectra of HbA control (A) and RBC MPs prepared from Townes-SS mice (B) (note: ferryl Hb spectrum is recognized by 2 new peaks at 545 and 584 nm and a flattened region between 500 and 700 nm). The samples were incubated for the indicated times in PBS at 37°C. Reverse-phase HPLC analyses of RBC MPs (AA and SS) before and after 36 hours of incubation (autoxidation) (C). The flow rate was 1 ml/min at 25°C. The eluate was monitored at 280 nm (for globin chains) and 405 nm (for heme). (D) Time course kinetics of metHb formation during autoxidation of HbA and HbS inside MPs prepared from AA and SS mice compared with free HbA samples, as determined spectrophotometrically during the 30-hour incubation. (E) Carbonylated protein content and (F) total lipid hydroperoxide content were measured in RBC MPs (n = 4). Upper horizontal line in box plots represents 75th percentile, lower horizontal line represents 25th percentile, and horizontal line within box represents mean value. Vertical error bars represent 95% confidence interval. Student’s t test, 2-tailed, *P < 0.05.
Figure 3
Figure 3. Changes in antioxidative proteins parallel hemoglobin S oxidation in microparticles.
(A) Individual plots represent mean ± SEM of relative abundance determined from summed ion current intensity values for each oxidative enzyme, representing AA and SS microparticles (n = 3) at 0- and 30-hour incubations (37°C); measurements were determined by peptide MS1 chromatogram intensities that were combined for each protein into protein-level data. (B and C) Volcano plots (0 and 30 hours) represent average relative fold differences determined by plotting P values (–log10) for each protein against the calculated fold change (log2) difference (of that protein) in SS MP relative to AA MP peptide MS1 chromatogram intensities that were combined for each protein into protein-level data. ub@ and phosphoserine@ refer to the posttranslational modifications ubiquitination and serine phosphorylation (at the specified amino acid position), respectively. All peptide-spectrum matches were obtained using a strict 1% protein FDR. P values were generated by applying a t test statistic to log2-transformed fold change values for each mouse biological condition. All points (for both volcano plots) on or above the horizontal line parallel to the x axis represent proteins with P values of 0.05 or lower. All points on or to the left of the first vertical line parallel to the y axis represent proteins that were downregulated in SS mice 1.5-fold or greater. All points on or to the right of the second vertical line parallel to the y axis represent proteins that were upregulated in SS mice 1.5-fold or greater. Bars represent average mean value; each dot in the bars represents an individual data point, and vertical error bars represent SEM. Student’s t test, 2-tailed, *P < 0.05 vs. corresponding AA 0-hour samples.
Figure 4
Figure 4. Mass spectrometric analysis of microparticles from sickle mice reveals amino acid posttranslational modifications.
MS/MS fragmentation spectra representing (A) y and b fragment ions matched to the Hb tryptic peptide GTFATSELHCDKLHVDPENFR (residues 83–104) containing cysteic acid (48 Da) at βCys93. (B) y and b ions matched to the Hb tryptic peptide GTFATSELHCDKLHVDPENFR containing the ubiquitin diglycine signature modification (114 Da) at βLys96. (C) y and b ions matched to the Hb tryptic peptide VVAGVANALAHKYHK (residues 335133–335145) containing the ubiquitin diglycine signature modification (114 Da) at βLys145.
Figure 5
Figure 5. Representations of amino acid posttranslational modifications reveal significant changes in both shear stress and circulating microparticles.
MS/MS fragmentation spectra were used to search for posttranslational modifications (PTMs) previously known to be associated with Hb oxidative stress. (AF) Relative ion current intensity fold changes corresponding to each Hb amino acid–specific PTM from AA and SS mouse shear stress and circulating microparticles (n = 3); measurements were determined by Hb peptide MS1 chromatogram intensities for each PTM. All peptide-spectrum matches were obtained using a strict 1% protein FDR. (G) Ubiquitinated proteins in AA and SS RBC lysates from 3 sets of mice were immunoprecipitated by protein G agarose beads using anti-ubiquitin antibody. (H) Ubiquitin bound Hb complex formation was analyzed using anti-Hbβ antibody. (I) Proteins present in the eluted immunoprecipitate were also resolved by SDS-PAGE and stained with Coomassie blue. Arrows represent Hbβ subunit. Bars represent average mean value; each dot in the bars represents an individual data point; and vertical error bars represent SEM. Student’s t test, 2-tailed, *P < 0.05 (n = 3).
Figure 6
Figure 6. Hemoglobin oxidation promotes complex formation with band 3.
Co-IP of band 3 was done and probed with anti-Hb antibody. (A) The absorbance spectra for the ferrous, ferric, and ferryl Hbs used in experiments. (B) Band 3-Hb complex formation in RBC ghost membrane was analyzed following in vitro incubation with different Hb oxidation states using a co-IP assay and immunoblotted using anti–band 3 and anti-Hb antibodies (lower panel). Upper panel: 90-kDa bands show equal band 3 loading; lower panel: Hb binding developed with anti-Hb antibody. Upper panel: 120-kDa bands indicate high molecular complex with band 3. (C) Eluted proteins from band 3 immunoprecipitates from RBC ghost membranes treated with or without Hb of different oxidation states were resolved by SDS-PAGE, followed by staining with Coomassie blue. The gel bands were further analyzed by LC-MS. Higher levels of membrane protein complexes were found in ferryl Hb–treated RBC ghost membranes (some of the major complexed proteins with Hb α or β subunits include [1] spectrin α; [2] spectrin β, spectrin α, Hbβ, band 3 anion transport protein, Hbα, ankyrin 1; [3] spectrin β isoform A, Hbβ, band 3 anion transport protein, Hbα, ankyrin 1; [4] band 3 anion transport protein, ankyrin 1; [5] erythrocyte membrane protein band 4.2, Hbβ subunit, band 3 anion transport protein, Hbα subunit; [6] Hbβ, and band 3 anion transport protein). All proteins were searched using Mascot and listed in order of Mascot score. (D) Plot representing relative band intensities measured from a specific area of Coomassie-stained gel (120-kDa region, denoted by the red box in C). The values in the graph represent average mean value of 3 independent observations, and each dot in the bars represents individual data points. Vertical error bars represent SEM. Student’s t test, 2-tailed, *P < 0.05 vs. control (n = 3).
Figure 7
Figure 7. Townes-SS RBC–derived microparticles promote toxicity in human endothelial cells.
(A) Oxidative toxicity in human umbilical vein endothelial cells (HUVECs) was assessed by expression of HO-1 protein. (B) Relative band intensity ratio representing expression of HO-1 normalized to corresponding β-actin level was measured using Bio-Rad Image Lab software (n = 4) (C) Loss of monolayer integrity in HUVECs exposed to Townes-AA or -SS RBC MPs for 12 hours, measured by passage of FITC-dextran through Transwell membranes (n = 4). (D) Representative fluorescence microscopic images of HUVEC endothelial membrane stained with anti–VE-cadherin (green) showing disruption of membrane integrity by SS MP treatment for 12 hours. (E) Number of apoptotic cells as quantified in HUVEC culture following 12 hours of incubation with SS or AA MPs by cell counter using annexin V and propidium iodide (n = 6). (F and G) Representative plots showing oxygen consumption rate (OCR) and extracellular acidification rate (ECAR) profiles in HUVECs obtained from extracellular flux analyzer following coincubation with either media (Control), Townes-AA MPs, or Townes-SS MPs for 12 hours. Data points represent average OCR/ECAR values of 6 similar wells. Following incubation with MPs, HUVEC were subjected to sequential automated injections of the ATP synthase blocker oligomycin (Oligo), oxidative phosphorylation uncoupler carbonyl cyanide 4-(trifluoromethoxy) phenylhydrazone (FCCP), and a cocktail of the mitochondrial respiration inhibitors rotenone and antimycin A (AA) to obtain the full OCR profile. For ECAR profile, a sequential injections of glucose, oligomycin (Oligo), 2-deoxy-d-glucose (2DG) were made. (H) Average basal OCR and (I) mitochondrial reserve capacity were calculated from 4 separate OCR plots (n = 4). #P < 0.05 vs. control. Upper horizontal line in box plots represent 75th percentile, lower horizontal line in represent 25th percentile, horizontal line within box represents mean value. Vertical error bars represent 95% confidence interval. Student’s t test, 2-tailed, *P < 0.05.
Figure 8
Figure 8. Hydroxyurea treatment reduces posttranslational modifications in microparticles.
A second proteomic comparative analysis including MPs derived from the blood of a set of AA, SS, and hydroxyurea-treated (HU-treated) SS mice (n = 3). (A) Volcano plots represent average relative fold differences determined by plotting P values (–log10) for each protein against the calculated fold change (log2) difference (of that protein) in SS relative to AA microparticle peptide MS1 chromatogram intensities that were combined for each protein into protein-level data. (B) Volcano plots represent average relative fold differences determined by plotting P values (–log10) for each protein against the calculated fold change (log2) difference (of that protein) in SS relative to AA RBC lysate peptide MS1 chromatogram intensities that were combined for each protein into protein-level data. (C) Volcano plots represent average relative fold differences determined by plotting P values (–log10) for each protein against the calculated fold change (log2) difference (of that protein) in HU-treated SS relative to SS microparticle peptide MS1 chromatogram intensities that were combined for each protein into protein-level data. All peptide-spectrum matches were obtained using a strict 1% protein FDR. P values were generated by applying a t test statistic to log2-transformed fold change values for each mouse biological condition. (DF) Relative ion current intensity fold changes corresponding to each Hb amino acid–specific PTM from HU-treated and untreated SS mouse shear stress MPs (n = 3); measurements were determined by Hb peptide MS1 chromatogram intensities for each PTM. All peptide-spectrum matches were obtained using a strict 1% protein FDR, and P values were generated by applying a t test statistic for each mouse biological condition. (G) Representative Western blot showing comparative Hb binding in immunoprecipitated band 3 elute of RBC MPs from AA, SS, and SS treated with HU. Top panel: equal loading in band 3 protein input. Lower panel: presence of Hbα protein in the band 3 immunoprecipitate elute. (H) Average band intensities of Hb in band 3 immunoprecipitate from AA, SS, and SS + HU MPs were measured using Bio-Rad Image Lab software and expressed as relative density following normalization with corresponding band 3 protein bands. Bars represent average mean value; each dot in the bars represents an individual data point; and vertical error bars represent SEM. Student’s t test, 2-tailed, *P < 0.05 (n = 3).
Figure 9
Figure 9. Hydroxyurea reduces ferryl heme and shields βCy93 by a process of S-nitrosylation.
Effects of HU on the levels of ferryl Hb (made with the addition of 150 μM H2O2). (A) Overlaid sulfHb spectra (absorption at 620 nm) of HbS (60 μM) treated (dashed line) and non-treated with HU (240 μM) (solid line). (B) Amounts of sulfHb produced at various ratios of H2O2 to Hb; nontreated HbS (solid black) and HU-treated (pattern). (C) MS/MS fragmentation spectrum representing the y and b ions matched to the modified tryptic peptide GTFATSELHCDKLHVDPENFR (residues 83–104) (residues 82–104) from Hb incubated with HU; this peptide contains the diglycine signature modification (at βLys96) associated with ubiquitination and S-nitrosylation (at βCys93). Bars represent average mean value; each dot in the bars represents an individual data point, and vertical error bars represent SEM. Student’s t test, 2-tailed, *P < 0.05 HbS vs. corresponding HbS + HU (n = 3).
Figure 10
Figure 10. Proposed erythrocyte internal oxidative changes that trigger membrane alternations and microparticle formation.
Oxidative reactions within RBCs include the following pathways: (1) Ferrous Hb (Fe2+) undergoes spontaneous oxidation (autoxidation) to form ferric Hb (Fe3+), and in the presence of H2O2 ferryl Hb (Fe4+) is formed when antioxidative mechanisms are compromised. Ferryl Hb undergoes oxidative changes including irreversible oxidation of βCys93 and ubiquitination of some lysine residues. Ferryl Hb can oxidatively target band 3, leading to complex formation and microparticle formation (2) or denaturation and proteasome degradation (3). Some ferryl Hbs revert back to ferric by a process of autoreduction (4). Hydroxyurea acts as an antioxidant by forming SNO-Hb at βCys93 by a process of S-nitrosylation, thereby minimizing the consequences of these processes (adapted with modification from ref. 23).

Comment in

References

    1. Hebbel RP. Ischemia-reperfusion injury in sickle cell anemia: relationship to acute chest syndrome, endothelial dysfunction, arterial vasculopathy, and inflammatory pain. Hematol Oncol Clin North Am. 2014;28(2):181–198. doi: 10.1016/j.hoc.2013.11.005. - DOI - PubMed
    1. Schaer DJ, Buehler PW, Alayash AI, Belcher JD, Vercellotti GM. Hemolysis and free hemoglobin revisited: exploring hemoglobin and hemin scavengers as a novel class of therapeutic proteins. Blood. 2013;121(8):1276–1284. doi: 10.1182/blood-2012-11-451229. - DOI - PMC - PubMed
    1. Camus SM, et al. Circulating cell membrane microparticles transfer heme to endothelial cells and trigger vasoocclusions in sickle cell disease. Blood. 2015;125(24):3805–3814. doi: 10.1182/blood-2014-07-589283. - DOI - PMC - PubMed
    1. Gizi A, et al. Assessment of oxidative stress in patients with sickle cell disease: the glutathione system and the oxidant-antioxidant status. Blood Cells Mol Dis. 2011;46(3):220–225. doi: 10.1016/j.bcmd.2011.01.002. - DOI - PubMed
    1. Chirico EN, Pialoux V. Role of oxidative stress in the pathogenesis of sickle cell disease. IUBMB Life. 2012;64(1):72–80. doi: 10.1002/iub.584. - DOI - PubMed

Publication types

MeSH terms