Comparative Study
. 2018 Nov 2;3(21):e122264.
doi: 10.1172/jci.insight.122264.

Global immune fingerprinting in glioblastoma patient peripheral blood reveals immune-suppression signatures associated with prognosis

Affiliations
Comparative Study

Global immune fingerprinting in glioblastoma patient peripheral blood reveals immune-suppression signatures associated with prognosis

Tyler J Alban et al. JCI Insight. .

Abstract

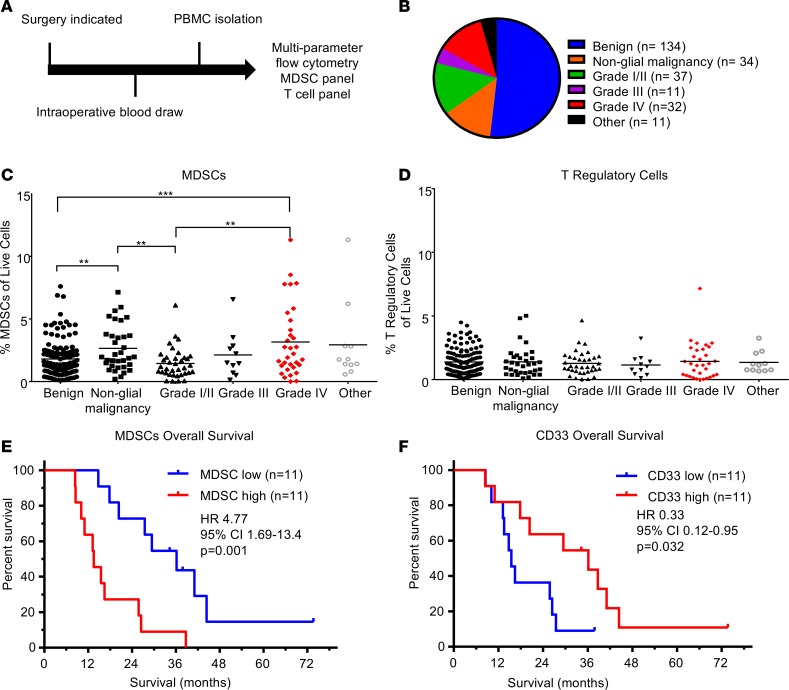
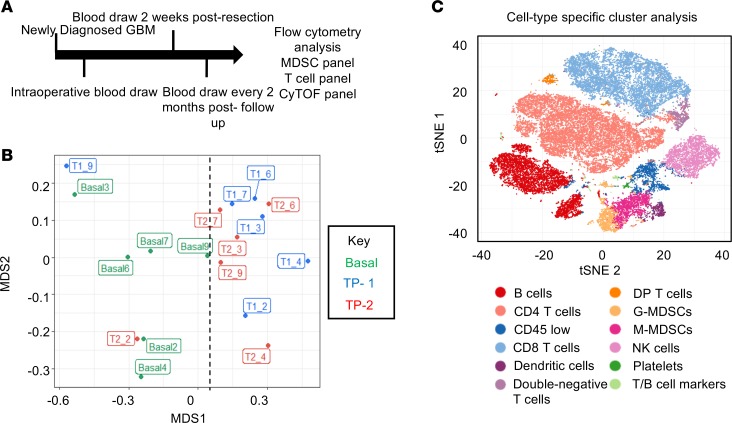
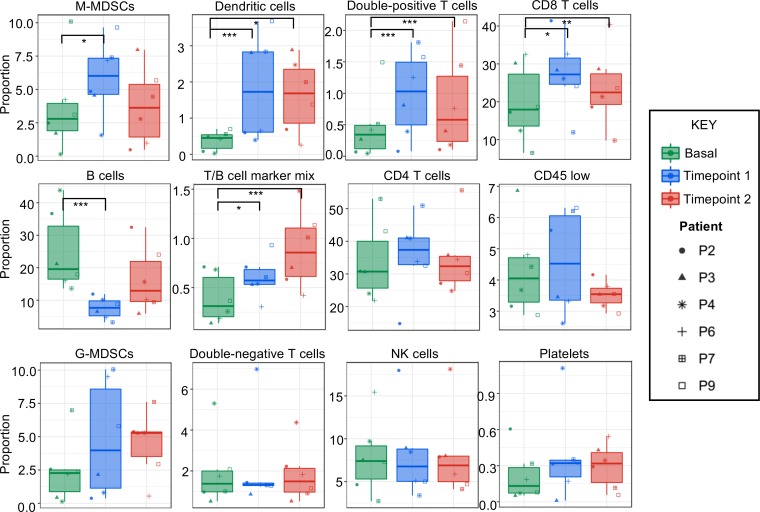
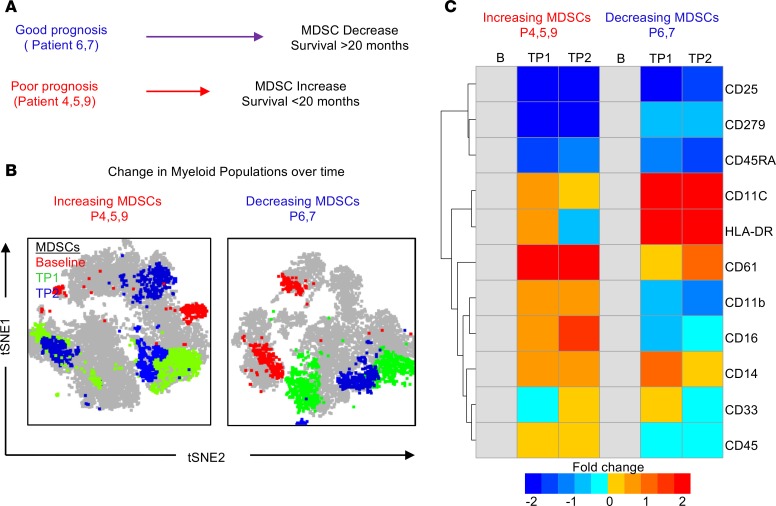
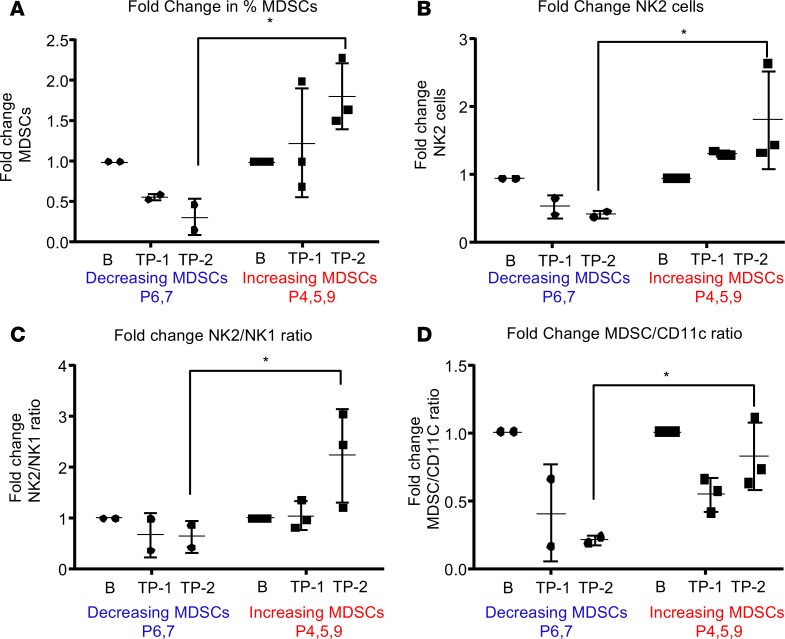
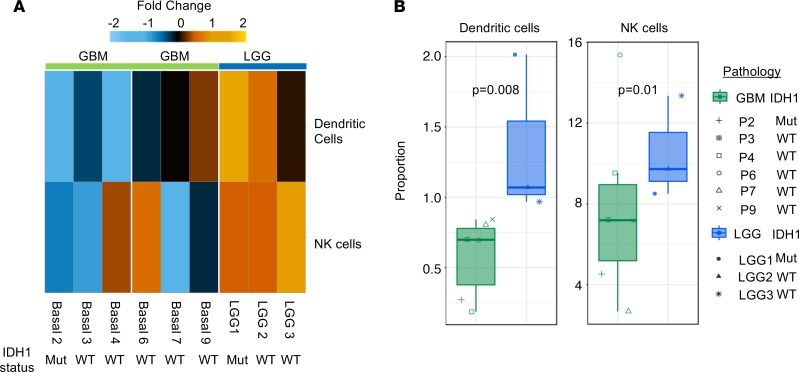
Glioblastoma (GBM) remains uniformly lethal, and despite a large accumulation of immune cells in the microenvironment, there is limited antitumor immune response. To overcome these challenges, a comprehensive understanding of GBM systemic immune response during disease progression is required. Here, we integrated multiparameter flow cytometry and mass cytometry TOF (CyTOF) analysis of patient blood to determine changes in the immune system among tumor types and over disease progression. Utilizing flow cytometry analysis in a cohort of 259 patients ranging from benign to malignant primary and metastatic brain tumors, we found that GBM patients had a significant elevation in myeloid-derived suppressor cells (MDSCs) in peripheral blood but not immunosuppressive Tregs. In GBM patient tissue, we found that increased MDSC levels in recurrent GBM portended poor prognosis. CyTOF analysis of peripheral blood from newly diagnosed GBM patients revealed that reduced MDSCs over time were accompanied by a concomitant increase in DCs. GBM patients with extended survival also had reduced MDSCs, similar to the levels of low-grade glioma (LGG) patients. Our findings provide a rationale for developing strategies to target MDSCs, which are elevated in GBM patients and predict poor prognosis.

Keywords: Brain cancer; Cancer immunotherapy; Immunology; Oncology.


Conflict of interest statement

Conflict of interest: The authors have declared that no conflict of interest exists.

Figures

Figure 1
Figure 1. Patient analysis identifies peripheral and tumoral MDSCs associated with glioma grade and patient prognosis.
(A) Experimental design: patients entering the clinic for surgical resection were consented, and a blood sample was acquired intraoperatively. Subsequently, PBMCs were isolated via Ficoll-Paque gradient within 24 hours before being frozen in freezing media for future use. (B) Pie chart with the distribution of patient samples totaling n = 259 patients analyzed. (C and D) Analysis of immunosuppressive M-MDSCs and Tregs via multiparameter flow cytometry analysis, where individual unpaired 2-tailed Student’s t tests were used and then corrected with Benjamini-Hochberg method (horizontal lines represent mean values, **P < 0.01, ***P < 0.001). (E) Kaplan-Meier analysis of patients separated by median levels of MDSC signal in the CD33+ area demonstrates decreased survival (P = 0.001). Statistical significance evaluated by log-rank analysis (n = 22). (F) Kaplan-Meier analysis of patients divided by median CD33 levels identifies increased overall survival using log-rank test (P = 0.032, n = 22).
Figure 2
Figure 2. Mass cytometry analysis of GBM patients over time reveals immune shifts from baseline that are not common across all patients.
(A) Schematic representation of the patient cohort consisting of n = 6 glioblastoma patients followed over time, with blood collection and storage for analysis via multiparameter flow cytometry and CyTOF. (B) Multidimensional scaffold plot representing 6 patients at 3 time points each (baseline, time point 1, and time point 2). The first number represents the time point and the second represents the patient. Dotted line represents the division between baseline samples and later time point samples. (C) tSNE plot identifies 30 unique populations that are color coded among the 6 patient samples across all time points, representing a total of 18 samples.
Figure 3
Figure 3. CyTOF identifies immune cell populations that are significantly altered during disease progression.
Using 12 immune cell populations that were identified in an unbiased manner from baseline (green), time point 1 (blue), and time point 2 (red) samples for n = 6 newly diagnosed GBM patients were examined via 2-tailed Student’s t test to compare baseline to time points 1 and 2. Each patient is indicated by the symbol identified in the key to the right. Statistics were determined by comparing baseline to each time point using linear models of the data with 2-tailed t test comparisons and Benjamini-Hochberg to adjust to control for multiple comparisons. *P < 0.05, ** P < 0.001, ***P < 0.0001. Graphs represent data sets as median with first and third quartiles.
Figure 4
Figure 4. In-depth CyTOF analysis of patients with differing prognoses identifies shifts in MDSCs and other immune populations.
(A) Schematic representation of the 2 groups used for in-depth manual gating analysis (patients 6 and 7 vs. patients 4, 5, and 9). Patients 6 and 7 had a good prognosis (survival >20 months after diagnosis) and decreasing MDSCs as identified by flow cytometry, while patients 4, 5, and 9 had a poor prognosis (survival <20 months after diagnosis) and increasing MDSCs as identified by flow cytometry. (B) tSNE analysis of CD33+ myeloid cells over time at baseline, time point 1, and time point 2, where manually gated myeloid cells were overlaid and colored according to their time points (baseline, red; time point 1, green; time point 2, blue). (C) Myeloid cells of patients in both groups were examined for fold change in myeloid markers from baseline using the CyTOF panel.
Figure 5
Figure 5. DCs and antigen-presenting cells are increased in a patient with a good prognosis.
(A–D) Manual gating of MDSCs, NK2, NK1, and DC populations from the decreasing MDSCs group and the increasing MDSCs group at baseline (B), time point 1 (1), and time point 2 (2), where B is baseline, 1 is 2 months after diagnosis, and 2 is the final time point collected. Graphs represent data as mean ± SD.
Figure 6
Figure 6. Compared with LGG patients, GBM patients have reduced antigen-presenting cells and NK cells, which is indicative of a reduced antitumoral response.
(A) Unbiased clustering of CyTOF data identifies NK cells and DCs as different between patients with LGG (n = 3) and GBM (n = 6) at baseline as organized by hierarchical clustering. (B) Quantification of NK cells and DCs in 6 GBM patients and 3 LGG patients at baseline using the t test. Graphs represent data sets as median with first and third quartiles.

References

    1. Stupp R, et al. Effects of radiotherapy with concomitant and adjuvant temozolomide versus radiotherapy alone on survival in glioblastoma in a randomised phase III study: 5-year analysis of the EORTC-NCIC trial. Lancet Oncol. 2009;10(5):459–466. doi: 10.1016/S1470-2045(09)70025-7. - DOI - PubMed
    1. Farkona S, Diamandis EP, Blasutig IM. Cancer immunotherapy: the beginning of the end of cancer? BMC Med. 2016;14:73. - PMC - PubMed
    1. Lim M, Xia Y, Bettegowda C, Weller M. Current state of immunotherapy for glioblastoma. Nat Rev Clin Oncol. 2018;15(7):422–442. doi: 10.1038/s41571-018-0003-5. - DOI - PubMed
    1. Peggs KS, Quezada SA. Ipilimumab: attenuation of an inhibitory immune checkpoint improves survival in metastatic melanoma. Expert Rev Anticancer Ther. 2010;10(11):1697–1701. doi: 10.1586/era.10.144. - DOI - PubMed
    1. Yang I, et al. CD8+ T-cell infiltrate in newly diagnosed glioblastoma is associated with long-term survival. J Clin Neurosci. 2010;17(11):1381–1385. doi: 10.1016/j.jocn.2010.03.031. - DOI - PMC - PubMed

Publication types

MeSH terms