. 2018 Nov 2;3(21):e95076.
doi: 10.1172/jci.insight.95076.

Role of Alström syndrome 1 in the regulation of blood pressure and renal function

Affiliations

Role of Alström syndrome 1 in the regulation of blood pressure and renal function

Ankita Bachhawat Jaykumar et al. JCI Insight. .

Abstract

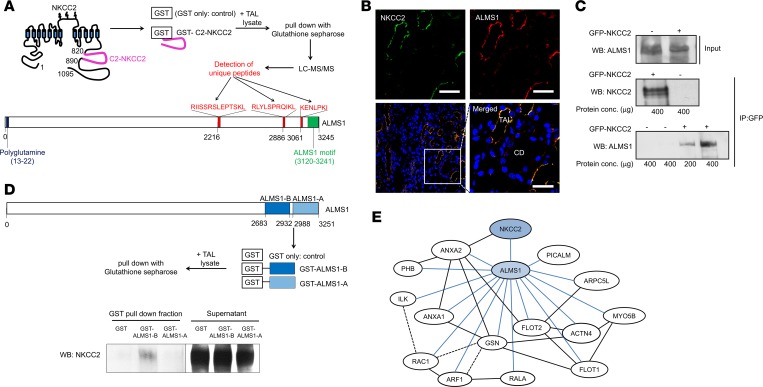
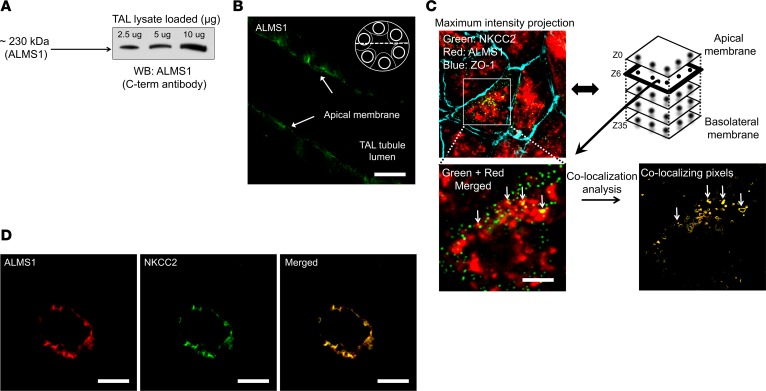
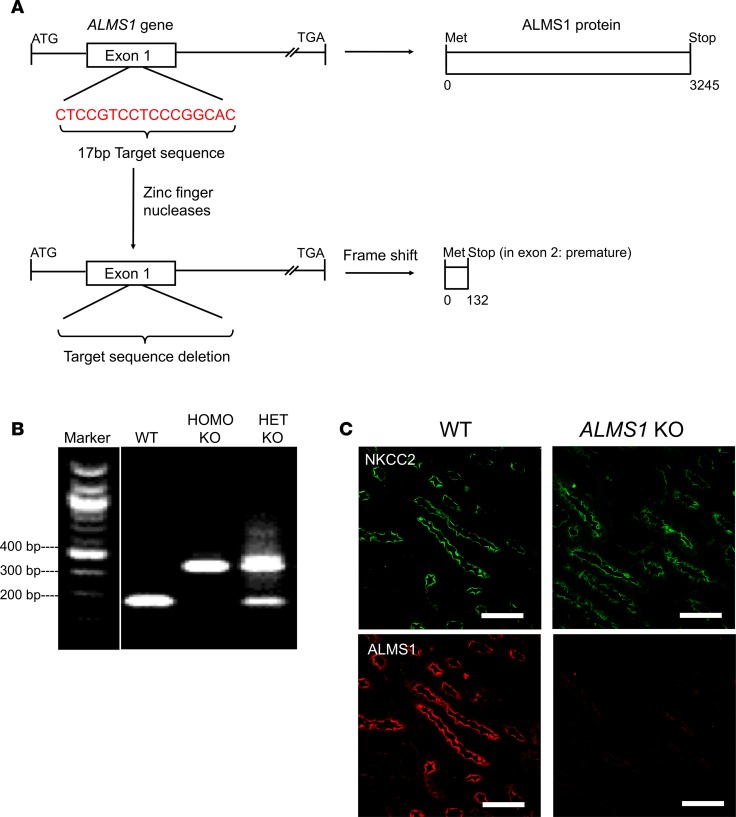
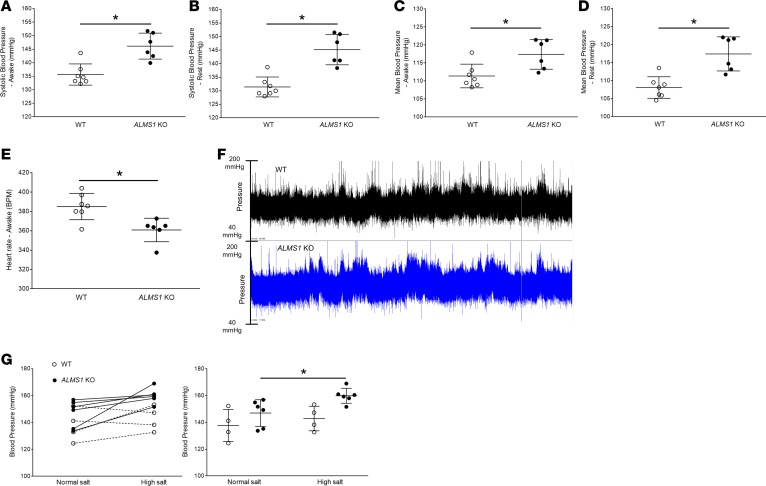
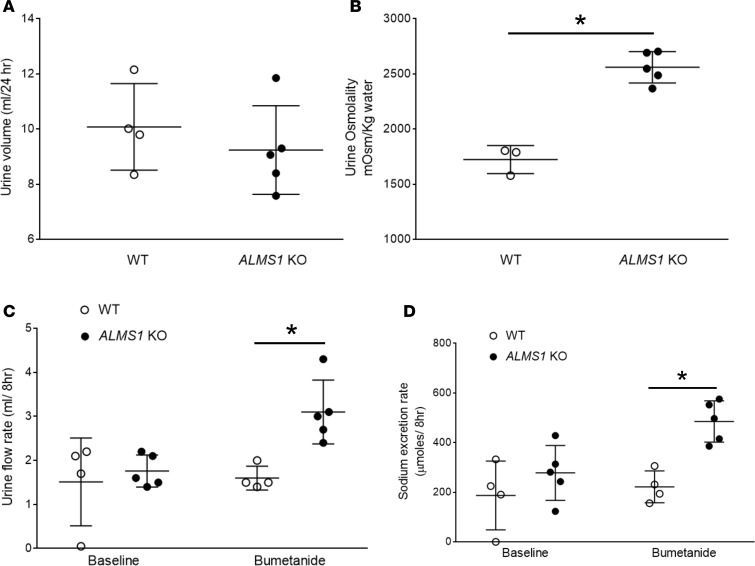
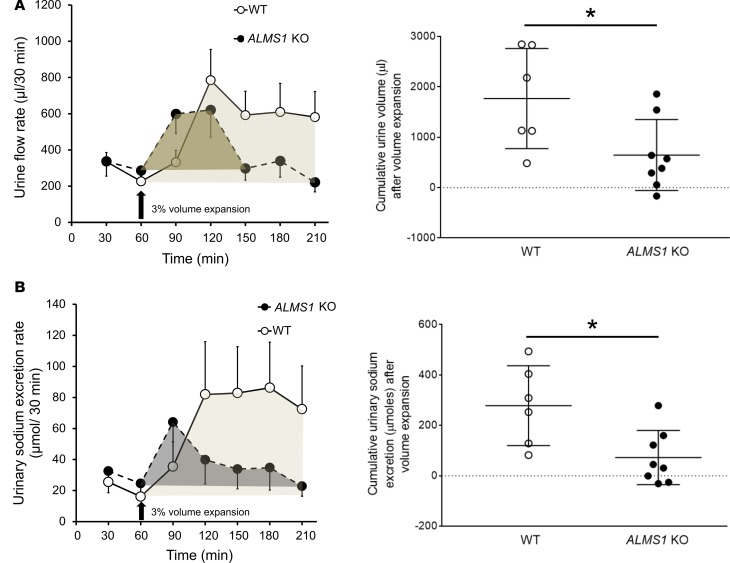
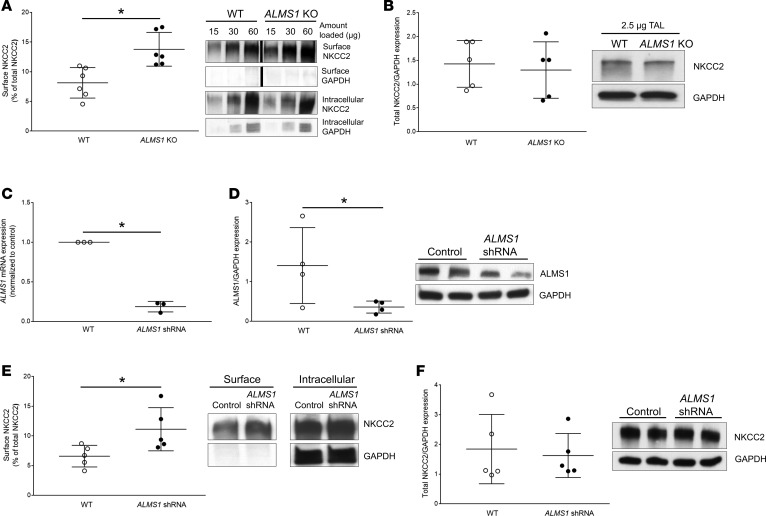
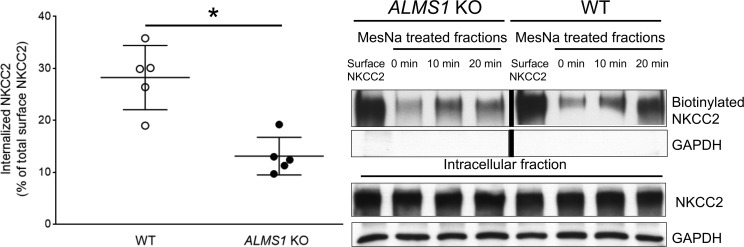
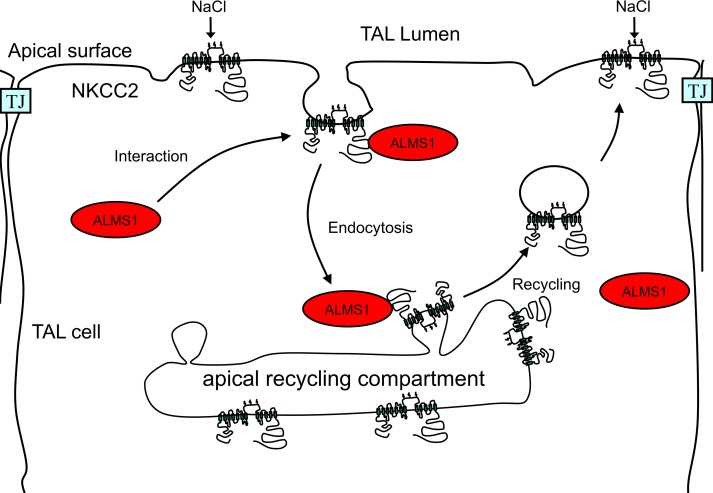
Elevated blood pressure (BP) and renal dysfunction are complex traits representing major global health problems. Single nucleotide polymorphisms identified by genome-wide association studies have identified the Alström syndrome 1 (ALMS1) gene locus to render susceptibility for renal dysfunction, hypertension, and chronic kidney disease (CKD). Mutations in the ALMS1 gene in humans causes Alström syndrome, characterized by progressive metabolic alterations including hypertension and CKD. Despite compelling genetic evidence, the underlying biological mechanism by which mutations in the ALMS1 gene lead to the above-mentioned pathophysiology is not understood. We modeled this effect in a KO rat model and showed that ALMS1 genetic deletion leads to hypertension. We demonstrate that the link between ALMS1 and hypertension involves the activation of the renal Na+/K+/2Cl- cotransporter NKCC2, mediated by regulation of its endocytosis. Our findings establish a link between the genetic susceptibility to hypertension, CKD, and the expression of ALMS1 through its role in a salt-reabsorbing tubular segment of the kidney. These data point to ALMS1 as a potentially novel gene involved in BP and renal function regulation.

Keywords: Cell Biology; Chronic kidney disease; Epithelial transport of ions and water; Protein traffic.


Conflict of interest statement

Conflict of interest: The authors have declared that no conflict of interest exists.

Figures

Figure 1
Figure 1. Interaction of ALMS1 with C2-NKCC2.
(A) Representation of C2-NKCC2 domain (pink) and unique peptides corresponding to ALMS1 (red) picked up by liquid chromatography–mass spectrometry in glutathione-s-transferase (GST) pull-down assay using GST-carboxyl-terminus of NKCC2 fusion protein (GST-C2-NKCC2) or GST alone (control) as baits in rat thick ascending limb (TAL) lysates. (B) Immunofluorescent labeling for NKCC2 (green) and ALMS1 (red) in paraffin embedded rat kidney sections, indicating expression and colocalization of NKCC2 and ALMS1 in rat TAL. CD, collecting duct; n = 3. Scale bars: 20 μm. (C) Representative Western blot for immunoprecipitation of ALMS1 with NKCC2 in NRK 52E cells transduced with EGFP or EGFP-NKKC2 adenovirus construct; n = 3. (D) Western blot representing GST pull down of full-length NKCC2 with GST-truncated carboxyl-terminus ALMS1 fusion protein B (GST-C-ALMS1 B) as bait in rat TAL lysates; n = 3. The lanes were run on the same gel but were noncontiguous and contrast changed on the supernatant fraction for visualization of discrete protein bands. (E) Recreated IPA of protein-to-protein interactions identified in GST pull-down assay with GST-carboxyl-terminus ALMS1 fusion proteins A/B (GST-C-ALMS1 A/B) in rat TAL lysates detected by liquid chromatography–mass spectrometry; n = 1. Solid and broken lines in black indicate direct and indirect protein interactions from IPA, respectively. Solid blue lines indicate protein interactions from mass spectrometry analysis of C-ALMS1 A/B pull-down protein fraction. RAC1, ras-related C3 botulinum toxin substrate 1; FLOT1, flotillin 1; ANXA2, annexin A2; PICALM, phosphatidyl inositol binding clathrin assembly protein; ARPC5L, actin related protein 2/3 complex subunit 5–like; RALA, ras like proto-oncogene A; ARF1, ADP ribosylation factor 1; ILK, integrin linked kinase; PHB, prohibitin; ACTN4, α-actinin 4; MYO5B, myosin 5b; GSN, gelsolin. Respective roles of these proteins in regulating endocytosis are defined in Supplemental Table 1.
Figure 2
Figure 2. Expression and colocalization of ALMS1 and NKCC2 in rat TAL.
(A) Representative immunoblot of ALMS1 indicating ALMS1 protein expression in rat thick ascending limb (TAL) corresponding to 230 kDa protein; n = 4. (B) Representative image for immunofluorescent labeling of ALMS1 in isolated, perfused TAL, indicating apical and subapical vesicular localization of ALMS1 by confocal imaging in a cross-section of TAL; n = 3. Scale bars: 5 μm. (C) Representative image for immunofluorescent labeling of NKCC2 and ALMS1 in rat TAL primary cultured cells; n = 3. NKCC2 (green); ALMS1 (red); tight junction protein zonula occludens 1 (blue). Merged image from a subapical plane (1.5 μm from the apical plane) showing overlap of internalized NKCC2 and ALMS1 indicated with an arrow. Scale bars: 5 μm. (D) Representative image for immunofluorescent labeling of NKCC2 (green) and ALMS1 (red) in a single TAL cross-section obtained from perfusion-fixed rat kidney slices (n = 4). Scale bars: 10 µm.
Figure 3
Figure 3. Generation of ALMS1-KO rats and their genotyping.
(A) Scheme showing deletion of 17-bp sequence from exon 1 of ALMS1 gene by zinc finger nucleases leading to premature stop codon in exon 2, resulting in KO of ALMS1 in rats. (B) PCR using exon 1–specific primers, followed by Nci1 restriction enzyme digestion, generated 365 bp fragment in homozygous KO and 181 bp and 201 bp fragments in WT and all the above fragments in heterozygous KO. The lanes were run on the same gel but were noncontiguous. (C) Representative image for immunofluorescent labeling of ALMS1 (red) and NKCC2 (green) in paraffin embedded rat kidney sections, indicating KO of ALMS1 in ALMS1-KO rat in rat TAL; n = 3. Scale bars: 30 μm.
Figure 4
Figure 4. Hypertension in ALMS1-KO rats.
(A) On a normal salt diet, systolic blood pressure (SBP) measurement by radiotelemetry in awake rats indicated ALMS1-KO rats are hypertensive (SBP ALMS1-KO, 146.1 ± 2 mmHg, n = 6, vs. WT, 135.6 ± 1.5 mmHg, n = 7; *P < 0.001). (B) Systolic blood pressure measurement by radiotelemetry indicated that ALMS1-KO rats are hypertensive during their rest period (SBP ALMS1-KO, 145.2 ± 2.3 mmHg, n = 6, vs. WT, 131.4 ± 1.6 mmHg, n = 7; *P < 0.005). (C) Mean blood pressure (MBP) measured by radiotelemetry in awake rats indicated a higher MBP in ALMS1-KO rats (MBP ALMS1-KO, 117.4 ± 1.7 mmHg, n = 6, vs. WT, 111.4 ± 1.3 mmHg, n = 7; *P < 0.01). (D) Mean blood pressure (MBP) measured by radiotelemetry in rats indicated higher MBP in ALMS1-KO during their rest period (MBP ALMS1-KO, 117.4 ± 2 mmHg, n = 6, vs. WT, 108.1 ± 1.3 mmHg, n = 7; *P < 0.01). (E) Heart rate (HR) measured in awake rats indicated a lower HR in ALMS1-KO rats (HR ALMS1-KO, 360.8 ± 5.2 bpm, n = 6, vs. WT, 385 ± 5.6 bpm, n = 7; *P < 0.01). (F) Representative 24-hour telemetry tracing for 1 WT and ALMS1-KO rat fed with normal salt diet. (G) Systolic blood pressure measurement in awake rats during normal salt (NS) intake and after 7 days on high salt (HS) intake (NS ALMS1-KO, 149.7 ± 4.76 mmHg, vs. HS ALMS1-KO, 162.86 ± 3.82 mmHg, n = 6; *P < 0.05) and (NS WT, 137 ± 5.2 mmHg, n = 6, vs. HS WT, 142.5 ± 4 mmHg, n = 4). Both graphs are different representations of the same data set. Values represent mean ± SEM, and statistical analysis was performed with Student’s 2-tailed t test and 2-way ANOVA (salt sensitivity).
Figure 5
Figure 5. ALMS1-KO rats have higher NKCC2-mediated NaCl absorption in thick ascending limb (TAL).
(A) Twenty-four–hour urine volume collected by placing the rats in metabolic cages was not different between the groups (ALMS1-KO, 9.24 ± 0.72 ml, n = 5, vs. WT, 10.08 ± 0.78 ml, n = 4). (B) Urine osmolality measured in 24-hour urine collected sample was higher in ALMS1-KO rats (ALMS1-KO, 2,560 ± 63.4 mOsm/kg water, n = 5, vs. WT, 1,724 ± 73.1 mOsm/kg water, n = 3; *P < 0.005). (C) Urine volume measured 8 hours after 5 mg/kg bumetanide (submaximal dose) treatment was higher in ALMS1-KO rats (ALMS1-KO, 3.1 ± 0.32 ml/8 hours, n = 5, vs. WT, 1.6 ± 0.13 ml/8 hours, n = 4; *P < 0.025 vs. WT). (D) Urinary sodium excretion measured 8 hours after 5 mg/kg bumetanide treatment was higher in ALMS1-KO rats (ALMS1-KO, 485.2 ± 37.1 μmoles/8 hours, n = 5, vs. WT, 221.8 ± 32 μmoles/8 hours, n = 4; *P < 0.025 vs. WT). Values represent mean ± SEM, and statistical analysis was performed with 2-tailed Student’s t test and 2-way ANOVA.
Figure 6
Figure 6. Urinary excretory capacity in response to volume/ salt load with isotonic saline is decreased in ALMS1-KO rats.
(A) Cumulative urine volume (adjusted to baseline) upon 3% volume expansion measured between time points 60 and 210 minutes was decreased in ALMS1-KO rats (ALMS1-KO, 0.7 ± 0.24 ml, n = 8, vs. WT: 1.77 ± 0.4 ml, n = 6; *P < 0.05). (B) Cumulative urinary sodium excretion (adjusted to baseline) upon 3% volume expansion measured between time points 60 and 210 minutes was decreased in ALMS1-KO rats (ALMS1-KO, 72.5 ± 37.9 μmoles, n = 8, vs. WT, 278.4 ± 64.5 μmoles, n = 6; *P < 0.05). Values represent mean ± SEM, and post hoc statistical analysis was performed using the Bonferroni correction for multiple comparisons and 2-tailed Student’s t test.
Figure 7
Figure 7. Surface NKCC2 expression is higher in TALs from ALMS1-deleted rats.
(A) NKCC2 surface fraction in thick ascending limbs (TALs) from ALMS1-KO rats was higher (ALMS1-KO, 13.8% ± 1.2%, vs. WT, 8.1% ± 1.1%, n = 6;*P < 0.05). The lanes were run on the same gel but were noncontiguous. (B) Total NKCC2 expression normalized by the housekeeping control protein GAPDH in TALs from WT and ALMS1-KO rats was similar (normalized value ALMS1-KO, 0.88 ± 0.07, vs. WT, 1, n = 5). (C) ALMS1 mRNA expression in TALs from normal Sprague Dawley rats measured 7 days after in vivo transduction of ALMS1 shRNA in rat outer medulla was decreased compared with control (normalized value ALMS1 shRNA, 0.19 ± 0.04, vs. control, 1, n = 3; *P < 0.01). (D) ALMS1 protein expression normalized to GAPDH (different exposure) in TALs from normal Sprague Dawley rats measured 7 days after in vivo transduction of ALMS1 shRNA was decreased, indicating effective knock down of ALMS1 in rat outer medulla (normalized value ALMS1 shRNA, 0.39 ± 0.2, vs. control, 1, n = 4; *P < 0.05). (E) Surface NKCC2 expression measured by surface biotinylation in TALs from normal Sprague Dawley rat kidney transduced with ALMS1 shRNA was enhanced compared with kidney injected with control (ALMS1 shRNA, 11.1% ± 1.6%, vs. control, 6.6% ± 0.8%, n = 5; *P < 0.05). (F) Total NKCC2 expression normalized to GAPDH in TALs from normal Sprague-Dawley rat kidney transduced with ALMS1 shRNA was similar to control injected kidney (normalized value ALMS1 shRNA, 0.93 ± 0.07, vs. control, 1; n = 5). Values represent mean ± SEM, and statistical analysis was performed with 2-tailed Student’s t test.
Figure 8
Figure 8. NKCC2 endocytosis is decreased in TALs from ALMS1-KO rats.
Representative Western blot shows a lower internalized NKCC2 fraction after warming the thick ascending limbs (TALs) from ALMS1-KO at 37°C for 20 minutes. NKCC2 endocytosis measured as a percent of total surface NKCC2 was lower in TALs from ALMS1-KO rats (ALMS1-KO, 13.1% ± 1.4%, vs. WT, 28.2% ± 2.8% after 20 minutes, n = 5; *P < 0.05). The WT and ALMS1-KO surface NKCC2 lanes were run on the same gel but were noncontiguous. Values represent mean ± SEM, and statistical analysis was performed with 2-tailed Student’s t test.
Figure 9
Figure 9. Working model.
Diagrammatic representation of the role of ALMS1 in endocytosis of NKCC2. At some point of the endocytic process, the carboxyl terminus of ALMS1 (C-ALMS1) interacts with the C2-terminus of NKCC2 (C2-NKCC2) to accelerate its endocytosis and regulate NKCC2 levels at the apical surface.

Comment in

  • ALMS1-NKCC2 interactions.
    Allison SJ. Allison SJ. Nat Rev Nephrol. 2019 Feb;15(2):62. doi: 10.1038/s41581-018-0084-5. Nat Rev Nephrol. 2019. PMID: 30443014 No abstract available.

References

    1. et al. Multiple new loci associated with kidney function and Chronic Kidney Disease: The CKDGen consortium. Nat Genet. 2010;42(5):376–384. doi: 10.1038/ng.568. - DOI - PMC - PubMed
    1. Chambers JC, et al. Genetic loci influencing kidney function and chronic kidney disease. Nat Genet. 2010;42(5):373–375. doi: 10.1038/ng.566. - DOI - PMC - PubMed
    1. Böger CA, et al. Association of eGFR-Related Loci Identified by GWAS with Incident CKD and ESRD. PLoS Genet. 2011;7(9):e1002292. doi: 10.1371/journal.pgen.1002292. - DOI - PMC - PubMed
    1. Barkley RA, et al. Positional identification of hypertension susceptibility genes on chromosome 2. Hypertension. 2004;43(2):477–482. doi: 10.1161/01.HYP.0000111585.76299.f7. - DOI - PubMed
    1. Collin GB, et al. The Alström syndrome protein, ALMS1, interacts with α-actinin and components of the endosome recycling pathway. PLoS One. 2012;7(5):e37925. doi: 10.1371/journal.pone.0037925. - DOI - PMC - PubMed

Publication types

MeSH terms