Clinical Trial
. 2018 Nov 2;3(21):e99470.
doi: 10.1172/jci.insight.99470.

Dietary protein restriction reduces circulating VLDL triglyceride levels via CREBH-APOA5-dependent and -independent mechanisms

Affiliations
Clinical Trial

Dietary protein restriction reduces circulating VLDL triglyceride levels via CREBH-APOA5-dependent and -independent mechanisms

J Humberto Treviño-Villarreal et al. JCI Insight. .

Abstract

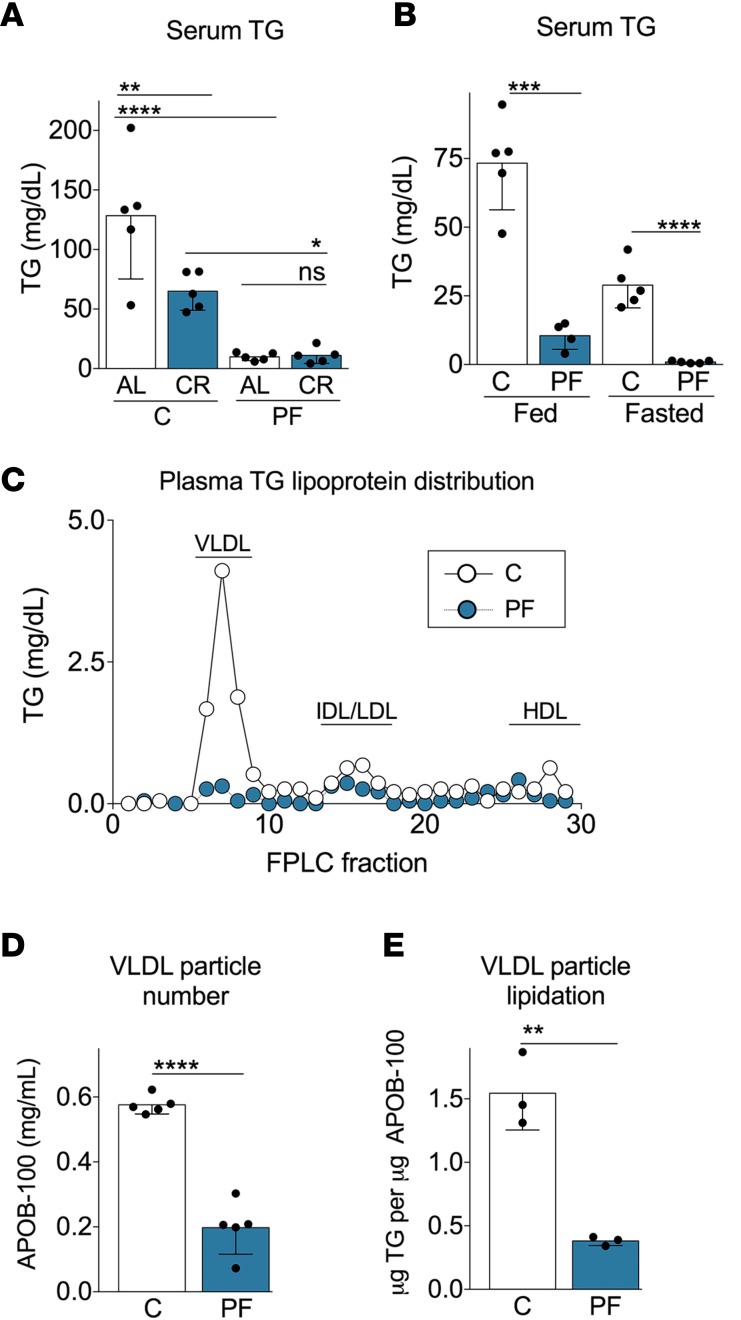
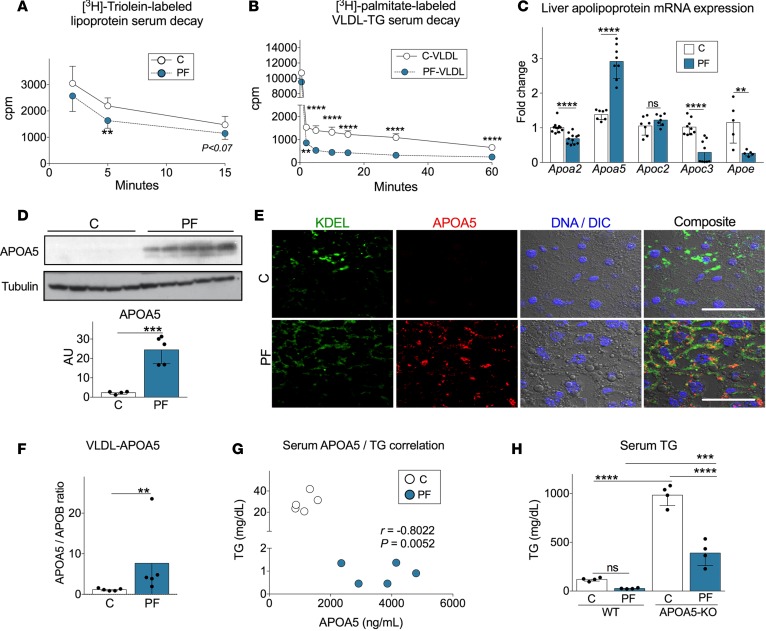
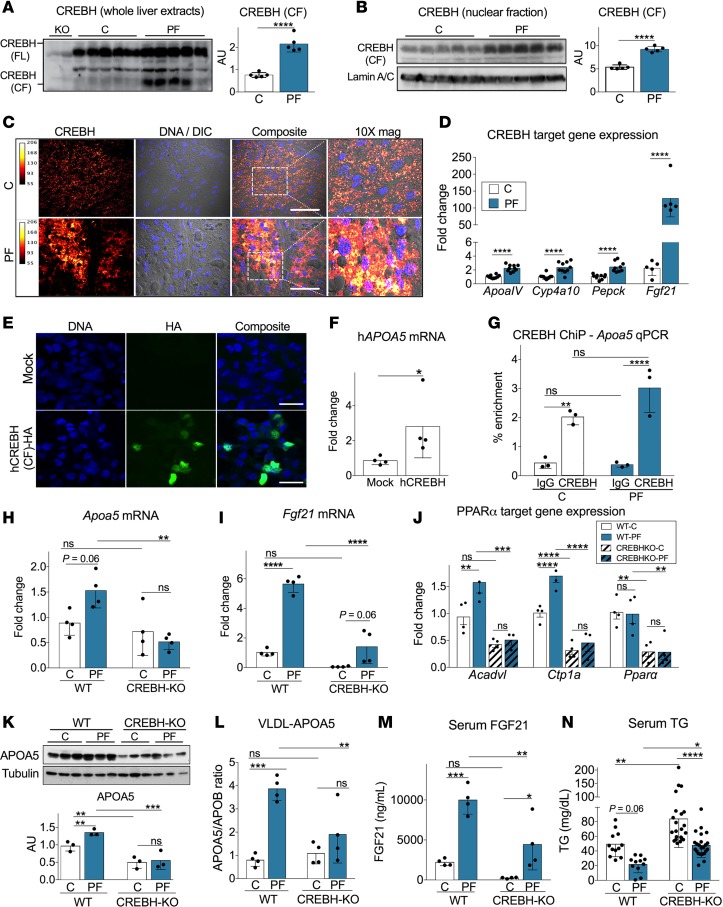
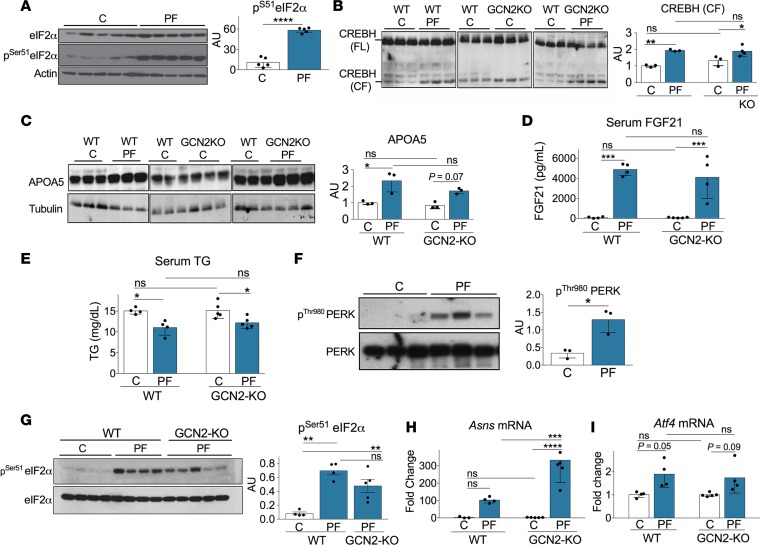
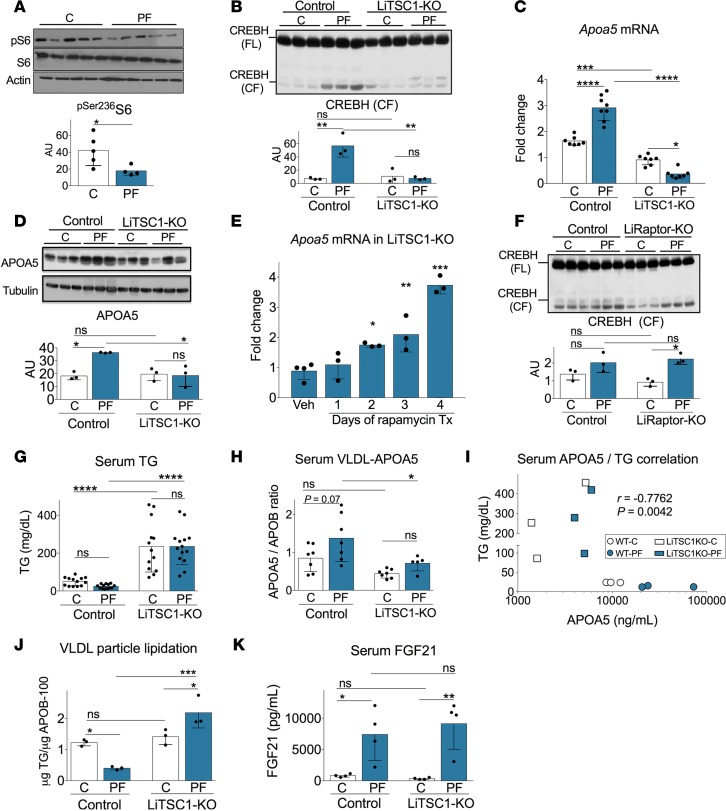
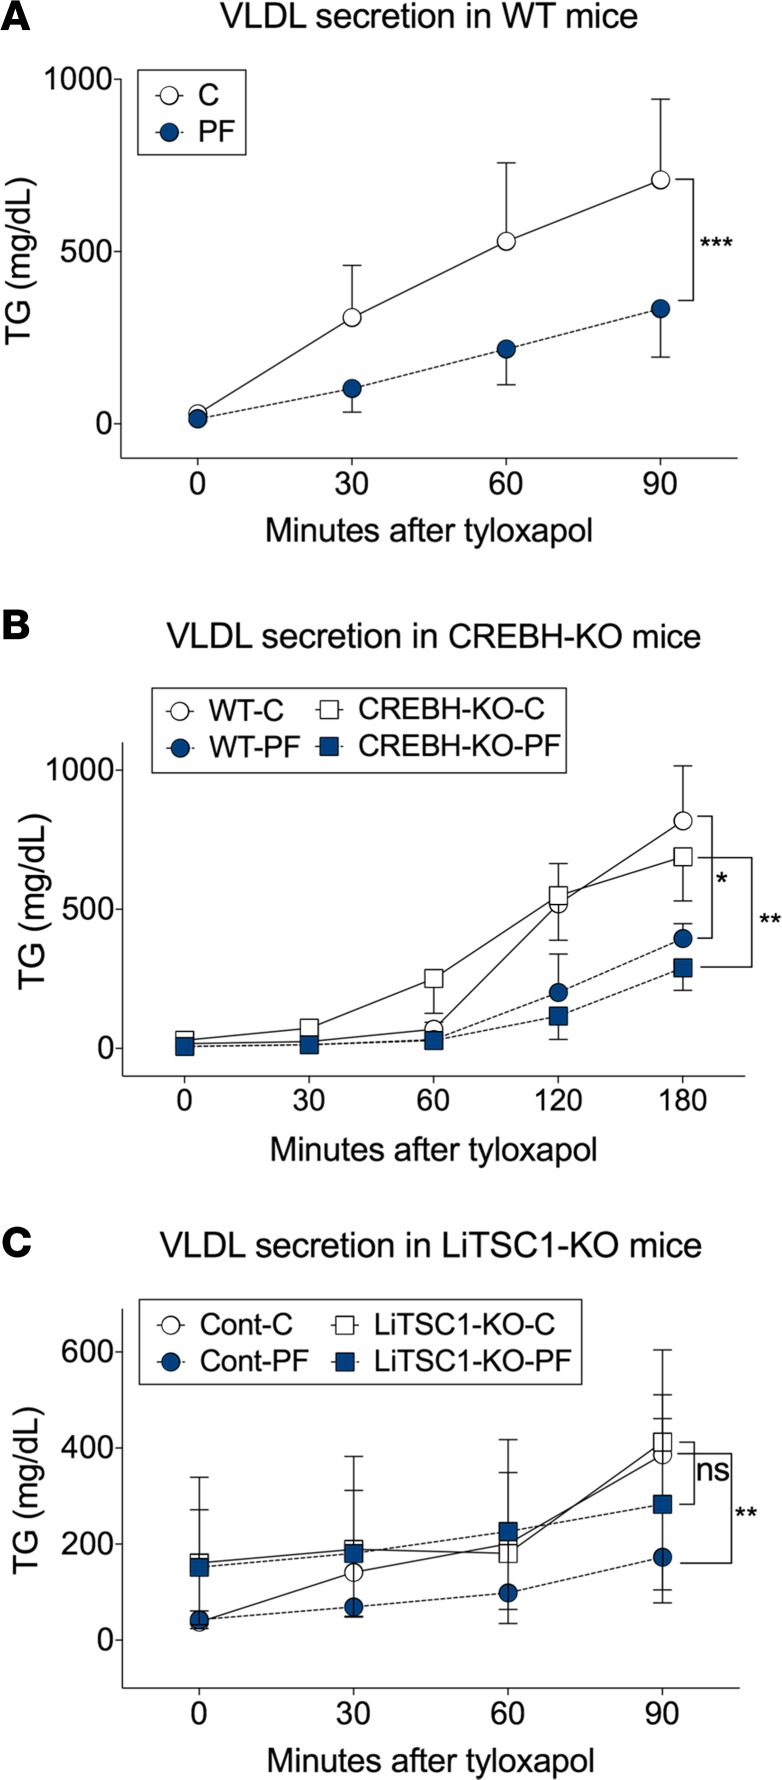
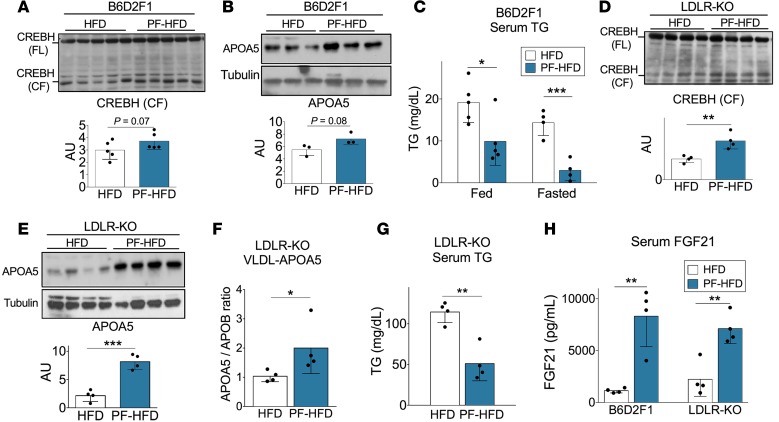
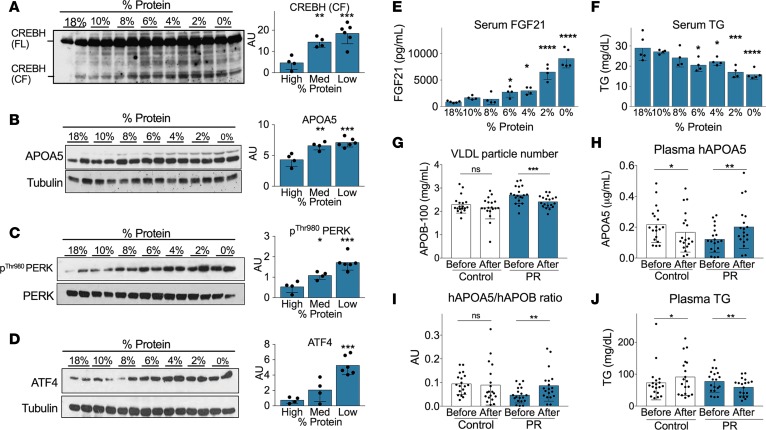
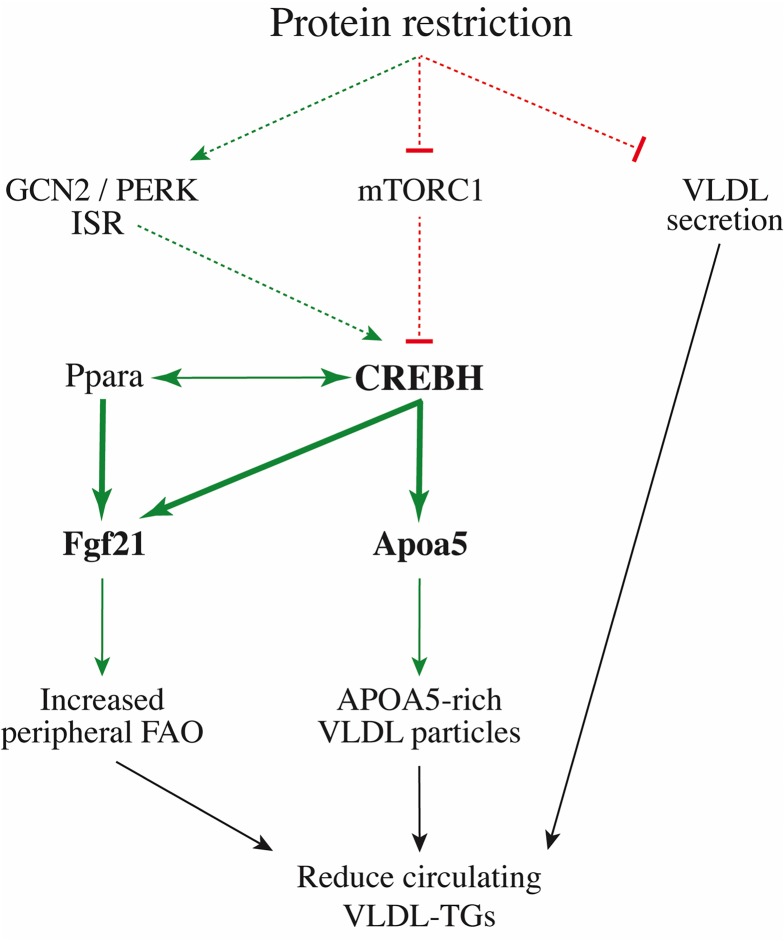
Hypertriglyceridemia is an independent risk factor for cardiovascular disease. Dietary interventions based on protein restriction (PR) reduce circulating triglycerides (TGs), but underlying mechanisms and clinical relevance remain unclear. Here, we show that 1 week of a protein-free diet without enforced calorie restriction significantly lowered circulating TGs in both lean and diet-induced obese mice. Mechanistically, the TG-lowering effect of PR was due, in part, to changes in very low-density lipoprotein (VLDL) metabolism both in liver and peripheral tissues. In the periphery, PR stimulated VLDL-TG consumption by increasing VLDL-bound APOA5 expression and promoting VLDL-TG hydrolysis and clearance from circulation. The PR-mediated increase in Apoa5 expression was controlled by the transcription factor CREBH, which coordinately regulated hepatic expression of fatty acid oxidation-related genes, including Fgf21 and Ppara. The CREBH-APOA5 axis activation upon PR was intact in mice lacking the GCN2-dependent amino acid-sensing arm of the integrated stress response. However, constitutive hepatic activation of the amino acid-responsive kinase mTORC1 compromised CREBH activation, leading to blunted APOA5 expression and PR-recalcitrant hypertriglyceridemia. PR also contributed to hypotriglyceridemia by reducing the rate of VLDL-TG secretion, independently of activation of the CREBH-APOA5 axis. Finally, a randomized controlled clinical trial revealed that 4-6 weeks of reduced protein intake (7%-9% of calories) decreased VLDL particle number, increased VLDL-bound APOA5 expression, and lowered plasma TGs, consistent with mechanistic conservation of PR-mediated hypotriglyceridemia in humans with translational potential as a nutraceutical intervention for dyslipidemia.

Keywords: Lipoproteins; Metabolism.


Conflict of interest statement

Conflict of interest: The authors have declared that no conflict of interest exists.

Figures

Figure 1
Figure 1. Short-term dietary protein restriction reduces circulating TGs independently of total caloric intake via effects on VLDL-TG levels.
B6D2F1 mice were fed the indicated complete (C, 18% protein content) or protein-free (PF, protein replaced with isocaloric sucrose) diet for 1 week prior to analysis. (A) Serum triglyceride (TG) concentrations in mice fed the indicated diet on an ad libitum basis (AL) or restricted daily (CR) by 50% (n = 5/group; 2-way ANOVA with Sidak post-hoc test between the indicated groups. (B) Serum TG in mice on the indicated diet (n = 4–5/group; 2-tailed Student’s t test between diets within fed or fasted state). (C) TG levels in FPLC fractions from pooled plasma samples (n = 5/group; VLDL, very low–density lipoprotein; IDL, intermediate-density lipoprotein; LDL, low-density lipoprotein; HDL, high-density lipoprotein). (D) Serum APOB-100 concentration representative of circulating VLDL particle number (n = 5/group; 2-tailed Student’s t test). (E) TG content of purified VLDL particles expressed per unit APOB-100, indicative of VLDL particle lipidation (n = 3/group; 2-tailed Student’s t test). Data expressed as mean ± SD; *P < 0.05; **P < 0.01; ***P < 0.001; ****P < 0.0001.
Figure 2
Figure 2. Protein restriction alters VLDL-TG consumption via changes in hepatic apolipoprotein expression.
(A and B) Time-dependent clearance of radiolabeled TG from the following circulating lipoprotein particles: (A) [3H]-triolein-labeled recombinant lipoprotein particles injected into mice fed a complete (C) or protein-free (PF) diet (n = 7/group); or (B) [3H]-palmitate-labeled and purified VLDL particles from mice on C or PF diets, and injected into complete-fed mice (n = 4/group; multiple t tests between diet groups with Holm-Sidak post-hoc test). (C) Hepatic mRNA expression of apolipoprotein-encoding genes from mice on the indicated diet (n = 4–11/group; 2-tailed Student’s t test). (D) Immunoblot of hepatic APOA5 protein expression. Below, quantitation normalized to tubulin and expressed in arbitrary units (AU, n = 5/group; 2-tailed Student’s t test). (E) Representative confocal microscopic images taken with a 63× objective from livers of mice on the indicated diet showing the ER marker KDEL (green), APOA5 (red), nuclei (DNA stained with DAPI, blue) superimposed to differential interference contrast (DIC) image and a composite image. Scale bar: 20 μm. (F) Circulating VLDL-bound APOA5 levels in mice on the indicated diet, expressed as the ratio of serum APOA5 to APOB-100 as measured by ELISA (n = 5/group; Mann-Whitney U test). (G) Correlation analysis between serum TG and APOA5. Each dot represents an individual mouse; r, Pearson’s coefficient. (H) Fasted serum TG levels in whole body APOA5-KO or control FVB WT mice on the indicated diet (n = 4/group; 2-way ANOVA with Sidak post-hoc test between the indicated groups). Data expressed as mean ± SD; **P < 0.01, ***P < 0.001; ****P < 0.0001.
Figure 3
Figure 3. CREBH regulates Apoa5 expression upon protein restriction.
(A–D) B6D2F1 mice were fed complete (C) or protein free (PF) diet for 1 week prior to analysis. (A) Immunoblot of CREBH full-length (FL) and cleaved fragment (CF) in liver extracts; 2 left lanes, CREBH-KO antibody specificity controls. Right, quantitation of CREBH CF normalized to FL and expressed in arbitrary units (AU; n = 5/group; 2-tailed Student’s t test). (B) CREBH CF immunoblot in liver nuclear extracts. Right, quantitation normalized to lamin A/C (n = 5/group; 2-tailed Student’s t test). (C) Representative confocal microscopic images (20× objective) of livers stained for CREBH amino-terminus (fire-red look-up intensity table visualization), DAPI-stained nuclei (DNA, blue) super-imposed onto the corresponding differential interference contract (DIC) image, and composite. Scale bars: 50 µm. Right micrograph, 10× digital magnification of indicated area. (D) Hepatic mRNA expression of CREBH targets Apoa4, Cyp4a10, Pepck, and Fgf21 (n = 5–10/group; 2-tailed Student’s t test). (E) Representative confocal microscopic images (63× objective) of HepG-2 cells transfected with hemagglutinin-tagged (HA-tagged) human CREBH CF (hCREBH [CF]-HA) vs. empty vector (Mock) and labeled with anti-HA antibody or DAPI (DNA) as indicated. Scale bars: 10 µm. (F) mRNA expression of human Apoa5 from cells transfected as in E; data in triplicate from one representative experiment of 3; 2-tailed Student’s t test. (G) ChIP of CREBH from livers of mice on the indicated diet, followed by qPCR analysis of the region flanking the predicted CREBH binding motif in the Apoa5 promoter (n = 3/group; 2-way ANOVA with Sidak post-hoc test between indicated groups). (H–N) CREBH-KO or WT control littermates were fed the indicated diet for 1 week prior to analysis. (H–J) Hepatic mRNA levels of Apoa5 (H), Fgf21 (I), and the Pparα targets Acadvl, Ctp1a, and Pparα itself (J) (n = 4/group; 2-way ANOVA with Sidak post-hoc test between indicated groups). (K) Immunoblot of hepatic APOA5; below, quantitation normalized to tubulin (n = 3/group; 2-way ANOVA with Sidak post-hoc test between indicated groups). (L–M) VLDL-bound APOA5 levels expressed as the ratio of serum APOA5 to APOB-100 (L) and serum FGF21 levels (M) (n = 4/group; 2-way ANOVA with Sidak post-hoc test between indicated groups). (N) Fasted serum TG concentrations pooled from 3 independent experiments including male and female WT and CREBH-KO mice (2-way ANOVA with Sidak post-hoc test between indicated groups). Data expressed as mean ± SD; *P < 0.05; **P < 0.01; ***P < 0.001; ****P < 0.0001.
Figure 4
Figure 4. Role of GCN2, PERK, and the integrated stress response in CREBH activation upon protein restriction.
(A–I) WT or GCN2-KO mice were fed the indicated control (C) or protein-free (PF) diet for 1 week prior to analysis in the 4-hour fasted state. (A) Immunoblot of phospho- and total eIF2α in liver extracts of WT mice. Right, quantitation of phospho- eIF2α normalized to total expressed in arbitrary units (AU) (n = 5/group; 2-tailed Student’s t test). (B) Immunoblot of hepatic CREBH. Right, quantitation of CREBH cleaved form (CF) normalized to full-length (FL) (n = 3–7; 2-way ANOVA with Sidak post-hoc test between the indicated groups). (C) Immunoblot of hepatic APOA5 expression. Right, quantitation normalized to tubulin (n = 4–14/group; 2-way ANOVA with Sidak post-hoc test between the indicated groups). Due to the number of samples, blots in B and C were run on separate gels with the same complete WT control on each for between-blot normalization. (D) Serum FGF21 levels (n = 5/group, 2-way ANOVA with Sidak post-hoc test between the indicated groups). (E) Serum TG (n = 5/group; 2-way ANOVA with Sidak post-hoc test between the indicated groups). (F) Immunoblot of phospho- and total PERK in liver extracts. Right, quantitation of phospho-PERK normalized to total (n = 3/group; 2-tailed Student’s t test). (G) Immunoblot of phospho- and total eIF2α in liver extracts (n = 4–5/group; 1-way ANOVA with Tukey post-hoc test between the indicated groups). (H and I) Hepatic mRNA expression of Asns (H) and Atf4 (I) (n = 4–5/group; 2-way ANOVA with Sidak post-hoc test between the indicated groups). Data expressed as mean ± SD; *P < 0.05; **P < 0.01; ***P < 0.00; ****P < 0.0001.
Figure 5
Figure 5. Constitutive mTORC1 signaling inhibits CREBH activation.
(A) Immunoblot of phospho- and total S6 in liver extracts. Below, quantitation of phospho-S6 normalized to total and expressed in arbitrary units (AU); n = 4–5/group; 2-tailed Student’s t test. (B–E and G–K) Liver-specific TSC1–KO (LiTSC1-KO; TSC1fl/fl|Albumin-Cre+/–) mice and littermate controls (TSC1fl/fl|Albumin-Cre–/–) fed a complete (C) or protein-free (PF) diet for 1 week prior to analysis. (B) Immunoblot of CREBH full-length (FL) and cleaved fragment (CF) in liver extracts. Below, quantitation of CF normalized to FL (n = 3/group; 2-way ANOVA with Sidak post-hoc test between the indicated groups). (C) Hepatic Apoa5 mRNA expression (n = 7–8/group; 2-way ANOVA with Sidak post-hoc test between indicated groups). (D) Immunoblot of hepatic APOA5. Below, quantitation normalized to tubulin (n = 3/group; 2-way ANOVA with Sidak post-hoc test between indicated groups; interaction P = 0.01/30% variation; genotype P = 0.02/22% variation; diet P = 0.02/24% variation). (E) Apoa5 mRNA expression from livers of LiTSC1-KO mice injected once daily with rapamycin (1 mg/kg) or vehicle (Veh) for indicated days of treatment (Tx); n = 3–4/group; 1-way ANOVA with Dunnett post-hoc test compared with vehicle control. (F) Immunoblot of hepatic CREBH in mice with hepatocyte-specific Raptor deletion (LiRaptor-KO; Raptorfl/fl|Albumin-Cre+/–) vs. littermate controls (Raptorfl/fl|Albumin-Cre–/–). Below, quantitation of CREBH CF normalized to FL (n = 3/group; 2-way ANOVA with Sidak post-hoc test between indicated groups). (G) Serum TG (n = 13–14/group; 2-way ANOVA with Sidak post-hoc test between indicated groups). (H) VLDL-bound APOA5 levels expressed as the ratio of serum APOA5 to APOB-100 (n = 5–7/group; 2-way ANOVA with Sidak post-hoc test between indicated groups). (I) Correlation analysis between serum TG and circulating APOA5. Each symbol represents an individual mouse; r, Pearson’s coefficient. (J) TG content of VLDL particles purified from serum of WT and LiTSC1-KO mice expressed per unit APOB-100 indicative of VLDL particle lipidation (n = 3/group; 2-way ANOVA with Sidak post-hoc test between indicated groups). (K) Serum FGF21 levels (n = 4/group; 2-way ANOVA with Sidak post-hoc test between indicated groups). Data expressed as mean ± SD; *P < 0.05; **P < 0.01; ***P < 0.001; ****P < 0.0001.
Figure 6
Figure 6. Reduced hepatic VLDL particle secretion rate contributes to TG lowering upon protein restriction independently of CREBH-APOA5 activation.
(AC) Hepatic VLDL secretion rate measured following tyloxapol injection in mice fed a complete (C) or protein-free (PF) diet. (A) B6D2F1 WT mice (n = 14/group); (B) CREBH-KO and WT littermate control mice (n = 4/group); and (C) LiTSC1-KO (TSC1fl/fl|Albumin-Cre+/–) and control (Cont, TSC1fl/fl|Albumin-Cre–/–) littermate mice (n = 5–9/group). 2-tailed Student’s t tests using peak AUC from baselined TG values between diets within genotypes. Data expressed as mean ± SD; *P < 0.05; **P < 0.01; ***P < 0.001.
Figure 7
Figure 7. PR improves TG homeostasis in dyslipidemic models.
(AH) B6D2F1 mice (A–C and H) or low-density lipoprotein receptor KO (LDLR-KO, D–H) mice were fed a high-fat diet (HFD) for 3 months prior to switching half to an isocaloric protein-free HFD (PF-HFD) for 1 week. Metabolic and molecular analyses were performed after a 4-hour fast. (A and D) Immunoblot of CREBH full-length (FL) and cleaved form (CF) in liver extracts with quantitation below of CF normalized to full-length (arbitrary units [AU]; n = 4–5/group; 2-tailed Student’s t test). (B and E) Immunoblot of APOA5 in liver extracts with quantitation below normalized to tubulin; n = 3–4/group; 2-tailed Student’s t test. (C and G) Serum TG in fed or 4-hour–fasted states as indicated (n = 4–5/group; 2-tailed Student’s t test between diet groups within fed or fasted state). (F) Circulating VLDL-bound APOA5 levels expressed as the ratio of serum APOA5 to APOB-100 (n = 4/group; 2-tailed Student’s t test). (H) Serum FGF21 levels (n = 4/group; 2-tailed Student’s t test within genotype between diets). Data expressed as mean ± SD; *P < 0.05, **P < 0.01, ***P < 0.001.
Figure 8
Figure 8. Moderate protein restriction increases APOA5 expression and reduces TG levels in mice and humans.
(A–F) Titration of protein restriction (18%–0% protein replaced with isocaloric sucrose) in B6D2F1 mice for 1 week. Immunoblot analyses of (A) CREBH full-length (FL) and cleaved form (CF), (B) APOA5, (C) PERK phosphorylation, and (D) ATF4 protein expression in whole liver extracts. For quantitation at right of each blot, samples were binned in 3 groups based on the level of dietary protein (high, 18%–10%; medium, 8%–6%; low, 4%–0%; n = 4–6/group; 1-way ANOVA with Dunnett post-hoc test compared with the high protein group). (E and F) Serum FGF21 (E) and TG (F) levels; 1-way ANOVA with Dunnett post-hoc test compared with the 18% protein group. (G–J) Effect of a low-protein diet in humans. Patients were randomized to control or protein restricted (PR, 7%–9% of energy from protein) diets; blood samples were taken before or after 4–6 weeks on the indicated diet (n = 19 per group; paired t test comparing parameter before and after diet). (G) Plasma APOB-100 concentration representative of circulating VLDL particle number. (H) Plasma APOA5. (I) VLDL-bound APOA5 levels expressed as the ratio of plasma APOA5 to APOB-100. (J) Plasma TG levels. Data expressed as mean ± SD; *P < 0.05; **P < 0.01; ***P < 0.001; ****P < 0.001.
Figure 9
Figure 9. Model of dietary protein control of TG homeostasis via effects on hepatic VLDL-TG metabolism.
Green lines denote pathways activated during protein restriction; red lines depict downregulated pathways. Dashed lines represent events for which no precise mechanism of regulation is known. Bold characters represent mediators activated during PR. Black arrows connect described effectors with the ultimate TG-lowering benefit of PR. FAO, fatty acid oxidation; ISR, integrated stress response.

References

    1. Nordestgaard BG, Varbo A. Triglycerides and cardiovascular disease. Lancet. 2014;384(9943):626–635. doi: 10.1016/S0140-6736(14)61177-6. - DOI - PubMed
    1. Christian JB, Arondekar B, Buysman EK, Jacobson TA, Snipes RG, Horwitz RI. Determining triglyceride reductions needed for clinical impact in severe hypertriglyceridemia. Am J Med. 2014;127(1):36–44.e1. doi: 10.1016/j.amjmed.2013.09.018. - DOI - PubMed
    1. Sarwar N, et al. Triglycerides and the risk of coronary heart disease: 10,158 incident cases among 262,525 participants in 29 Western prospective studies. Circulation. 2007;115(4):450–458. doi: 10.1161/CIRCULATIONAHA.106.637793. - DOI - PubMed
    1. Nordestgaard BG, Benn M, Schnohr P, Tybjaerg-Hansen A. Nonfasting triglycerides and risk of myocardial infarction, ischemic heart disease, and death in men and women. JAMA. 2007;298(3):299–308. doi: 10.1001/jama.298.3.299. - DOI - PubMed
    1. Hokanson JE, Austin MA. Plasma triglyceride level is a risk factor for cardiovascular disease independent of high-density lipoprotein cholesterol level: a meta-analysis of population-based prospective studies. J Cardiovasc Risk. 1996;3(2):213–219. doi: 10.1097/00043798-199604000-00014. - DOI - PubMed

Publication types

MeSH terms

Substances