. 2018 Nov 1;9(1):4567.
doi: 10.1038/s41467-018-06891-x.

Disease-relevant transcriptional signatures identified in individual smooth muscle cells from healthy mouse vessels

Affiliations

Disease-relevant transcriptional signatures identified in individual smooth muscle cells from healthy mouse vessels

Lina Dobnikar et al. Nat Commun. .

Erratum in

Abstract

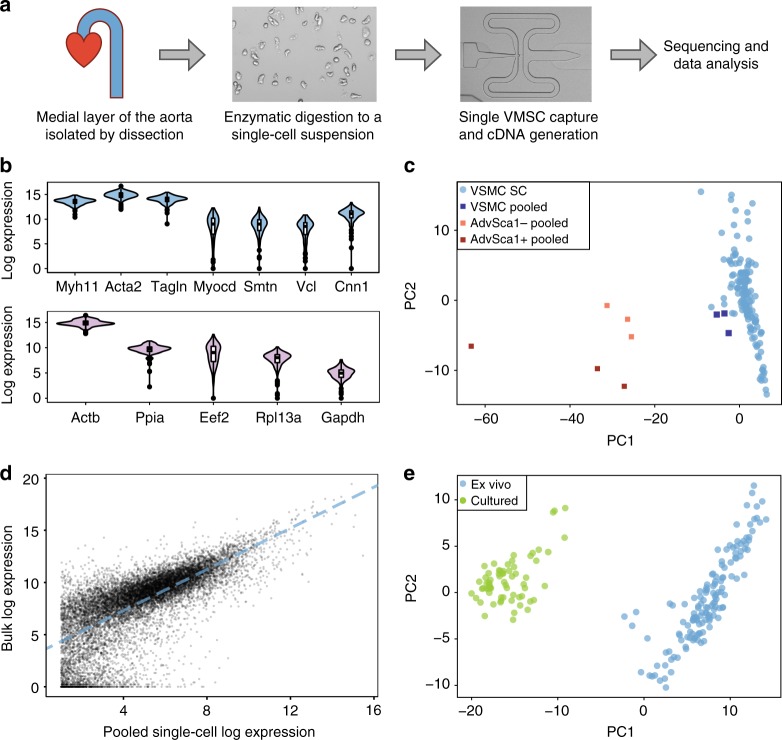
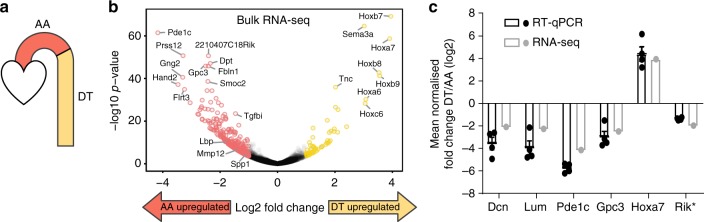
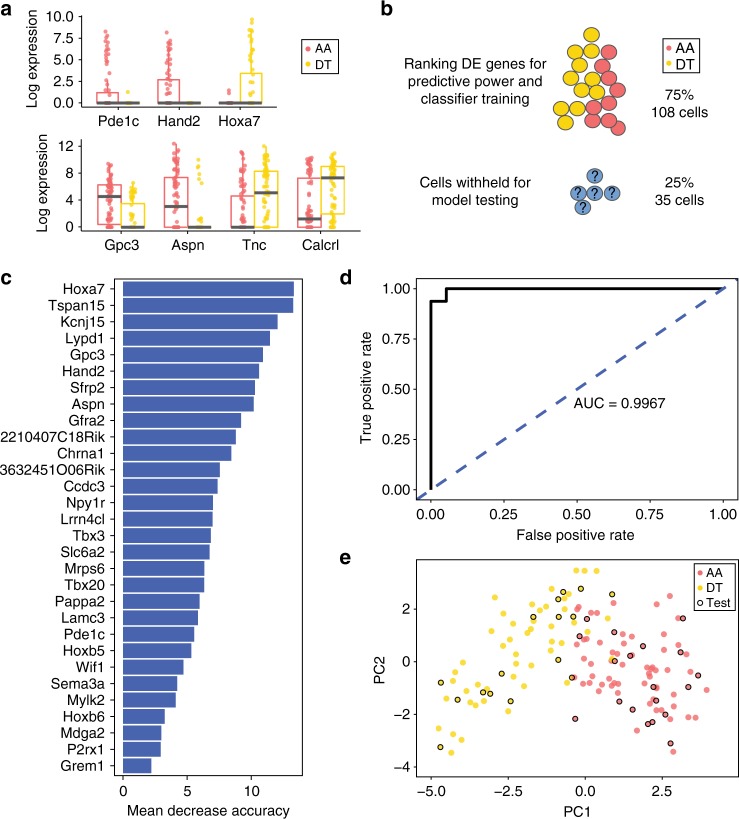
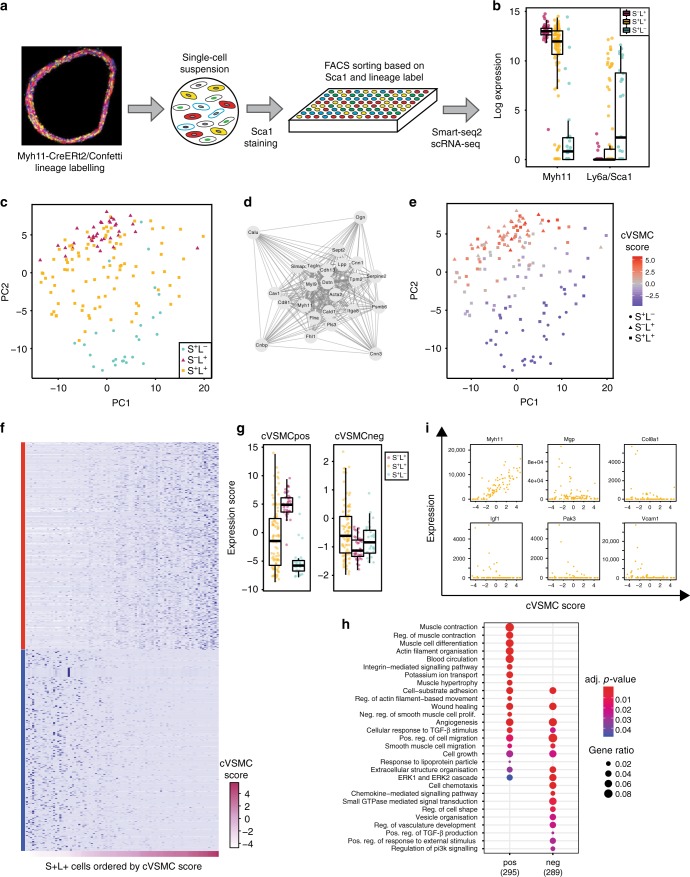
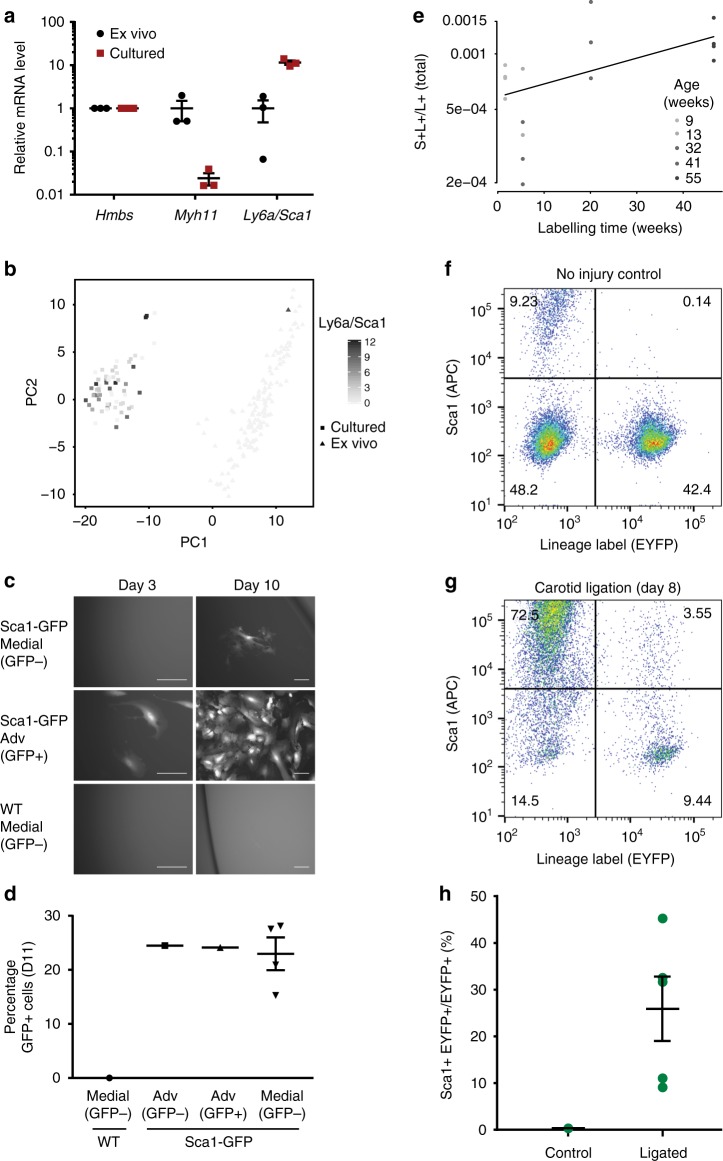
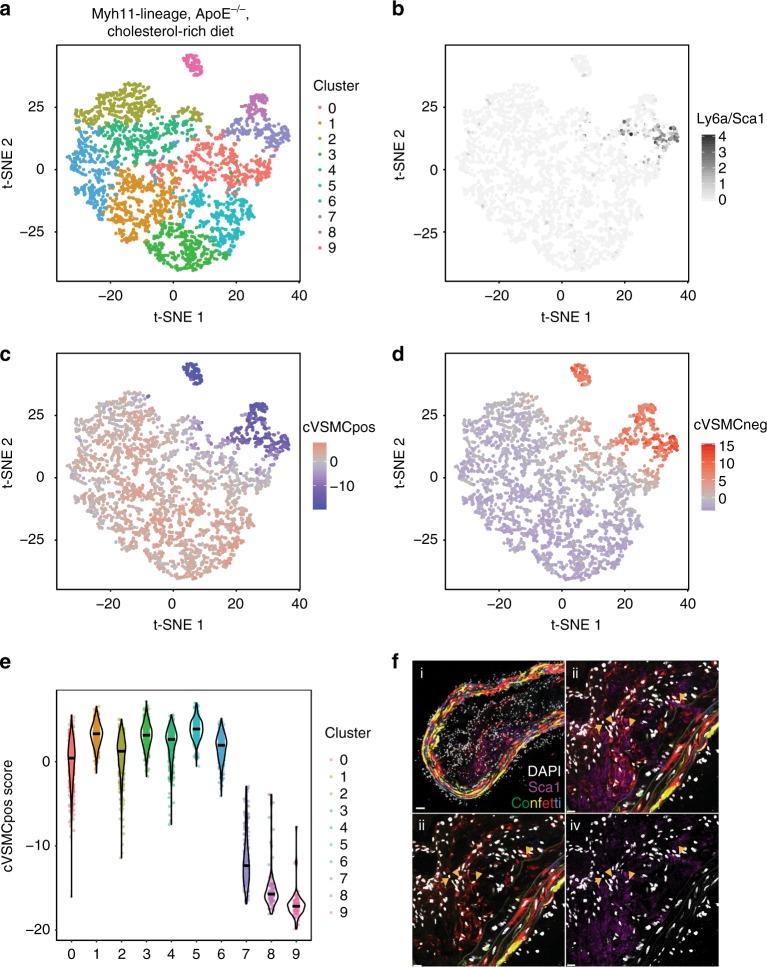
Vascular smooth muscle cells (VSMCs) show pronounced heterogeneity across and within vascular beds, with direct implications for their function in injury response and atherosclerosis. Here we combine single-cell transcriptomics with lineage tracing to examine VSMC heterogeneity in healthy mouse vessels. The transcriptional profiles of single VSMCs consistently reflect their region-specific developmental history and show heterogeneous expression of vascular disease-associated genes involved in inflammation, adhesion and migration. We detect a rare population of VSMC-lineage cells that express the multipotent progenitor marker Sca1, progressively downregulate contractile VSMC genes and upregulate genes associated with VSMC response to inflammation and growth factors. We find that Sca1 upregulation is a hallmark of VSMCs undergoing phenotypic switching in vitro and in vivo, and reveal an equivalent population of Sca1-positive VSMC-lineage cells in atherosclerotic plaques. Together, our analyses identify disease-relevant transcriptional signatures in VSMC-lineage cells in healthy blood vessels, with implications for disease susceptibility, diagnosis and prevention.


Conflict of interest statement

The authors declare no competing interests.

Figures

Fig. 1
Fig. 1
Single-cell RNA-seq analysis of vascular smooth muscle cells. a Schematic of the approach. Cells from the medial layer are enzymatically digested to obtain a single-cell suspension. Single-cell cDNA libraries are then generated, followed by sequencing and data analysis. b Violin plots showing the log2-transformed normalised expression of VSMC marker genes across the profiled 143 cells (top), as well as of housekeeping genes with similar mean expression levels (lower panel). c Mapping of single-cell VSMC transcriptomes (light blue), as well as transcriptomes from control VSMC (Sca1–, dark blue) and adventitial (Adv) cell (Sca1–, orange; Sca1+, red) samples (tube controls) on a two-dimensional PCA space. d Dot plot showing the log2-transformed read counts detected for each gene (black dots) when pooling across all single-cell samples versus the read counts detected with bulk RNA-seq. The dashed line shows a linear regression fit. e PCA plot summarising the single-cell expression profiles for ex vivo VSMCs (blue) and in vitro cultured VSMCs (green, data from Gene Expression Omnibus accession GSE79436, Adhikari et al.)
Fig. 2
Fig. 2
Bulk RNA-seq of VSMCs from the aortic arch and descending thoracic aorta. a Schematic representation of the aorta, indicating the aortic arch (AA) and descending thoracic aorta (DT). b Volcano plot showing significance (-log10 p-value) versus relative gene expression in VSMCs from the DT versus the AA. Genes showing significant differences in expression (adjusted p-value < 0.01, log2 fold change > 1) are labelled in yellow (upregulated in DT) and red (upregulated in AA). Gene names for selected genes are indicated. Three independent samples were analysed for each region (AA and DT samples paired). c Relative expression (log2(DT/AA)) of selected genes determined by RT-qPCR (black dots/bars, n = 4) and bulk RNA-seq (grey dots/bars). Error bars indicate s.e.m. from four independent RT-qPCR experiments. Rik*: 3632451O06Rik
Fig. 3
Fig. 3
Single-VSMC transcriptomes reflect regional identity. a Boxplots showing log2-transformed normalised expression of genes detected as differentially expressed between the aortic arch (AA, red) and descending thoracic aorta (DT, yellow) in bulk RNA-seq experiments across single VSMCs. Top panel: genes showing expression near-exclusively in cells from one tissue. Lower panel: genes that are expressed in different proportions of cells from the AA and DT. Median (centre line), first and third quartiles (bounds of box) and 1.5 interquartile range (whiskers) and individual data points (dots) are indicated. b Schematic of the random forest analysis. The regional identity of 75% of the cells was used in classifier training and refinement. The remaining 25% of cells (35 cells) were tested with the model showing the best classification performance with the 75% subset. c The out-of-bag mean decrease in classification accuracy for the 30 genes used in the final classifier. d ROC curve showing the performance of the classifier on the 25% subset of cells that were not used for model testing and refinement. e PCA plot based on the 30 genes used in the final classifier, showing AA (red) and DT (yellow) cells. Cells in the 25% test subset are circled in black
Fig. 4
Fig. 4
VSMCs show heterogeneous expression of genes implicated in cardiovascular disease. a Scatter plots showing the mean-variance relationship of log2-transformed normalised expression levels for each gene, with colour-highlighting of genes showing highly variable expression in the aortic arch (AA, red, top panel) and descending thoracic aorta (DT, yellow, lower panel). b Bar graph showing the implication of the identified highly variable genes (HVGs) in AA (red), DT (yellow) or both regions (green) in functions related to VSMC biology based on published literature (see Methods for details). c Dot plot showing log2-transformed normalised counts detected in individual VSMCs from AA (red) and DT (yellow) for selected genes that show variable expression across single cells. d, e t-SNE plot visualising a 10X Chromium dataset generated from 2846 unselected cells (gated as live using Zombie NIR staining and singlets using doublet discrimination) from the whole aortas of three tamoxifen-labelled Myh11-CreERt2/Confetti animals (pooled). d Clusters generated using graph-based clustering are colour-coded as indicated and adventitial (Adv), endothelial (EC) and VSMC (VSMC) populations are labelled. e Log-transformed expression levels of selected HVGs identified in AA and DT populations based on Fluidigm C1 data (Rgs5, Irf1, Atf3, Nfkbia), shown using a scale from light to dark grey
Fig. 5
Fig. 5
A subset of medial cells express Sca1. a t-SNE plot visualising the 10X Chromium dataset of unselected cells from whole aortas (shown in Fig. 4d), with log-transformed expression levels of Ly6a/Sca1 in each cell colour-coded on a scale from light to dark grey. b Representative confocal images of GFP-positive cells isolated from the media (top row) or adventitia (Adv, middle row) of Sca1-GFP animals after immunostaining for aSMA. Signals for GFP (green), anti-aSMA (magenta) and nuclear DAPI (white) are shown individually and merged as indicated. The lower row shows GFP-negative medial cells isolated from wild-type animals and stained with isotype IgG as a control for staining and GFP detection. Scale bars are 10 µm. c Dot plot showing the percentage of aSMA– and aSMA+ cells in sorted GFP+ adventitial (Adv, red dot, n = 1) and medial cells (green dots, n = 4) from Sca1-GFP animals. Data for individual replicates and their mean values are indicated and error bars show s.e.m.
Fig. 6
Fig. 6
VSMC-lineage cells express Sca1. a Schematic showing strategies for lineage labelling of VSMCs using a Myh11-driven, tamoxifen-inducible Cre-recombinase (CreERt2). Tamoxifen treatment activates Cre recombinase activity, resulting in VSMC-specific excision of the stop codon in fluorescent reporter transgenes inserted into the Rosa26 locus (R26). Left panel, the single-colour EYFP reporter. Right panel, the multicolour Confetti reporter, which results in stochastic labelling of VSMC-lineage cells with one of four fluorescent proteins (GFP, YFP, RFP, CFP). b, c Maximum projection of a 12 µm transverse cryosection from the carotid artery of an Myh11-CreERt2/Confetti animal one week after tamoxifen labelling. Confetti fluorescent proteins are shown in red (RFP), yellow (YFP), blue (CFP) and green (nuclear GFP), elastic lamina autofluorescence in green and nuclear DAPI in white. The white boxed region in b is magnified in c, and the dashed lines show the medial-adventitial (red) and medial-endothelial (blue) borders in each panel. Scale bars are 50 µm (b) and 10 µm (c). d, e FACS plot showing forward scatter (FSC) and EYFP expression in all (d) or gated Sca1+ cells (e) isolated from the medial layer of aortas from Myh11-CreERt2/Rosa26-EYFP animals
Fig. 7
Fig. 7
Transcriptional signature of S+L+ cells. a Schematic of the experimental strategy. A single-cell suspension of medial cells from Myh11-CreERt2/Confetti animals (a confocal image of an aortic cryosection is shown) was immunostained for Sca1 and index-sorted based on the expression of the lineage label and Sca1 to isolate individual cells for Smart-seq2 analysis. b Boxplots showing the log2-transformed normalised levels of Myh11 and Ly6a/Sca1 transcripts detected in Sca1-negative, lineage label positive (S–L+, magenta), Sca1-positive, lineage label positive (S+L+, yellow) and Sca1-positive, lineage label negative cells (S+L–, blue). c PCA plot summarising the expression of the 500 most variable genes in S−L+, (magenta triangles), S+L+ (yellow squares) and S+L– (blue circles) cells. d The co-expressed cVSMC network module detected by weighted gene co-expression network analysis (WGCNA) based on 52 highly variable genes (HVGs) identified in S+L+ cells. Co-expression strength is indicated by edge thickness. e The PCA plot as in c, with cVSMC scores for S−L+ (triangles), S+L+ (squares) and S+L- (circles) cells colour-coded on a scale from blue to red. f Heatmap showing the expression of genes which positively (cVSMCpos, red side strip) or negatively (cVSMCneg, blue side strip) correlated with cVSMC score (likelihood ratio test, fdr-adjusted p-value < 0.05). Rows represent genes and columns represent cells ordered by their cVSMC score (colour-coded from light to dark purple, lower strip). g Boxplots showing the expression score of cVSMCpos (left) and cVSMCneg (right) genes for S−L+ (magenta), S+L+ (yellow) and S+L- (blue) cells. Expression scores are calculated based on PC1 as described in the Methods section. h Bubble plot of selected GO terms enriched in cVSMCpos (left) and cVSMCneg (right) genes. Dot size represents the number of genes overlapping with each GO term and the adjusted p-value is colour-coded from red to blue. The full list of enriched GO terms is given in Supplementary Data 9. i Dot plots showing the normalised expression of cVSMCpos gene Myh11 and cVSMCneg genes Mgp, Col8a1, Igf1, Pak3 and Vcam1 across S+L+ cells, ordered by cVSMC score. Boxplots show median (centre line), first and third quartiles (bounds of box) and 1.5 interquartile range (whiskers) and data for individual cells (dots)
Fig. 8
Fig. 8
Sca1 is upregulated in response to VSMC stimulation in vitro and in vivo. a Relative expression (log2-transformed) of Myh11 and Ly6a/Sca1 in ex vivo (black) and cultured mouse aortic VSMCs at passage 4–5 (red) determined by RT-qPCR, normalised to housekeeping gene expression (Hmbs). Lines show mean from analysis of three independent primary cultures, error bars show s.e.m. Differences in Myh11 (p = 0.001) and Ly6a/Sca1 (p = 5.1e−10) expression are statistically significant (student’s t-test). b The PCA plot of single-cell expression profiles for ex vivo VSMCs (squares) and cultured VSMCs (triangles) shown in Fig. 1e, with expression level of Ly6a/Sca1 colour-coded from light to dark grey. c, d Images (c) and GFP-signal quantification (d) of FACS-isolated medial cells from Sca1-GFP animals (sorted as GFP-negative, n = 4, top row in c) with Sca1-GFP adventitial (Adv, sorted as GFP– or GFP+ (middle row in c), tissue from four animals was pooled) and wildtype (WT) medial cell controls (sorted as GFP-, n = 1, lower row in c). Cells were cultured for 11 days before fixation and confocal imaging. c Epifluorescence images showing GFP signal after 3 or 10 days of culture. Scale bars are 100 µm. d Quantification of GFP signal in each population showing the number of GFP-positive cells as a percentage of the total number of DAPI-positive cells. Images for quantification were taken in a single z plane. Individual replicates and their mean are indicated and error bars show s.e.m. e Logistic regression analysis of the relationship between S+L+ cells and time after lineage labelling (logit-link logistic regression coefficient = 0.016+/−0.005 [mean+/−95% confidence interval], p-value based on Student’s distribution = 2.56e−10). Trendline and data points, colour-coded by animal age (black gradient), are shown. Age was not included in the regression model presented here; the model accounting for both time after labelling and age is shown in Supplementary Fig. 9. f, g FACS plots showing EYFP and Sca1 (APC) expression in cells from the left common carotid artery (LCCA) isolated from tamoxifen-labelled Myh11-CreERt2/EYFP no injury controls (f) or eight days after ligation (g). h The percentage of lineage labelled cells (EYFP+) that expressed Sca1 in the LCCA isolated from ligated and no injury controls. Dots represents data from independent animals (n = 5 for each group), lines show means, and error bars s.e.m
Fig. 9
Fig. 9
The transcriptional signature of S+L+ cells from healthy vessels is expressed in VSMC-derived plaque cells. a t-SNE visualisation of 10X Chromium dataset (3314 cells) of lineage-positive cells isolated from aortic plaques and the underlying media in Myh11-CreERt2/Confetti mice that were first tamoxifen-treated and then fed a cholesterol-rich diet for 14 or 18 weeks (tissue from three and two animals respectively was pooled for the analysis). The cells are grouped into a large population composed of 9 clusters, including one enriched for chondrocytic genes (cluster 8, magenta), and a smaller, distinct population, which was enriched for macrophage genes (cluster 9, pink). b t-SNE plot of 10X Chromium dataset from a with Ly6a/Sca1 expression colour-coded from light to dark grey. c, d t-SNE plot of 10X Chromium from a, with expression scores for cVSMCpos (c) or cVSMCneg (d) genes colour-coded on a blue to red gradient. e Violin plots showing the expression score of cVSMCpos genes in cells mapping to each cluster shown in a. f Confocal image of a cryosection of the descending thoracic aorta from a Myh11-CreERt2/Confetti/ApoE-/- mouse fed a cholesterol-rich diet for 30 weeks and immunostained for Sca1. Signals for fluorescent Confetti proteins (GFP, green; RFP, red; YFP, yellow and CFP, blue) are shown in i–iii, nuclear DAPI (white) is shown in all panels, and anti-Sca1 (magenta) is shown in i, ii, and iv. The region outlined in i is magnified in ii–iv, with arrows pointing to cells that are double-positive for the Confetti lineage label (RFP) and Sca1. Image in i is a maximum projection of 16 z-slices (2 µm each) and ii–iv show a single 2 µm Z-slice. Scale bars are 40 μm (i) or 15 μm (ii–iv)
Fig. 10
Fig. 10
Model of VSMC priming and inflammation-induced phenotypic switching. Within the healthy vessel, priming of contractile VSMCs induces expression of Sca1 (black symbols) and Response Signature (RS, blue) genes, as well as the downregulation of the cVSMC signature (cVSMC, red). We propose that Sca1-expressing VSMC-lineage cells are hyper-responsive to inflammation and constitute an intermediate plastic population that potentially gives rise to phenotypically distinct, Sca1-negative VSMC-derived cells in the plaque (cap cells displaying the cVSMC phenotype, and core cells co-expressing the Response Signature with chondrocyte- (magenta) or macrophage-like genes (pink))

References

    1. Bennett MR, Sinha S, Owens GK. Vascular smooth muscle cells in atherosclerosis. Circ. Res. 2016;118:692–702. doi: 10.1161/CIRCRESAHA.115.306361. - DOI - PMC - PubMed
    1. Alexander MR, Owens GK. Epigenetic control of smooth muscle cell differentiation and phenotypic switching in vascular development and disease. Annu. Rev. Physiol. 2012;74:13–40. doi: 10.1146/annurev-physiol-012110-142315. - DOI - PubMed
    1. Rensen SSM, Doevendans PAFM, van Eys GJJM. Regulation and characteristics of vascular smooth muscle cell phenotypic diversity. Neth. Heart J. 2007;15:100–108. doi: 10.1007/BF03085963. - DOI - PMC - PubMed
    1. Shanahan CM, Weissberg PL. Smooth muscle cell heterogeneity: patterns of gene expression in vascular smooth muscle cells in vitro and in vivo. Cartography. 1998;18:333–338. - PubMed
    1. Pfaltzgraff ER, Bader DM. Heterogeneity in vascular smooth muscle cell embryonic origin in relation to adult structure, physiology, and disease. Dev. Dyn. 2015;244:410–416. doi: 10.1002/dvdy.24247. - DOI - PMC - PubMed

Publication types