Discovery of a Novel Nav1.7 Inhibitor From Cyriopagopus albostriatus Venom With Potent Analgesic Efficacy
- PMID: 30386239
- PMCID: PMC6198068
- DOI: 10.3389/fphar.2018.01158
Discovery of a Novel Nav1.7 Inhibitor From Cyriopagopus albostriatus Venom With Potent Analgesic Efficacy
Abstract
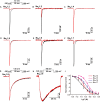
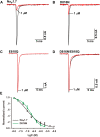
Spider venoms contain a vast array of bioactive peptides targeting ion channels. A large number of peptides have high potency and selectivity toward sodium channels. Nav1.7 contributes to action potential generation and propagation and participates in pain signaling pathway. In this study, we describe the identification of μ-TRTX-Ca2a (Ca2a), a novel 35-residue peptide from the venom of Vietnam spider Cyriopagopus albostriatus (C. albostriatus) that potently inhibits Nav1.7 (IC50 = 98.1 ± 3.3 nM) with high selectivity against skeletal muscle isoform Nav1.4 (IC50 > 10 μM) and cardiac muscle isoform Nav1.5 (IC50 > 10 μM). Ca2a did not significantly alter the voltage-dependent activation or fast inactivation of Nav1.7, but it hyperpolarized the slow inactivation. Site-directed mutagenesis analysis indicated that Ca2a bound with Nav1.7 at the extracellular S3-S4 linker of domain II. Meanwhile, Ca2a dose-dependently attenuated pain behaviors in rodent models of formalin-induced paw licking, hot plate test, and acetic acid-induced writhing. This study indicates that Ca2a is a potential lead molecule for drug development of novel analgesics.
Keywords: Nav1.7; analgesic activity; electrophysiology; peptide toxin; sodium channel; tarantula spider.
Figures


Similar articles
-
µ-TRTX-Ca1a: a novel neurotoxin from Cyriopagopus albostriatus with analgesic effects.Acta Pharmacol Sin. 2019 Jul;40(7):859-866. doi: 10.1038/s41401-018-0181-9. Epub 2018 Oct 31. Acta Pharmacol Sin. 2019. PMID: 30382183 Free PMC article.
-
General mechanism of spider toxin family I acting on sodium channel Nav1.7.Zool Res. 2022 Sep 18;43(5):886-896. doi: 10.24272/j.issn.2095-8137.2022.185. Zool Res. 2022. PMID: 36052553 Free PMC article.
-
A Novel Toxin from Haplopelma lividum Selectively Inhibits the NaV1.8 Channel and Possesses Potent Analgesic Efficacy.Toxins (Basel). 2016 Dec 26;9(1):7. doi: 10.3390/toxins9010007. Toxins (Basel). 2016. PMID: 28035974 Free PMC article.
-
Selective Voltage-Gated Sodium Channel Peptide Toxins from Animal Venom: Pharmacological Probes and Analgesic Drug Development.ACS Chem Neurosci. 2018 Feb 21;9(2):187-197. doi: 10.1021/acschemneuro.7b00406. Epub 2017 Dec 8. ACS Chem Neurosci. 2018. PMID: 29161016 Review.
-
A complicated complex: Ion channels, voltage sensing, cell membranes and peptide inhibitors.Neurosci Lett. 2018 Jul 13;679:35-47. doi: 10.1016/j.neulet.2018.04.030. Epub 2018 Apr 21. Neurosci Lett. 2018. PMID: 29684532 Review.
Cited by
-
Pain-related toxins in scorpion and spider venoms: a face to face with ion channels.J Venom Anim Toxins Incl Trop Dis. 2021 Dec 6;27:e20210026. doi: 10.1590/1678-9199-JVATITD-2021-0026. eCollection 2021. J Venom Anim Toxins Incl Trop Dis. 2021. PMID: 34925480 Free PMC article. Review.
-
Two Novel Peptide Toxins from the Spider Cyriopagopus longipes Inhibit Tetrodotoxin-Sensitive Sodium Channels.Toxins (Basel). 2020 Aug 19;12(9):529. doi: 10.3390/toxins12090529. Toxins (Basel). 2020. PMID: 32824960 Free PMC article.
-
The Role of Toxins in the Pursuit for Novel Analgesics.Toxins (Basel). 2019 Feb 23;11(2):131. doi: 10.3390/toxins11020131. Toxins (Basel). 2019. PMID: 30813430 Free PMC article. Review.
-
Newly Discovered Action of HpTx3 from Venom of Heteropoda venatoria on Nav1.7 and Its Pharmacological Implications in Analgesia.Toxins (Basel). 2019 Nov 20;11(12):680. doi: 10.3390/toxins11120680. Toxins (Basel). 2019. PMID: 31757020 Free PMC article.
-
Structure-Function and Therapeutic Potential of Spider Venom-Derived Cysteine Knot Peptides Targeting Sodium Channels.Front Pharmacol. 2019 Apr 11;10:366. doi: 10.3389/fphar.2019.00366. eCollection 2019. Front Pharmacol. 2019. PMID: 31031623 Free PMC article. Review.
References
-
- Abe M., Kurihara T., Han W., Shinomiya K., Tanabe T. (2002). Changes in expression of voltage-dependent ion channel subunits in dorsal root ganglia of rats with radicular injury and pain. Spine 27 1517–1524; discussion 1525. - PubMed
-
- Blanchard M. G., Willemsen M. H., Walker J. B., Dib-Hajj S. D., Waxman S. G., Jongmans M. C., et al. (2015). De novo gain-of-function and loss-of-function mutations of SCN8A in patients with intellectual disabilities and epilepsy. J. Med. Genet. 52 330–337. 10.1136/jmedgenet-2014-102813 - DOI - PMC - PubMed
LinkOut - more resources
Full Text Sources
Research Materials

