XPA, XPC, and XPD Modulate Sensitivity in Gastric Cisplatin Resistance Cancer Cells
- PMID: 30386247
- PMCID: PMC6199368
- DOI: 10.3389/fphar.2018.01197
XPA, XPC, and XPD Modulate Sensitivity in Gastric Cisplatin Resistance Cancer Cells
Abstract
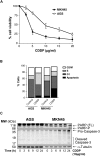
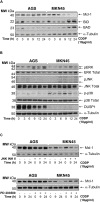
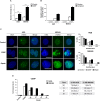
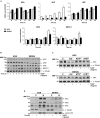
Cisplatin is an election drug widely used in clinic for the treatment of advanced gastric cancer. However, the heterogeneity of the gastric tumors and its resistance to the drugs, make in some cases the response very low and the prognosis unpredictable. In this manuscript we aim to find the molecular processes involved in cisplatin-induced apoptosis in two gastric cancer cell lines with different sensitivity to the treatment: AGS and MKN45. The apoptosis induction is higher in MKN45 than in AGS cells in response to CDDP. The intrinsic apoptotic pathway study revealed that MKN45 cells undergo degradation of Mcl-1 together with an increase of Bid and Bad levels, which results in sensitivity to CDDP. In addition, DNA repair NER pathway is impair in MKN45 cells due to low levels of XPC and the absence of translocation of XPA and XPD to the nucleus after stimuli. Altogether, these results suggest that NER and Bcl-2 protein family proteins are potential targets to improve the response to cisplatin treatment.
Keywords: Bcl-2 family; NER repair; apoptosis; cisplatin; gastric cancer.
Figures


Similar articles
-
Oxaliplatin in treatment of the cisplatin-resistant MKN45 cell line of gastric cancer.Anticancer Res. 2008 Jul-Aug;28(4B):2087-92. Anticancer Res. 2008. PMID: 18751380
-
Cisplatin induces cytoplasmic to nuclear translocation of nucleotide excision repair factors among spiral ganglion neurons.Hear Res. 2008 May;239(1-2):79-91. doi: 10.1016/j.heares.2008.01.013. Epub 2008 Feb 8. Hear Res. 2008. PMID: 18329831
-
Expression of genes involved in nucleotide excision repair and sensitivity to cisplatin and melphalan in human cancer cell lines.Eur J Cancer. 1998 Oct;34(11):1783-8. doi: 10.1016/s0959-8049(98)00190-7. Eur J Cancer. 1998. PMID: 9893669
-
Poor expression of microRNA-135b results in the inhibition of cisplatin resistance and proliferation and induces the apoptosis of gastric cancer cells through MST1-mediated MAPK signaling pathway.FASEB J. 2019 Mar;33(3):3420-3436. doi: 10.1096/fj.201800618RRR. Epub 2018 Dec 21. FASEB J. 2019. PMID: 30576232 Free PMC article.
-
Mechanism and regulation of DNA damage recognition in nucleotide excision repair.Genes Environ. 2019 Jan 25;41:2. doi: 10.1186/s41021-019-0119-6. eCollection 2019. Genes Environ. 2019. PMID: 30700997 Free PMC article. Review.
Cited by
-
Modulation of Chemotherapy Sensitivity of Breast Cancer Cells through Transforming Growth Factor-beta Pathway-mediated Alterations in DNA Damage Response.Int J Med Sci. 2025 Mar 31;22(9):2031-2039. doi: 10.7150/ijms.111217. eCollection 2025. Int J Med Sci. 2025. PMID: 40303493 Free PMC article.
-
Inhibition of DNA Repair in Cancer Therapy: Toward a Multi-Target Approach.Int J Mol Sci. 2020 Sep 12;21(18):6684. doi: 10.3390/ijms21186684. Int J Mol Sci. 2020. PMID: 32932697 Free PMC article. Review.
-
Role of Nucleotide Excision Repair in Cisplatin Resistance.Int J Mol Sci. 2020 Dec 4;21(23):9248. doi: 10.3390/ijms21239248. Int J Mol Sci. 2020. PMID: 33291532 Free PMC article. Review.
-
Deciphering the Molecular Mechanisms behind Drug Resistance in Ovarian Cancer to Unlock Efficient Treatment Options.Cells. 2024 May 4;13(9):786. doi: 10.3390/cells13090786. Cells. 2024. PMID: 38727322 Free PMC article. Review.
-
Mechanism of cisplatin resistance in gastric cancer and associated microRNAs.Cancer Chemother Pharmacol. 2023 Nov;92(5):329-340. doi: 10.1007/s00280-023-04572-1. Epub 2023 Aug 3. Cancer Chemother Pharmacol. 2023. PMID: 37535106 Review.
References
-
- Bargiela-Iparraguirre J., Prado-Marchal L., Fernandez-Fuente M., Gutierrez-Gonzalez A., Moreno-Rubio J., Munoz-Fernandez M., et al. (2016). CHK1 expression in Gastric Cancer is modulated by p53 and RB1/E2F1: implications in chemo/radiotherapy response. Sci. Rep. 6:21519. 10.1038/srep21519 - DOI - PMC - PubMed

