. 2018 Oct 16:9:2494.
doi: 10.3389/fmicb.2018.02494. eCollection 2018.

Altered Gut Microbiota and Compositional Changes in Firmicutes and Proteobacteria in Mexican Undernourished and Obese Children

Affiliations

Altered Gut Microbiota and Compositional Changes in Firmicutes and Proteobacteria in Mexican Undernourished and Obese Children

Eder Orlando Méndez-Salazar et al. Front Microbiol. .

Erratum in

Abstract

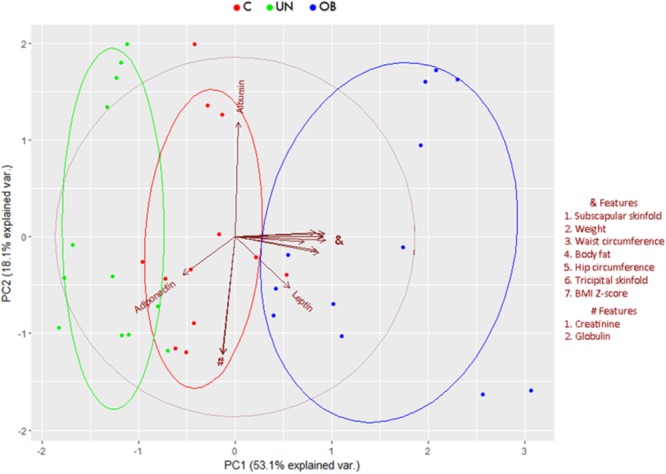
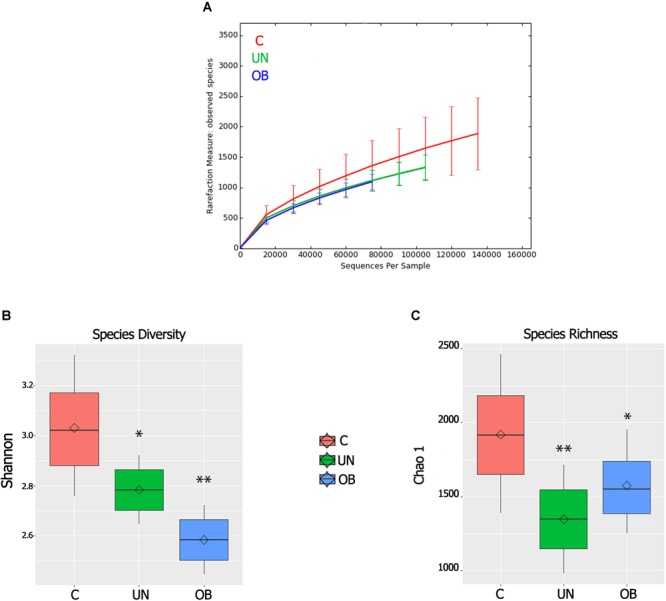
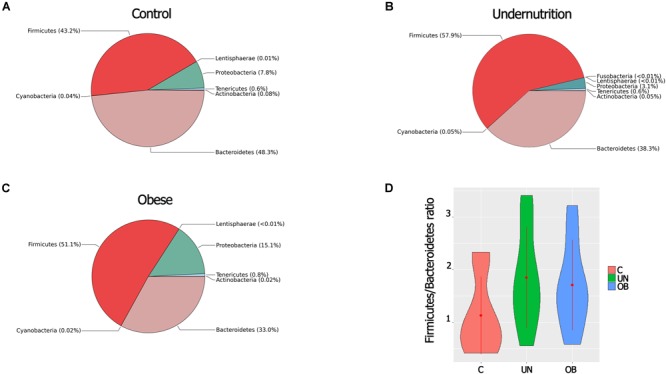
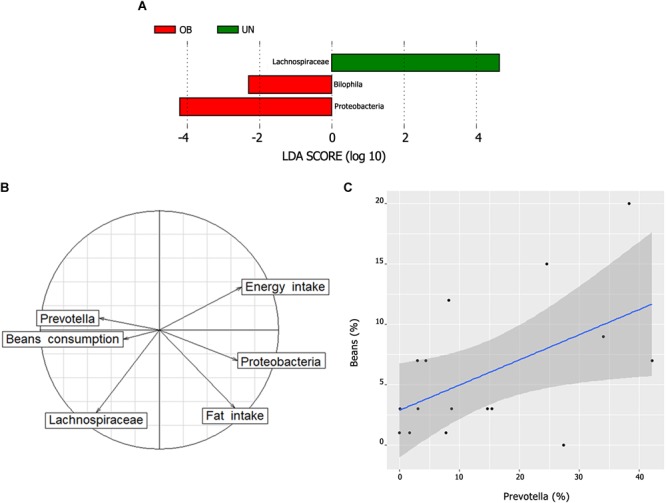
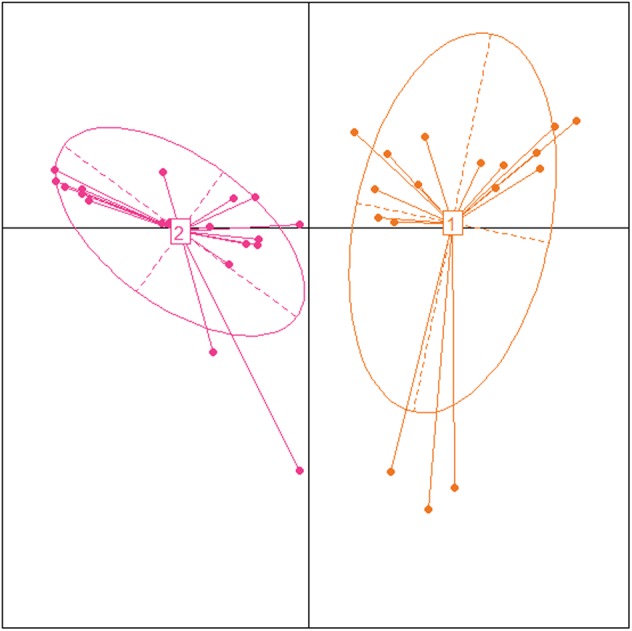
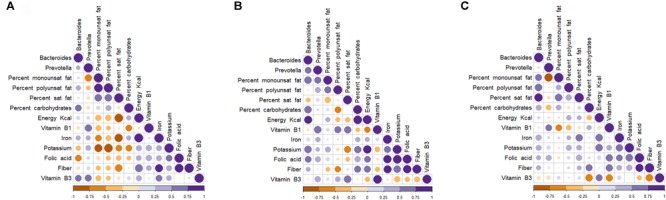
Mexico is experiencing an epidemiological and nutritional transition period, and Mexican children are often affected by the double burden of malnutrition, which includes undernutrition (15.3% of children) and obesity (13.6%). The gut microbiome is a complex and metabolically active community of organisms that influences the host phenotype. Although previous studies have shown alterations in the gut microbiota in undernourished children, the affected bacterial communities remain unknown. The present study investigated and compared the bacterial richness and diversity of the fecal microbiota in groups of undernourished (n = 12), obese (n = 12), and normal-weight (control) (n = 12) Mexican school-age children. We used next-generation sequencing to analyze the V3-V4 region of the bacterial 16S rRNA gene, and we also investigated whether there were correlations between diet and relevant bacteria. The undernourished and obese groups showed lower bacterial richness and diversity than the normal-weight group. Enterotype 1 correlated positively with dietary fat intake in the obese group and with carbohydrate intake in the undernourished group. The results showed that undernourished children had significantly higher levels of bacteria in the Firmicutes phylum and in the Lachnospiraceae family than obese children, while the Proteobacteria phylum was overrepresented in the obese group. The level of Lachnospiraceae correlated negatively with energy consumption and positively with leptin level. This is the first study to examine the gut microbial community structure in undernourished and obese Mexican children living in low-income neighborhoods. Our analysis revealed distinct taxonomic profiles for undernourished and obese children.

Keywords: Firmicutes; Mexican children; microbiota; obesity; undernourished.


Figures

FIGURE 1
FIGURE 1
Principal component biplot of biochemical, anthropometric, and hormonal variables. The first principal component accounted for 53.1% while the second principal component accounted for 18.1% variance of the performance measures data. Arrows show the contribution and correlation of each variable on the PC1 and PC2. The central circle indicates the theoretical maximum extent of the arrows. The ellipses indicate 68% confidence intervals for the study groups.
FIGURE 2
FIGURE 2
(A) Alpha rarefaction curves representing the observed number of species in the three study groups. The y-axis indicates the average number of OTUs per sample in each group. The error bars denote standard deviation. (B) Boxplots for comparison of species diversity (Shannon index) between the three study groups. (C) Boxplots for comparison of species richness (Chao1 index) between the three study groups. Diamonds indicate means and horizontal lines indicate medians denotes P < 0.05 compared to the control group; ∗∗denotes P < 0.01 compared to the control group.
FIGURE 3
FIGURE 3
(A) Comparison of microbial composition at phylum-level among the three groups [Control (A), Undernutrition (B), Obese (C)]. The pie charts show the relative proportion of each phylum detected by METAGENassist analysis. n = 12 in each group. (D) Ratio F/B of the three study groups. Error bars indicate standard error of the mean.
FIGURE 4
FIGURE 4
(A) Bacterial taxa differentially represented between the undernutrition and obesity groups identified by linear discriminant analysis (LDA) effect size (LEfSe). Only taxa with an alpha value of 0.05 and with an LDA score of at least 2 are shown. (B) Biplot of correspondence analysis (between important bacterial lineages and relevant dietary parameters). Arrows pointing to the same position indicate a positive correlation and arrows pointing to an opposite position indicate a negative correlation. (C) Correlation between beans consumption and Prevotella. The graph shows a positive correlation between the two variables (ρ = 0.52, P = 0.03) including a regression line and a 95% confidence interval represented by the shaded area.
FIGURE 5
FIGURE 5
Identification of enterotypes in Mexican children using Principal Coordinate Analysis. Samples colored by enterotype: orange color corresponds to enterotype 1 (Bacteroides) and pink color corresponds to enterotype 2 (Prevotella).
FIGURE 6
FIGURE 6
Spearman (rank) correlation matrix between enterotypes and dietary intakes in fecal samples of selected groups of children. Control (A), Undernutrition (B), Obese (C). Strong correlations are indicated by big circles, whereas weak correlations are indicated by small circles. Colors in scale bar denote the type of correlation: 1 indicates perfect positive correlation (dark purple) and –1 indicates perfect negative correlation (dark yellow).

Similar articles

Cited by

References

    1. Ahmed T. D., Auble J. A., Berkley R., Black R., Ahern P. P., Hossain M., et al. (2014). An evolving perspective about the origins of childhood undernutrition and nutritional interventions that includes the gut microbiome. Ann. N. Y. Acad. Sci. 1332 22–38. 10.1111/nyas.12487 - DOI - PMC - PubMed
    1. Arndt D., Xia J., Liu Y., Zhou Y., Guo A. C., Cruz J. A., et al. (2012). METAGENassist: a comprehensive web server for comparative metagenomics. Nucleic Acids Res. 40 W88–W95. 10.1093/nar/gks497 - DOI - PMC - PubMed
    1. Barquera S., Peterson K. E., Must A., Rogers B. L., Flores M., Houser R., et al. (2007). Coexistence of maternal central adiposity and child stunting in Mexico. Int. J. Obesity 31 601–607. 10.1038/sj.ijo.0803529 - DOI - PubMed
    1. Bokulich N. A., Subramanian S., Faith J. J., Gevers D., Gordon J. I., Knight R., et al. (2013). Quality-filtering vastly improves diversity estimates from Illumina amplicon sequencing. Nat. Methods 10 57–59. 10.1038/nmeth.2276 - DOI - PMC - PubMed
    1. Caporaso J. G., Kuczynski J., Stombaugh J., Bittinger K., Bushman F. D., Costello E. K., et al. (2010). QIIME allows analysis of high-throughput community sequencing data. Nat. Methods 75 335–336. 10.1038/nmeth.f.303 - DOI - PMC - PubMed

LinkOut - more resources