. 2018 Oct 27:11:294.
doi: 10.1186/s13068-018-1285-7. eCollection 2018.

Synthesis and techno-economic assessment of microbial-based processes for terpenes production

Affiliations

Synthesis and techno-economic assessment of microbial-based processes for terpenes production

Wenzhao Wu et al. Biotechnol Biofuels. .

Abstract

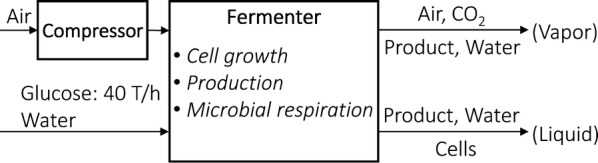
Background: Recent advances in metabolic engineering enable the production of chemicals from sugars through microbial bio-conversion. Terpenes have attracted substantial attention due to their relatively high prices and wide applications in different industries. To this end, we synthesize and assess processes for microbial production of terpenes.

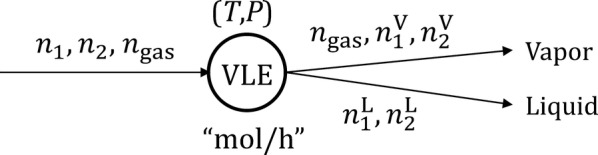
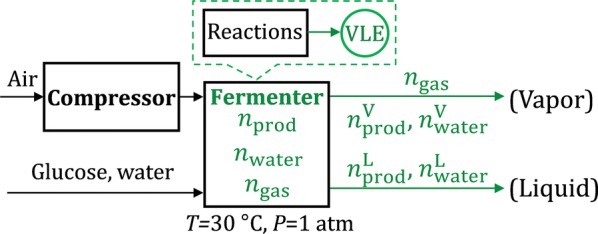
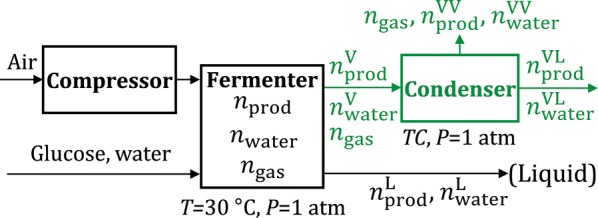
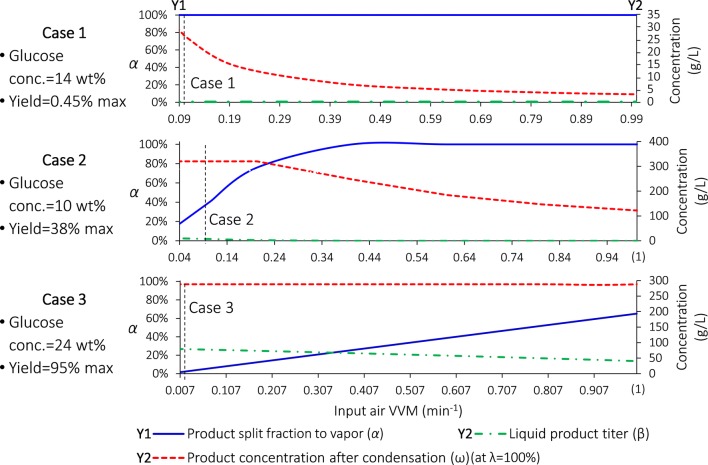
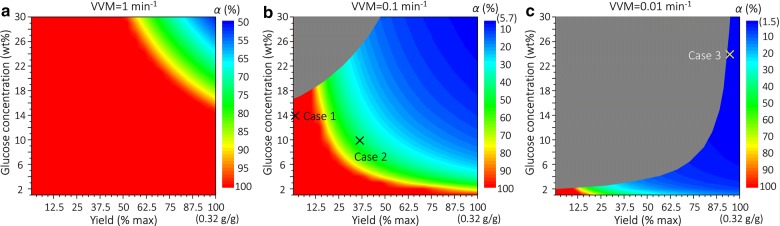
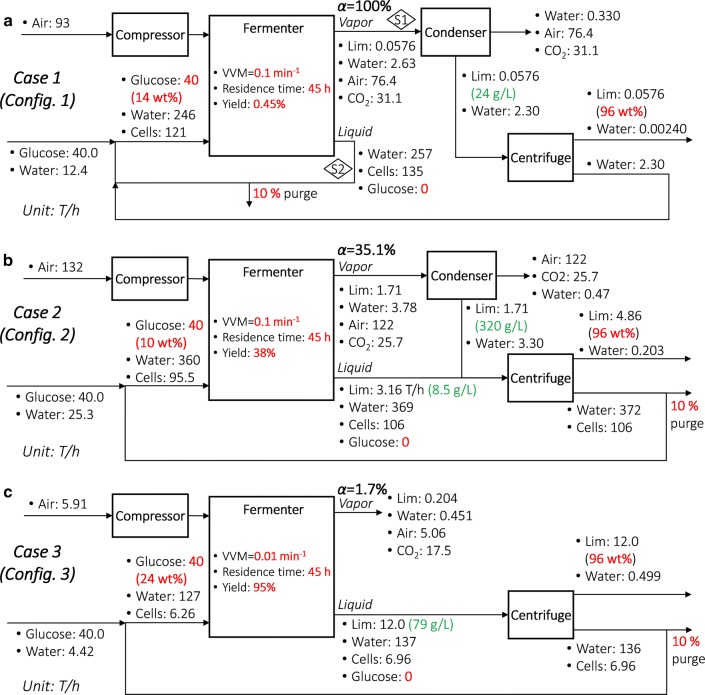
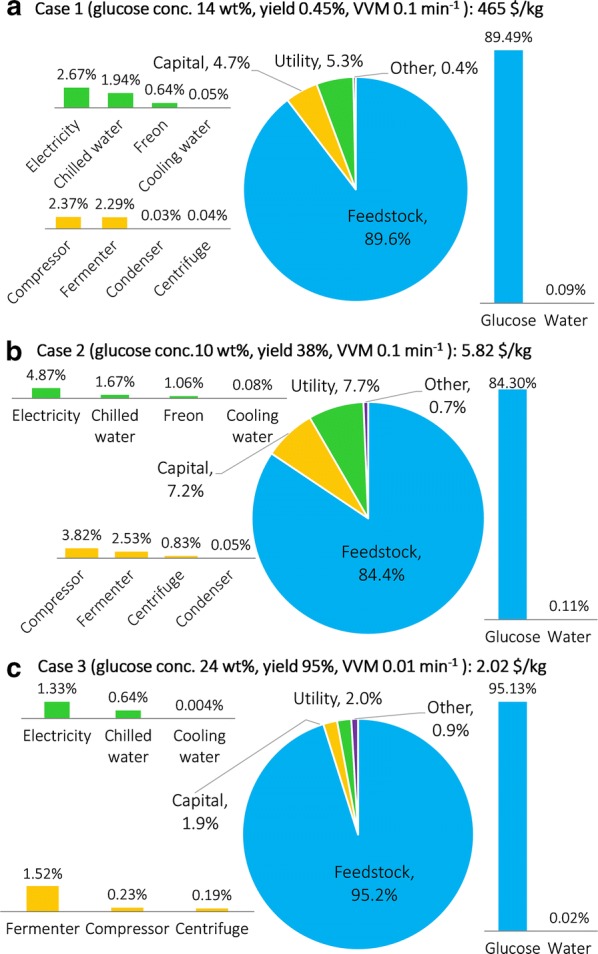
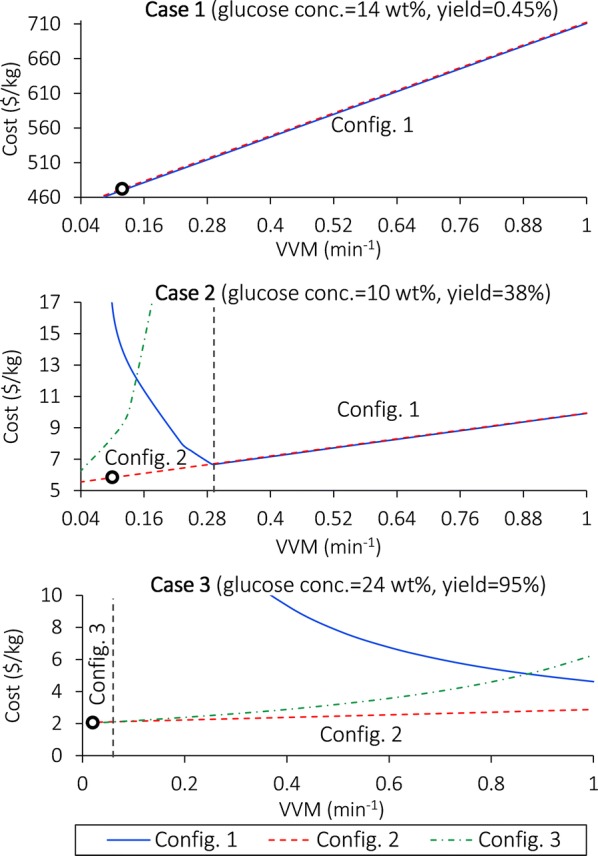
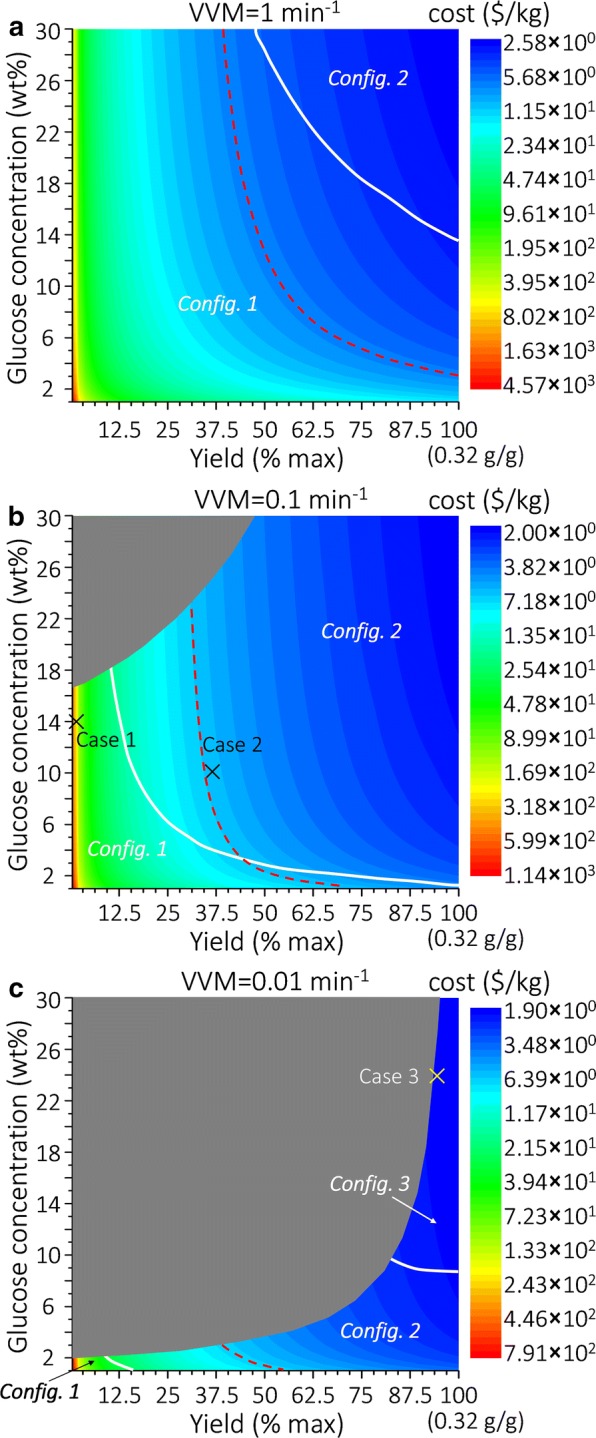
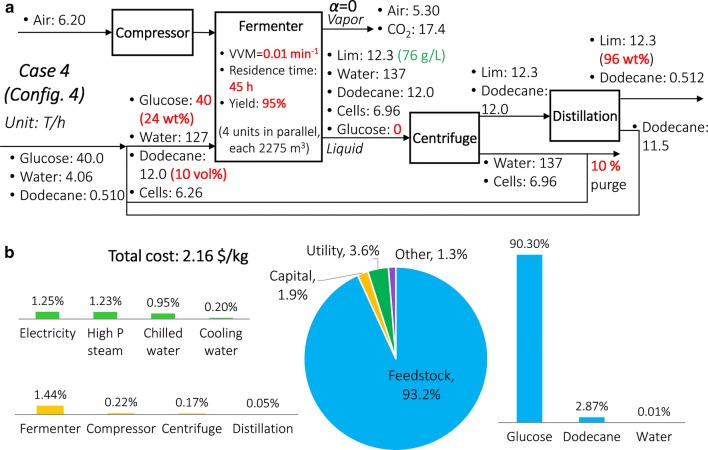
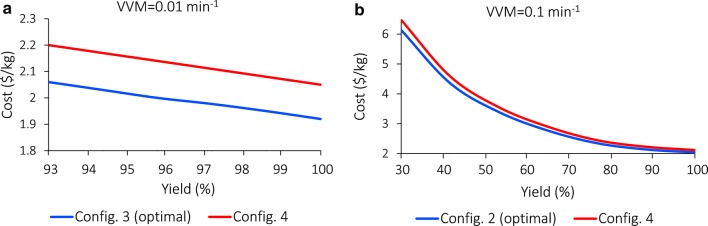
Results: To explain a counterintuitive experimental phenomenon where terpenes such as limonene (normal boiling point 176 °C) are often found to be 100% present in the vapor phase after bio-conversion (operating at only ~ 30 °C), we first analyze the vapor-liquid equilibrium for systems containing terpenes. Then, we propose alternative production configurations, which are further studied, using limonene as an example, in several case studies. Next, we perform economic assessment of the alternative processes and identify the major cost components. Finally, we extend the assessment to account for different process parameters, terpene products, ways to address terpene toxicity (microbial engineering vs. solvent use), and cellulosic biomass as a feedstock. We identify the key cost drivers to be (1) feed glucose concentration (wt%), (2) product yield (% of maximum theoretical yield) and (3) VVM (Volume of air per Volume of broth liquid per Minute, i.e., aeration rate in min-1). The production of limonene, based on current experimental data, is found to be economically infeasible (production cost ~ 465 $/kg vs. market selling price ~ 7 $/kg), but higher glucose concentration and yield can lower the cost. Among 12 terpenes studied, limonene appears to be the most reasonable short-term target because of its large market size (~ 160 million $/year in the US) and the relatively easier to achieve break-even yield (~ 30%, assuming a 14 wt% feed glucose concentration and 0.1 min-1 VVM).

Conclusions: The methods proposed in this work are applicable to a range of terpenes as well as other extracellular insoluble chemicals with density lower than that of water, such as fatty acids. The results provide guidance for future research in metabolic engineering toward terpenes production in terms of setting targets for key design parameters.

Keywords: Biphasic fermentation; Fatty acids; Isoprenoid; Limonene; Microbial production; Process simulation; Process systems engineering; Terpenoid; Vapor liquid equilibrium.


Figures

Fig. 1
Fig. 1
Bio-conversion process of terpene production, with 40 T/h glucose supply
Fig. 2
Fig. 2
VLE analysis of immiscible liquids with inert gas. The circle marked with “VLE” represents the VLE analysis module, i.e., Eqs. 6–11
Fig. 3
Fig. 3
VLE analysis applied in the fermenter. Parts related to the VLE analysis are marked in green
Fig. 4
Fig. 4
VLE analysis applied in the condenser. Parts related to the VLE analysis are marked in green. Note that nprodV and nwaterV can be calculated from the VLE analysis in the fermenter in Fig. 3
Fig. 5
Fig. 5
α, β, and ω as functions of VVM. Note that VVMMIN = 0.090, 0.040, and 0.0079 min−1 for Cases 1–3, respectively. Conc. concentration
Fig. 6
Fig. 6
Heat maps showing the influence of glucose concentration and yield on α at different VVM values. a VVM = 1 min−1; b VVM = 0.1 min−1; c VVM = 0.01 min−1. The numbers in parentheses on the color scales in b and c denote the corresponding minimum α values. Gray-shaded areas represent infeasible regions where VVM < VVMMIN (calculated using the method discussed in “Bio-conversion process” section)
Fig. 7
Fig. 7
Three process configurations. a Configuration 1 (e.g., Case 1), where the product is mainly in the vapor; b Configuration 2 (e.g., Case 2), where the product is distributed in the vapor and liquid; c Configuration 3 (e.g., Case 3), where the product is mainly in the liquid. Given parameters for each case are marked bold in red. Lim limonene. For the component flowrates in each stream, the units are T/h, and three significant figures are kept. Product concentrations in specific streams are marked in green
Fig. 8
Fig. 8
Cost distribution by cost types. a Case 1; b Case 2; c Case 3. Capital costs are annualized
Fig. 9
Fig. 9
Cost comparison between configurations with varying VVM values in different cases. The vertical dashed lines denote threshold VVM values where the cost-minimal configurations change; the optimal configurations are labeled in the corresponding regions. The three cases are represented by the small circles. Note that VVMMIN = 0.090, 0.040, and 0.0079 min−1 for Cases 1–3, respectively
Fig. 10
Fig. 10
Heat maps depicting the influence of glucose concentration and yield on configurations and costs. a VVM = 1 min−1; b VVM = 0.1 min−1; c VVM = 0.01 min−1. The color scales are plotted logarithmically. The white solid contour curves denote the boundaries where the optimal process configurations change. The red dashed curves denote break-even combinations of glucose concentration and yield. Gray-shaded areas represent infeasible regions where VVM < VVMMIN. Note that 50% yield is likely a reasonable target in the foreseeable future
Fig. 11
Fig. 11
Process configuration and economic assessment of Case 4. a Process Configuration 4; b cost distribution
Fig. 12
Fig. 12
Cost comparison between Configuration 4 and the non-solvent configuration. a Glucose concentration = 24 wt% and VVM = 0.01 min−1; b glucose concentration = 24 wt% and VVM = 0.1 min−1. Only the yield ranges that satisfy VVM > VVMMIN are shown

References

    1. Bordbar A, Monk JM, King ZA, Palsson BO. Constraint-based models predict metabolic and associated cellular functions. Nat Rev Genet. 2014;15(2):107–120. doi: 10.1038/nrg3643. - DOI - PubMed
    1. Feist AM, Palsson BO. The biomass objective function. Curr Opin Microbiol. 2010;13(3):344–349. doi: 10.1016/j.mib.2010.03.003. - DOI - PMC - PubMed
    1. Woolston BM, Edgar S, Stephanopoulos G. Metabolic engineering: past and future. Annu Rev Chem Biomol Eng. 2013;4(1):259–288. doi: 10.1146/annurev-chembioeng-061312-103312. - DOI - PubMed
    1. Yadav VG, De Mey M, Giaw Lim C, Kumaran Ajikumar P, Stephanopoulos G. The future of metabolic engineering and synthetic biology: towards a systematic practice. Metab Eng. 2012;14(3):233–241. doi: 10.1016/j.ymben.2012.02.001. - DOI - PMC - PubMed
    1. de Jong E, Higson A, Walsh P, Wellisch M. Bio-based chemicals—value added products from biorefineries. IEA Bioenergy, Task42 Biorefinery, 2012. p. 34.

LinkOut - more resources