

Case Reports
doi: 10.1016/j.radcr.2018.09.021.
eCollection 2019 Jan.
Medical treatment of brain aspergilloma followed by MRI: A case report
Affiliations
- PMID: 30386448
- PMCID: PMC6205868
- DOI: 10.1016/j.radcr.2018.09.021
Item in Clipboard
Case Reports
Medical treatment of brain aspergilloma followed by MRI: A case report
Radiol Case Rep.
.
Abstract
This is a brain aspergilloma case in an immunocompetent patient who suffered from a rare fungal infection transmitted from the mediastinum to the brain and eventually caused pancreatitis. This fungal infection affected the thalamus, hypothalamus, and extended to the midbrain. This case showed a good prognosis for the brain aspergilloma without need for any surgical intervention. The radiological documentation for the brain aspergilloma shows a positive response to a combination of voriconazole and Keppra.
Keywords: Aspergilloma; Aspergillus; Brain aspergilloma; CT; MRI.
Figures

(Forty-two-year male) The brain CT axial with contrast shows a hyperdense focus in the left thalamus and midbrain which was thought to represent hemorrhage (green arrow) at initial interpretation with surrounding hypodensity which most likely represents edema (red arrow).

(Forty-two-year male) The brain MRI axial T2 (A), coronal T2 (B) show primary focus of decreased signal intensity (red arrow) with surrounding edema of increased signal intensity (green arrow) in the thalamus and midbrain. The sagittal T1 (C) shows mixed isointense to hypointense with mild focal mass effect over the third ventricle. The axial gradient echo image (D) shows no evidence of hemorrhage. The axial FLAIR images (E, F, G) show hypointense primary focus with hyperintense surrounding edema. The DWI (H) shows edema is out of proportion to the size of the primary lesion. It shows the primary focus as hypointense with intense enhancement of the primary focus with irregular outline. The ADC map (J) the initial impression based on these images was a mass lesion, with suspicion of tumor versus infection. The sagittal and axial post contrast images respectively (K, L) show bright homogenous enhancement with irregular outline due to necrosis and fungal vascular involvement. (For interpretation of the references to color in this figure legend, the reader is referred to the web version of this article.)

(Forty-two-year male) The brain MRI perfusion rCBV maps show the primary lesion as focus decreased of values compared to normal appearance of the white matter (yellow arrow). Based on this observation, the possibility of infection like tuberculosis was considered as first possibility. (For interpretation of the references to color in this figure legend, the reader is referred to the web version of this article.)

(Forty-two-year male) The chest CT axial with contrast shows bilateral hilar and subcarinal lymphadenopathy. Soft tissue or lung window (A, B) and mediastinal window (C-J). The CT shows bilateral hilar (blue arrows), and subcarinal (red arrow) lymphadenopathy with very low-density center suggestive of necrosis. There is also partial atelectasis (green arrow) in the right middle lobe. The findings are thought to be due to infective process like tuberculosis. (For interpretation of the references to color in this figure legend, the reader is referred to the web version of this article.)

(Forty-two-year male) The brain MRI axial T2 (A), sagittal T2 (B, C), axial ADC map (D), axial DWI (E, F), coronal T2 (G), axial T2 (H), and axial FLAIR (I) show a remarkable resolution of surrounding edema around the lesion with some decrease in size of the enhancing lesion (red arrow) in the midbrain. The center of the lesion is hyperintense on T2 and FLAIR images and pattern of enhancement has also changed from the previous scan with central non-enhancing area and ring enhancement. The focus of diffusion restriction is seen in the splenium of corpus callosum (blue arrow). (For interpretation of the references to color in this figure legend, the reader is referred to the web version of this article.)

(Forty-two-year male) The chest HRCT sagittal (A, B) and coronal (C, D) show a significant resolution of the collapsed lateral segment of the right middle lobe with no sign of hilar or mediastinal lymphadenopathy.
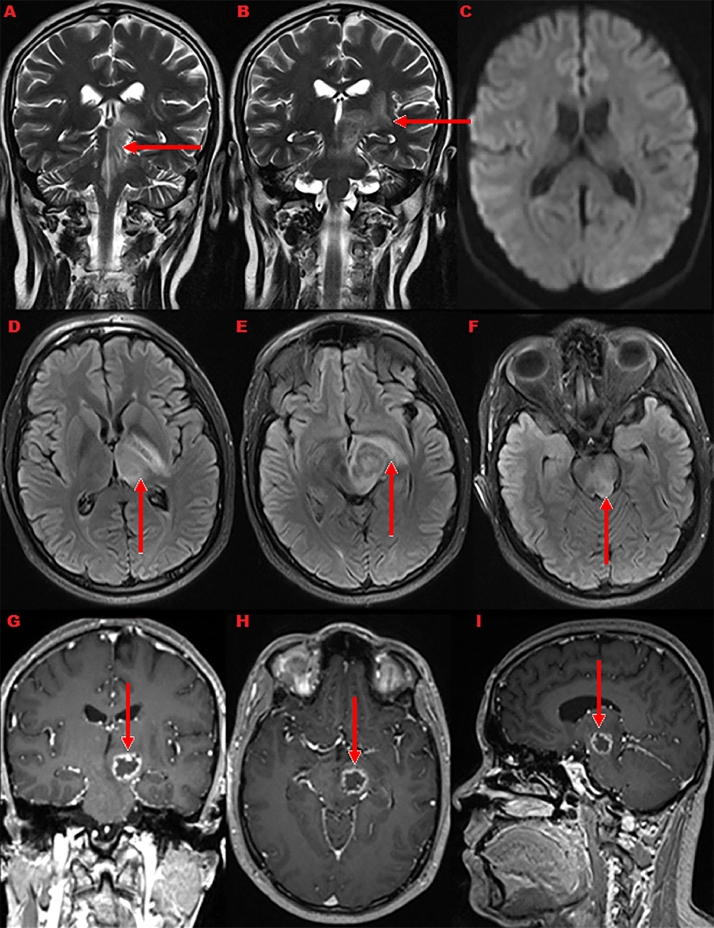
(Forty-three-year male) The brain MRI coronal T2 (A, B), DWI axial (C), axial FLAIR (D, E, F), coronal T1 with contrast (G), axial T1 with contrast (H), and sagittal T1 with contrast (I) show the brain lesion still with same size and increased the edema. The coronal T2 and axial FLAIR images show increased edema around the lesion compared to previous study. The enhancing lesion remains almost same in size and pattern. The diffusion restricted focus in the splenium of corpus callosum has resolved (C).

(Forty-three-year male) The brain MRI coronal T1 with contrast (A), axial T1 with contrast (B), sagittal T1 with contrast (C), axial FLAIR (D), sagittal T1 without contrast (E), and axial T2 (F) show remarkable decrease in the surrounding edema with minimal decrease in size of the ring enhancing lesion.

(Forty-three-year male) The brain MRI coronal T1 with contrast (A), axial T1 with contrast (B), Sagittal T1 with contrast (C), coronal T1 (D), axial T1 with contrast (E), sagittal T1 with contrast (F), coronal T2 (G), axial T2 (H), axial T1 (I), and axial T1 (J) show shrinking of the midbrain aspergilloma.

(Forty-three-year male) The brain MRI axial T1 with contrast (A), axial T1 with contrast (B), sagittal T1 with contrast (C), sagittal T1 with contrast (D), coronal T2 (E), and axial T2 (F) show the midbrain lesion as small hyperintense dot on T1 (red arrow). (For interpretation of the references to color in this figure legend, the reader is referred to the web version of this article.)

(Forty-three-year-male) The abdomen CT axial at the level of the pancreatic tail (A) and pancreas (B) show the pancreatic borders diffusely swollen with peripancreatic fat stranding (green arrow) and homogenous post contrast enhancement with definite hemorrhagic or necrotic areas (red arrow). The picture is suggestive of acute pancreatitis for clinicolaboratory correlation. (For interpretation of the references to color in this figure legend, the reader is referred to the web version of this article.)
References
-
- Scully E.P., Baden L.R., Katz J.T. Fungal brain infections. Curr Opin Neurol. 2008;21(3):34752. - PubMed
-
- Shamim M.S., Siddiqui A.A., Enam S.A., Shah A.A., Jooma R., Anwar S. Craniocerebral aspergillosis in immunocompetent hosts: surgical perspective. Neurol India. 2007;55(3):274. - PubMed
-
- Shankar S.K., Mahadevan A., Sundaram C., Sarkar C., Chacko G., Lanje- war D.N. Pathobiology of fungal infections of the central nervous system with special reference to the Indian scenario. Neurol India. 2007;55(3):198. - PubMed
-
- Speth C., Rambach G., Lass-Flrl C., Wrzner R., Gasque P., Mohsenipour I. Culture supernatants of patient-derived Aspergillus isolates have toxic and lytic activity towards neurons and glial cells. FEMS Immunol Med Microbiol. 2000;29(4):30313. - PubMed
-
- Sorensen A.G., Buonanno F.S., Gonzalez R.G., Schwamm L.H., Lev M.H., Huang-Hellinger F.R. Hyperacute stroke: evaluation with combined multisection diffusion-weighted and hemodynamically weighted echo-planar MR imaging. Radiology. 1996;199(2) - PubMed
Publication types
LinkOut - more resources
Full Text Sources
Molecular Biology Databases
