. 2019 Jun;75(2):613-624.
doi: 10.1111/biom.12995. Epub 2019 Mar 29.

Log-ratio lasso: Scalable, sparse estimation for log-ratio models

Affiliations

Log-ratio lasso: Scalable, sparse estimation for log-ratio models

Stephen Bates et al. Biometrics. 2019 Jun.

Abstract

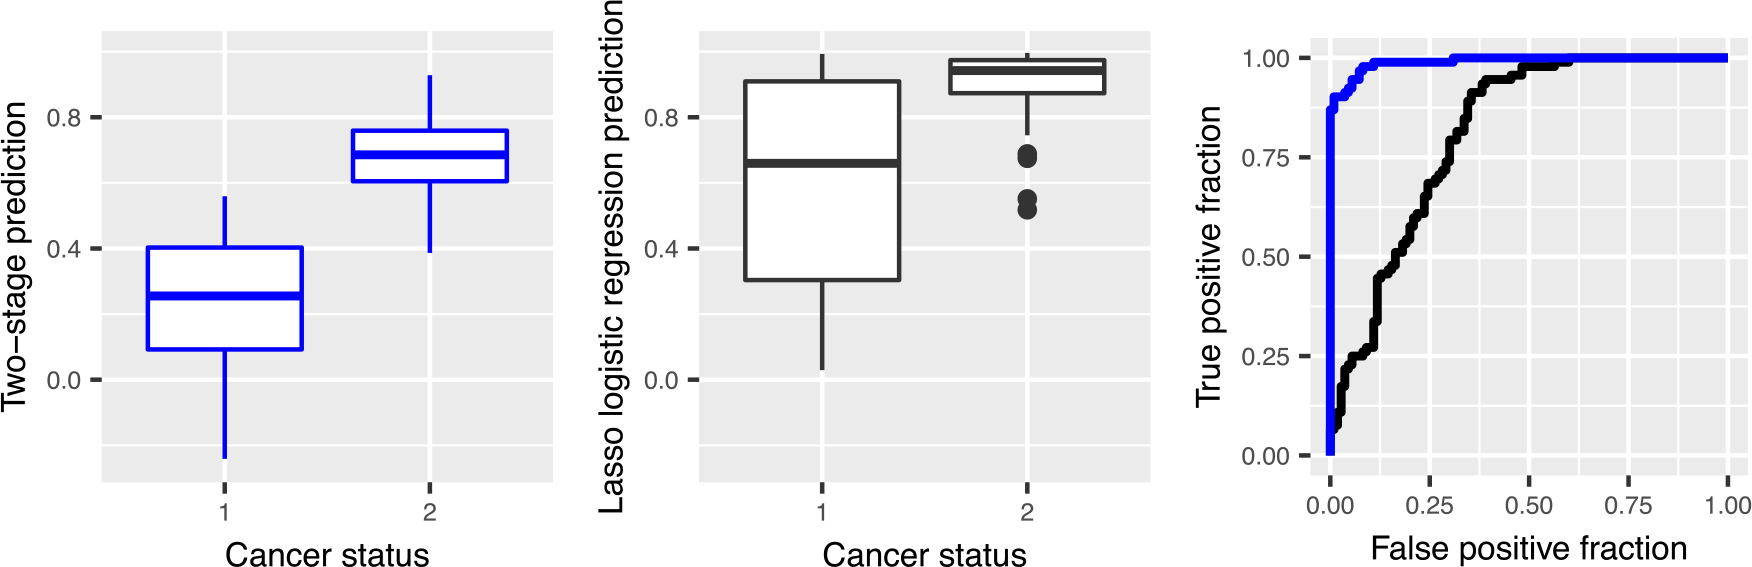
Positive-valued signal data is common in the biological and medical sciences, due to the prevalence of mass spectrometry other imaging techniques. With such data, only the relative intensities of the raw measurements are meaningful. It is desirable to consider models consisting of the log-ratios of all pairs of the raw features, since log-ratios are the simplest meaningful derived features. In this case, however, the dimensionality of the predictor space becomes large, and computationally efficient estimation procedures are required. In this work, we introduce an embedding of the log-ratio parameter space into a space of much lower dimension and use this representation to develop an efficient penalized fitting procedure. This procedure serves as the foundation for a two-step fitting procedure that combines a convex filtering step with a second non-convex pruning step to yield highly sparse solutions. On a cancer proteomics data set, the proposed method fits a highly sparse model consisting of features of known biological relevance while greatly improving upon the predictive accuracy of less interpretable methods.

Keywords: compositional data; lasso; log-ratio; mass spectrometry; variable selection.


Figures

FIGURE 1
FIGURE 1
Results from the numerical example of Subsection 5.2. The left panel corresponds to the log-ratio model with one signal, in which case the null hypothesis holds whenever the first two features are both selected. The right panel corresponds to a single unpaired signal, in which case the null hypothesis does not hold.
FIGURE 2
FIGURE 2
Results of experiment 1: MSE and support recovery of log-ratio lasso in the sparse log-ratio model. The “large signal recovery” and “small signal recovery” graphs report the proportion of times that the true large signal and true small signal are selected, respectively. The “nulls selected” graph shows the average fraction of null variables that are selected.
FIGURE 3
FIGURE 3
Results of experiment 3, a comparison of the runtime of 10 steps of the approximate forward stepwise selection and standard forward stepwise procedure (left) and naïve lasso versus constrained lasso fitting (right). Fitting for forward stepwise selection and naïve lasso are done on the expanded feature set of all log-ratios, which is of size (dimension2). Runtimes are from a Macbook pro with 3.3 GHz Intel Core i7 processor. Forward stepwise selection was fit using the leaps(Lumley, 2017) R package and lasso was fit with the glmnet(Friedman et al., 2010) R package. We note that glmnet is internally running FORTRAN code, which accounts for the large difference in runtime among the methods in the left versus right panels.
FIGURE 4
FIGURE 4
A comparison of the selection paths from lasso logistic regression (left) and the single stage log-ratio lasso (right). The top horizontal labels indicate how many variables are in the model at each point along the path. Dashed vertical lines indicate the tuning parameter selected by cross-validation. The coefficients of glucose and citrate for the optimal value of the tuning parameter are marked with large circles. Notice that citrate is not easily picked out on the left plot, but it is easily picked out on the right.
FIGURE 5
FIGURE 5
A comparison of the predictions on a validation set generated by lasso logistic regression (black) and two-stage log-ratio lasso (blue) using box plots and ROC curves. The AUC is 0.81 for lasso logistic regression and 0.99 for two-stage log-ratio lasso.

References

    1. Aitchison J (1982). The statistical analysis of compositional data. J R Stat Soc Ser B (Methodol) 44, 139–177.
    1. Aitchison J (1983). Principal component analysis of compositional data. Biometrika 70, 57–65.
    1. Aitchison J and Bacon-shone J (1984). Log contrast models for experiments with mixtures. Biometrika 71, 323–330.
    1. Akaike H (1974). A new look at the statistical model identification. IEEE Trans Autom Control 19, 716–723.
    1. Banerjee S, Zare RN, Tibshirani RJ, Kunder CA, Nolley R, Fan R, Brooks JD, and Sonn GA (2017). Diagnosis of prostate cancer by desorption electrospray ionization mass spectrometric imaging of small metabolites and lipids. Proc Natl Acad Sci 114, 3334–3339. - PMC - PubMed

Publication types