Assessment of cortical bone microdamage following insertion of microimplants using optical coherence tomography: a preliminary study
- PMID: 30387332
- PMCID: PMC6238111
- DOI: 10.1631/jzus.B1700612
Assessment of cortical bone microdamage following insertion of microimplants using optical coherence tomography: a preliminary study
Abstract
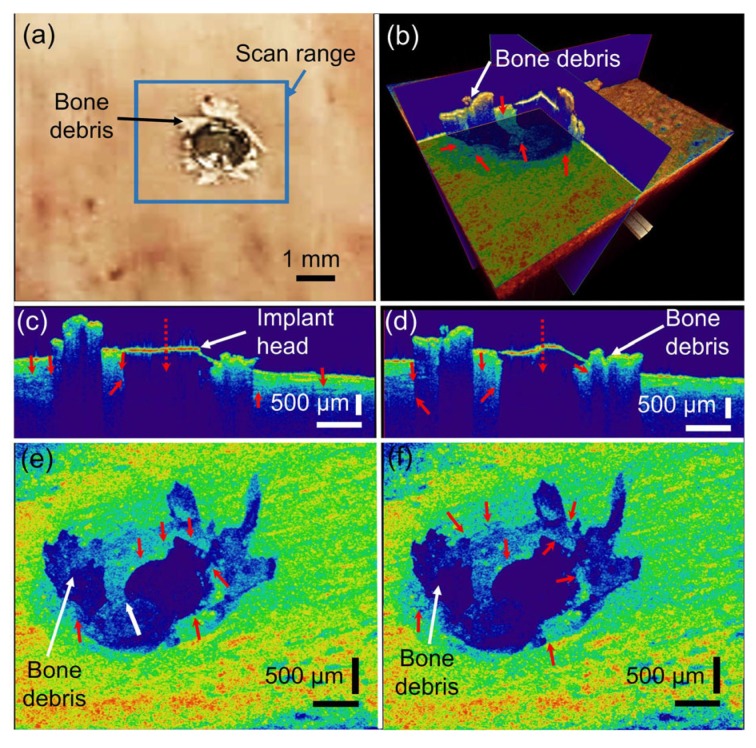
Objectives: The study was done to evaluate the efficacy of optical coherence tomography (OCT), to detect and analyze the microdamage occurring around the microimplant immediately following its placement, and to compare the findings with micro-computed tomography (μCT) images of the samples to validate the result of the present study.
Methods: Microimplants were inserted into bovine bone samples. Images of the samples were obtained using OCT and μCT. Visual comparisons of the images were made to evaluate whether anatomical details and microdamage induced by microimplant insertion were accurately revealed by OCT.
Results: The surface of the cortical bone with its anatomical variations is visualized on the OCT images. Microdamage occurring on the surface of the cortical bone around the microimplant can be appreciated in OCT images. The resulting OCT images were compared with the μCT images. A high correlation regarding the visualization of individual microcracks was observed. The depth penetration of OCT is limited when compared to μCT.
Conclusions: OCT in the present study was able to generate high-resolution images of the microdamage occurring around the microimplant. Image quality at the surface of the cortical bone is above par when compared with μCT imaging, because of the inherent high contrast and high-resolution quality of OCT systems. Improvements in the imaging depth and development of intraoral sensors are vital for developing a real-time imaging system and integrating the system into orthodontic practice.
Keywords: Optical coherence tomography; Microimplant; Cortical bone; Micro-computed tomography.
Conflict of interest statement
This article does not contain any studies with human or animal subjects performed by any of the authors.
Figures


Similar articles
-
3-Dimensional characterization of cortical bone microdamage following placement of orthodontic microimplants using Optical Coherence Tomography.Sci Rep. 2019 Mar 1;9(1):3242. doi: 10.1038/s41598-019-39670-9. Sci Rep. 2019. PMID: 30824805 Free PMC article.
-
Assessment of subchondral bone microdamage quantification using contrast-enhanced imaging techniques.J Anat. 2024 Jul;245(1):58-69. doi: 10.1111/joa.14035. Epub 2024 Mar 13. J Anat. 2024. PMID: 38481117 Free PMC article.
-
Contrast-enhanced micro-computed tomography of fatigue microdamage accumulation in human cortical bone.Bone. 2011 Mar 1;48(3):443-50. doi: 10.1016/j.bone.2010.10.160. Epub 2010 Oct 15. Bone. 2011. PMID: 20951850
-
Application of micro-CT in small animal imaging.Methods. 2010 Jan;50(1):2-13. doi: 10.1016/j.ymeth.2009.08.007. Epub 2009 Aug 23. Methods. 2010. PMID: 19706326 Review.
-
Multiscale imaging of bone microdamage.Connect Tissue Res. 2015 Apr;56(2):87-98. doi: 10.3109/03008207.2015.1008133. Epub 2015 Feb 9. Connect Tissue Res. 2015. PMID: 25664772 Free PMC article. Review.
Cited by
-
Application of three-dimensional reconstruction technology in dentistry: a narrative review.BMC Oral Health. 2023 Sep 4;23(1):630. doi: 10.1186/s12903-023-03142-4. BMC Oral Health. 2023. PMID: 37667286 Free PMC article. Review.
-
Analysis of Enamel Loss by Prophylaxis and Etching Treatment in Human Tooth Using Optical Coherence Tomography: An In Vitro Study.J Healthc Eng. 2019 Mar 6;2019:8973825. doi: 10.1155/2019/8973825. eCollection 2019. J Healthc Eng. 2019. PMID: 30956785 Free PMC article.
-
Diagnostic value of optic disc retinal nerve fiber layer thickness for diabetic peripheral neuropathy.J Zhejiang Univ Sci B. 2020 Nov.;21(11):911-920. doi: 10.1631/jzus.B2000225. J Zhejiang Univ Sci B. 2020. PMID: 33150774 Free PMC article.
References
-
- Choi KS, Wijesinghe RE, Lee C, et al. In vivo observation of metamorphosis of Plodia interpunctella Hübner using three-dimensional optical coherence tomography. Entomol Res. 2017;47(4):256–262. doi: 10.1111/1748-5967.12220. - DOI
Publication types
MeSH terms
Substances
LinkOut - more resources
Full Text Sources