. 2018 Nov;126(11):117001.
doi: 10.1289/EHP3953.

Evaluation of Bisphenol A (BPA) Exposures on Prostate Stem Cell Homeostasis and Prostate Cancer Risk in the NCTR-Sprague-Dawley Rat: An NIEHS/FDA CLARITY-BPA Consortium Study

Affiliations

Evaluation of Bisphenol A (BPA) Exposures on Prostate Stem Cell Homeostasis and Prostate Cancer Risk in the NCTR-Sprague-Dawley Rat: An NIEHS/FDA CLARITY-BPA Consortium Study

Gail S Prins et al. Environ Health Perspect. 2018 Nov.

Abstract

Background: Previous work determined that early life exposure to low-dose Bisphenol A (BPA) increased rat prostate cancer risk with aging. Herein, we report on prostate-specific results from CLARITY-BPA (Consortium Linking Academic and Regulatory Insights on BPA Toxicity), which aims to resolve uncertainties regarding BPA toxicity.

Objectives: We sought to a) reassess whether a range of BPA exposures drives prostate pathology and/or alters prostatic susceptibility to hormonal carcinogenesis, and b) test whether chronic low-dose BPA targets prostate epithelial stem and progenitor cells.

Methods: Sprague-Dawley rats were gavaged daily with vehicle, ethinyl estradiol (EE) or [Formula: see text] BPA/kg-BW during development or chronically, and prostate pathology was assessed at one year. One developmentally exposed cohort was given testosterone plus estradiol ([Formula: see text]) implants at day 90 to promote carcinogenesis with aging. Epithelial stem and progenitor cells were isolated by prostasphere (PS) culture from dorsolateral prostates (DLP) of rats continuously exposed for six months to [Formula: see text] BPA/kg-BW. Gene expression was analyzed by quantitative real time reverse transcription polymerase chain reaction (qRT-PCR).

Results: Exposure to BPA alone at any dose did not drive prostate pathology. However, rats treated with EE, 2.5, 250, or [Formula: see text] BPA/kg-BW plus [Formula: see text] showed greater severity of lateral prostate intraepithelial neoplasia (PIN), and DLP ductal adenocarcinoma multiplicity was markedly elevated in tumor-bearing rats exposed to [Formula: see text]-BW. DLP stem cells, assessed by PS number, doubled with chronic EE and [Formula: see text] exposures. PS size, reflecting progenitor cell proliferation, was greater at 25 and [Formula: see text] BPA doses, which also shifted lineage commitment toward basal progenitors while reducing luminal progenitor cells.

Conclusions: Together, these results confirm and extend previous evidence using a rat model and human prostate epithelial cells that low-dose BPA augments prostate cancer susceptibility and alters adult prostate stem cell homeostasis. Therefore, we propose that BPA exposures may contribute to the increased carcinogenic risk in humans that occurs with aging. https://doi.org/10.1289/EHP3953.


Figures
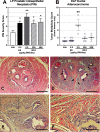
Figure 1A is a bar graph with mean plus or minus S E M plotting PIN severity score (y-axis) across exposure to Vehicle, EE, and BPA (micrograms per kilogram body weight per day; x-axis) for LP prostatic intraepithelial neoplasia. Figure 1B is a bar graph with mean plus or minus S E M plotting tumor multiplicity score (y-axis) across exposure to Vehicle, EE, and BPA (micrograms per kilogram body weight per day; x-axis) for DLP ductal adenocarcinoma. Figures 1C to 1F are histology images.
Figure 1.
Pathology in prostates of Set 3 rats (stop-dose BPA, T+E at PND 90) at one year of age. Severity scores of lateral lobe PIN lesions (A) and Multiplicity of dorsolateral ductal adenocarcinoma (tumor bearers only); (B) in rats given vehicle (Veh), ethinyl estradiol (EE), or 2.5, 250, or 25,000μgBPA/kg-body weight (BW) during development in comparison with vehicle controls. A: Bars represent the mean±SEM. *P<0.05, **P<0.01 vs. controls as determined by one-way ANOVA followed by Dunnett’s multiple comparisons test. N # in () for each group: Veh (16), EE (17), and BPA at 2.5 (6), 250 (12), and 25,000 (9) μg/kg-BW. B: The black line represents the mean±SEM, and each circle represents tumor number/rat. **P<0.01 vs. controls as determined by Fischer Exact test with Bonferroni correction for multiple comparisons. N # in () for each group: Veh (8), EE (7), and BPA at 2.5 (3), 250 (4), and 25,000 (3) μg/kg-BW. C–F: Representative images of the histology of the periurethral prostatic ducts. C: Periurethral area of a developmental vehicle control rat treated with adult T+E showing no tumors; bar=1,000μm D: Periurethral area of rat treated with 2.5μgBPA/kg-BW developmentally and T+E in adulthood. Multiple adenocarcinomas (arrowheads) are observed in the dorsolateral prostate (DLP) ducts; a DLP tumor (in box) is shown in higher magnification in E; bar=1,000μm. E: Small adenocarcinoma originating from a prostatic duct in the periurethral area of a rat treated with 2.5μgBPA/kg-BW plus adult T+E; bar=200μm. F: Higher power image of the adenocarcinoma in the panel E inset showing strands and nests of cancer cells invading the surrounding stroma; bar=100μm.
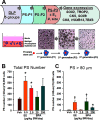
Figure 2A is a flowchart. Figures 2B and 2C are bar graphs with mean plus or minus S E M plotting PS numbers greater than 40 micrometers per 10,000 cells (y-axis) across exposure to vehicle, EE, and BPA (micrograms per kilogram body weight per day; x-axis) for total PS numbers and PS greater than 80 micrometers respectively.
Figure 2.
A: Experimental design for stem cell assessment in 6 mo old rat dorsolateral prostates (DLP) following daily gavage with vehicle (Veh), ethinyl estradiol (EE) or 2.5, 25, or 250μgBPA/kg-body weight (BW) (see Methods for details). B: Total prostasphere numbers (>40μm) in the third generation (P3) prostasphere (PS) cultures from the 5 treatment groups. *P<0.02 vs. vehicle as determined using Welch’s one-way ANOVA followed by Games-Howell multiple comparisons tests. C: Measurement of large sized P3-PS (>80μm) from DLPs exposed in vivo to Veh, EE, or 2.5, 25, or 250μgBPA/kg-BW. All graphs represent mean±SEM. †P<0.01 vs. vehicle, *P<0.02 vs. vehicle as determined by Welch’s one-way followed by Games-Howell multiple comparisons test. N # in () for each group: vehicle (4), EE (5). and BPA at 2.5 (5), 25 (3). and 250 (5) μg/kg-BW.
Figures 3A and 3B are bar graphs with mean plus or minus S E M plotting mRNA levels (fold change) (y-axis) across exposure to vehicle, EE, and BPA (micrograms per kilogram; x-axis) for basal progenitor markers and luminal progenitor markers, respectively. Figure 3C is a schematic diagram.
Figure 3.
Gene expression in passage 3 prostaspheres (PS) as determined by qRT-PCR from the 5 treatment groups. Expression levels of basal progenitor markers (relative to CK5 expression) (A) or luminal progenitor markers (relative to CK8 expression) (B) in PS from rats exposed to Veh, ethinyl estradiol (EE). or 2.5, 25. or 250μgBPA/kg-body weight (BW). The N# for each group are the same as in Figure 2. *P<0.05, †P<0.01, ‡P<0.001 vs. vehicle as determined by ANOVA followed by Tukey-Kramer multiple comparisons test. All graphs represent mean±SEM. C: A schematic representation of the effects of in vivo BPA exposure on prostate stem cell numbers and lineage commitment of progenitor cells. Chronic BPA exposures at the 2.5μg dose increase stem cell numbers, whereas 25μg or 250μgBPA/kgBW exposures favor a basal progenitor lineage of stem cell progeny implicating a reprogramming of prostate stem cell population by BPA in a dose-dependent manner.
Figure 4A is a bar graph with mean plus or minus S E M plotting PS numbers greater than 40 micrometers per 10,000 cells (y-axis) across exposure to vehicle, EE, and BPA (micrograms per kilogram; x-axis) for total PS numbers in vehicle and 1 nanomolar E2. Figures 4B and 4C are bar graphs with mean plus or minus S E M plotting mRNA levels (fold change) (y-axis) across exposure to vehicle, EE, and BPA (micrograms per kilogram; x-axis) for basal progenitor markers and luminal progenitor markers, respectively.
Figure 4.
Total PS numbers and gene expression patterns in DLP-generated prostaspheres (PS) exposed in vitro to 1nM estradiol-17β (E2) during passage 3 of spheroid culture. A: Total PS numbers following 7 d of exposure to E2 to PS grown from rats exposed in vivo to vehicle (Veh), ethinyl estradiol (EE), or 2.5, 25, or 250μgBPA/kg-bodyweight (BW). *P<0.02 vs. vehicle-control group; †P<0.005 vs. Vehicle+1nM E2 by one-way ANOVA followed by Games-Howell multiple comparisons test. B and C: Gene expression in PS from rats exposed in vivo to Veh, ethinyl estradiol (EE), or 2.5, 25, or 250μgBPA/kg-bodyweight (BW) with exposure to E2 in vitro for that last 7 d of culture. B: Basal progenitor cell marker expression. C: Luminal progenitor cell marker expression. All graphs represent mean±SEM. The N # for each group are the same as in Figure 2. *P<0.05, + P<0.01, ‡P<0.001 vs. vehicle as determined by one-way ANOVA followed by Tukey-Kramer multiple comparisons test.
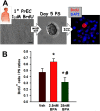
Figure 5A is a flowchart; Figure 5B is a bar graph with mean plus or minus S E M plotting BrdU positive cells per PS ratios (y-axis) across exposure to vehicle, EE, and BPA (micrograms per kilogram; x-axis).
Figure 5.
Human prostasphere stem cell response to bisphenol A (BPA) exposure in vitro. A: Schematic representation of the BrdU+ label retaining assay. Donor human prostates are collected, and epithelial cells place in primary culture (1° PrEC) with 1μM BrdU for 10 d. Cells are transferred to 3D culture without BrdU for 5 d to form spheroids as described in Methods. Rapidly dividing progenitor cells washout BrdU label, and the primary stem cells remain relatively quiescent after initial symmetrical or asymmetrical self-renewal to form daughter progenitors, thus retaining the BrdU label long term. Immunohistochemistry for BrdU identifies the stem cell within spheroids which is quantified/PS. B: BrdU+ label-retaining stem cell numbers in human PS following in vitro exposure to 2.5 or 25nM BPA. All graphs represent mean±SEM. *P<0.05 vs. vehicle control; #P<0.05 vs. 2.5nM BPA as determined by ANOVA followed by Tukey-Kramer multiple comparisons test.

References

    1. Acconcia F, Pallottini V, Marino M. 2015. Molecular mechanisms of action of BPA. Dose Response 13(4):1559325815610582, PMID: 26740804, 10.1177/1559325815610582. - DOI - PMC - PubMed
    1. Acevedo N, Davis B, Schaeberle CM, Sonnenschein C, Soto AM. 2013. Perinatally administered bisphenol A as a potential mammary gland carcinogen in rats. Environ Health Perspect 121(9):1040–1046, PMID: 23876597, 10.1289/ehp.1306734. - DOI - PMC - PubMed
    1. Alonso-Magdalena P, Ropero AB, Soriano S, García-Arévalo M, Ripoll C, Fuentes E, et al. 2012. Bisphenol-A acts as a potent estrogen via non-classical estrogen triggered pathways. Mol Cell Endocrinol 355(2):201–207, PMID: 22227557, 10.1016/j.mce.2011.12.012. - DOI - PubMed
    1. Arambula SE, Belcher SM, Planchart A, Turner SD, Patisaul HB. 2016. Impact of low dose oral exposure to bisphenol A (BPA) on the neonatal rat hypothalamic and hippocampal transcriptome: a CLARITY-BPA consortium study. Endocrinology 157(10):3856–3872, PMID: 27571134, 10.1210/en.2016-1339. - DOI - PMC - PubMed
    1. Aungst J, Twaroski ML. 2009. “Bisphenol A (CAS RN. 80-05-7): Review of low dose studies memorandum.” Washington, DC:U.S. Food and Drug Administration, Document 1 FDA-2010-N-0100-0001; pg 1–86, https://www.regulations.gov/document?D=FDA-2010-N-0100-0006 [accessed April 2018].

Publication types