

Crop fertilization affects pollination service provision - Common bean as a case study
- PMID: 30388124
- PMCID: PMC6214648
- DOI: 10.1371/journal.pone.0204460
Crop fertilization affects pollination service provision - Common bean as a case study
Abstract
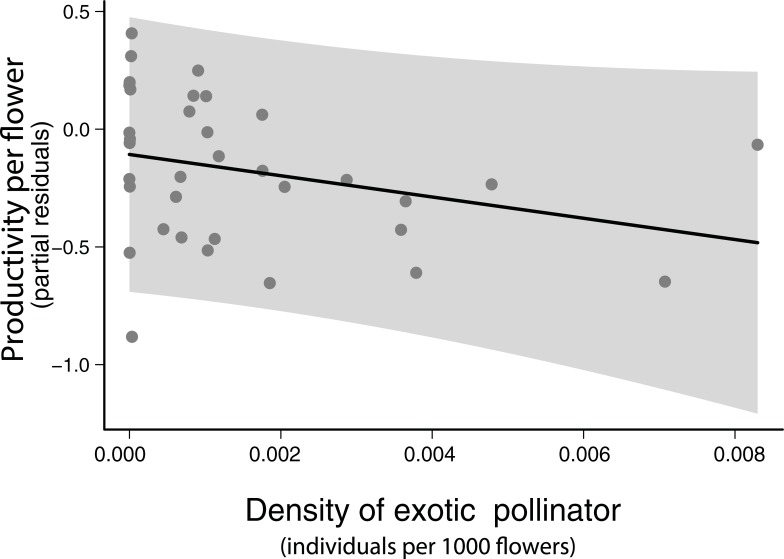
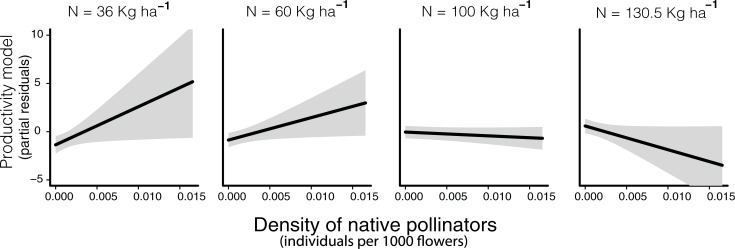
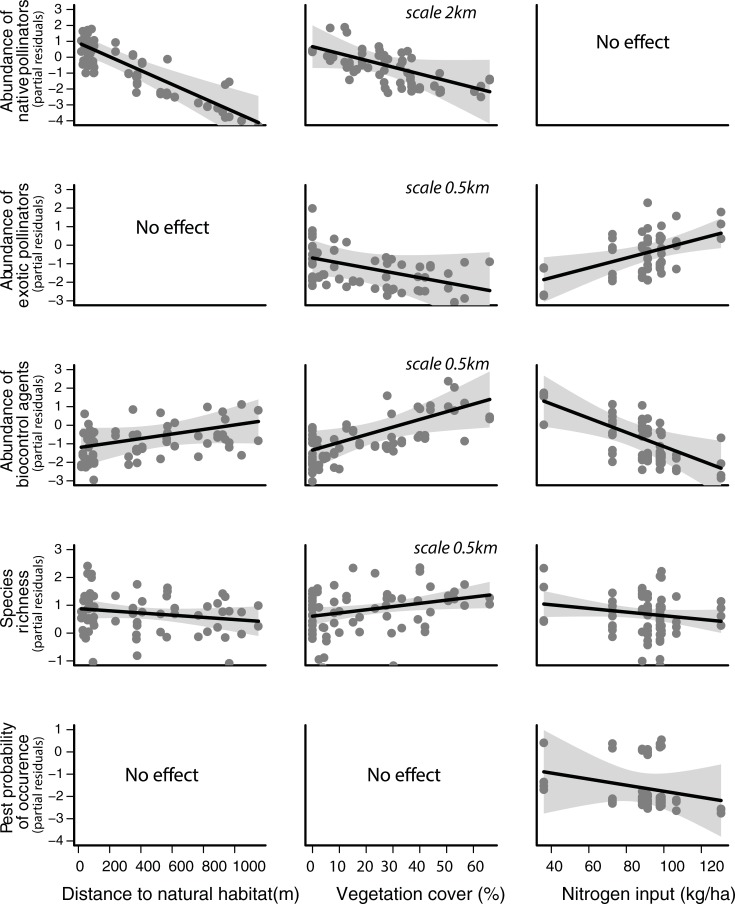
The demand for insect-pollinated crops is increasing. Conventional agricultural intensification heavily relies on increased input of fertilizers, which can have negative effects on local biodiversity. Such effects may be particularly accentuated in biodiversity hotspots that are naturally nutrient-poor. Ecological intensification of farming, i.e. practices that increase production through the increase of ecosystem services, emerges as an alternative to conventional intensification. For example, practices that boost abundance and diversity of crop pollinators can lead to substantial increases in cropland productivity. However, little is known about the synergisms and trade-offs between fertilizer input and such ecological intensification practices. Here we investigate interactive effects between fertilization practices and the provision of ecosystem services in a biodiversity hotspot where conventional agriculture is rapidly expanding (Brazilian savannas). We focus on a highly nitrogen-demanding crop species that benefits from pollinators (the common bean, Phaseolus vulgaris L.), for which nitrogen input greatly varies in the study region. Our findings show that positive effects of native pollinators on crop yield are most accentuated under low inputs of nitrogen (e.g. equal to or below 72kg ha-1). This interactive effect could be due to changes in flower visitor community composition or behaviour. Our study also suggests that landscape management practices that minimize isolation from patches of natural vegetation and maximize its cover nearby (within 500 meters) of production areas can increase pollinator and biocontrol agent abundance and richness. Overall, these results suggest that ecological intensification is a valuable alternative for common bean production in Brazil, and potentially other regions of the world. Land productivity can be enhanced if an adequate balance of chemical inputs and landscape management is achieved.
Conflict of interest statement
The authors have declared that no competing interests exist.
Figures
References
-
- FAO, Food and Agriculture Organization. ‘Climate-smart’ agriculture, policies, practices and finances for food security, adaptation and mitigation. FAO, Rome; 2010.
-
- CDB, Convention on Biological Diversity. Strategic Plan for Biodiversity 2011–2020. Available from: https://www.cbd.int/sp/targets/
Publication types
MeSH terms
Substances
LinkOut - more resources
Full Text Sources
Research Materials
