. 2019 Mar 1;28(5):751-763.
doi: 10.1093/hmg/ddy379.

c-Myc is a regulator of the PKD1 gene and PC1-induced pathogenesis

Affiliations

c-Myc is a regulator of the PKD1 gene and PC1-induced pathogenesis

Camila Parrot et al. Hum Mol Genet. .

Abstract

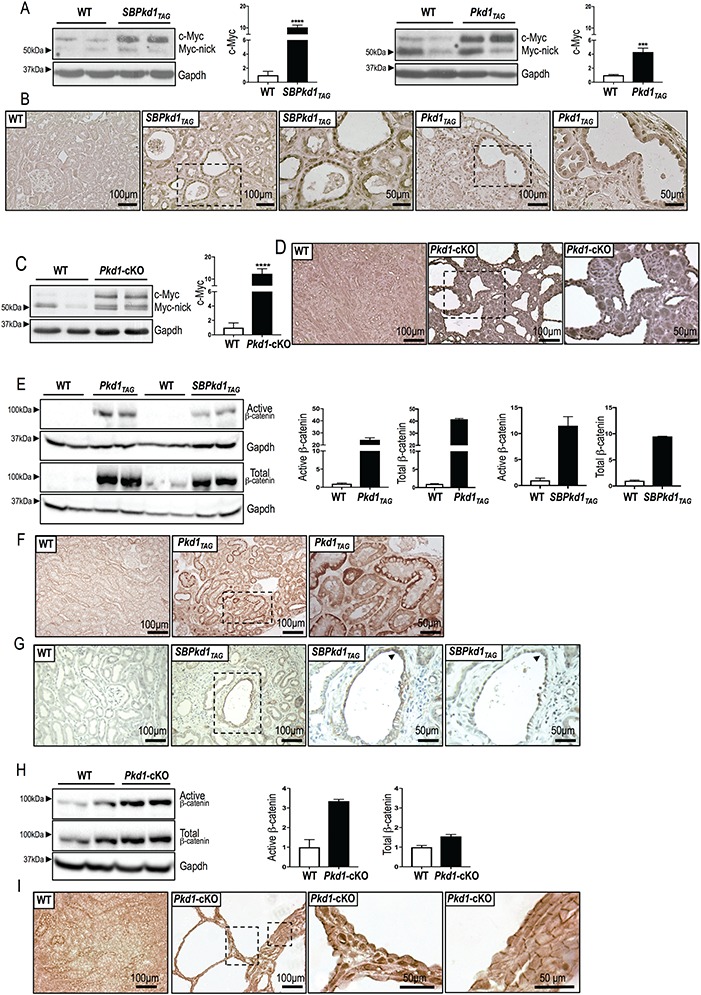
Autosomal dominant polycystic kidney disease (ADPKD) is among the most common monogenic disorders mainly associated with PKD1/PC1 mutations. We show herein that renal regulation in Pc1 dosage-reduced and -increased mouse models converge toward stimulation of c-Myc expression along with β-catenin, delineating c-Myc as a key Pkd1 node in cystogenesis. Enhanced renal c-Myc-induced ADPKD in SBM transgenic mice lead conversely to striking upregulation of Pkd1/Pc1 expression and β-catenin activation, lending credence for reciprocal crosstalk between c-Myc and Pc1. In adult SBM kidneys, c-Myc is strongly enriched on Pkd1 promoter with RNA pol II, consistent with Pkd1 upregulation during cystogenesis. Similar c-Myc direct binding at birth uncovers an equivalent role on Pkd1 regulation during renal developmental program. Concurrent with enriched c-Myc binding, recruitment of active chromatin modifying co-factors by c-Myc at the Pkd1 regulatory region probably opens chromatin to stimulate transcription. A similar transcriptional activation by c-Myc is also likely operant on endogenous human PKD1 gene from our transactivation analysis in response to human c-MYC upregulation. Genetic ablation of c-Myc in Pc1-reduced and -increased mouse models significantly attenuates cyst growth, proliferation and PKD progression. Our study determined a dual role for c-Myc, as a major contributor in Pc1-induced cystogenesis and in a feed-forward regulatory Pkd1-c-Myc loop mechanism that may also prevail in human ADPKD.


Figures

Figure 1
Figure 1
Upregulation of c-Myc and β-catenin expression in Pc1 dosage dysregulated mouse models. (A) Quantification of immunoblot analysis for c-Myc full-length expression in adult SBPkd1tag (n = 5) and Pkd1tag (n = 4) kidneys shows in adjacent histogram increased levels compared to WT (n = 4 and 3, respectively) and normalized to the control Gapdh. Data are representative of three independent experiments. ***P < 0.001, ****P < 0.0001. (B) Adult histological renal sections of SBPkd1tag and Pkd1tag stained with anti-cMyc antibody show strong nuclei staining in cystic epithelial cells compared to WT (Scale: 100 μm), doted boxes correspond to magnified region (Scale: 50 μm). (C) Quantification of western blot analysis for c-Myc full-length expression in Pkd1-cKO (n = 4) kidneys at P10 shows increased levels relative to WT (n = 4) and standardized to Gapdh in adjacent histogram. Data are representative of three independent experiments. ****P < 0.0001. (D) Immunohistologic staining for c-Myc on renal sections from Pkd1-cKO at P10 displays intense signal throughout the kidneys with particularly strong signal in nuclei of cystic tubular epithelium in comparison to WT (Scale: 100 μm), dotted box corresponds to magnified region (Scale: 50 μm). (E) Quantification of immunoblot analysis for active and total β-catenin expression in adult Pkd1tag (n = 2) and SBPkd1tag kidneys (n = 2) shows increased levels relative to WT (n = 2) and normalized to Gapdh as shown in adjacent histograms. Data are representative of two independent experiments. (F) Histological renal sections of adult Pkd1tag stained for β-catenin show intense and higher basolateral and nuclear staining in epithelial cells compared to WT (Scale: 100 μm), dotted box corresponds to magnified region (Scale: 50 μm). (G) Histological renal sections of adult SBPkd1tag stained for β-catenin antibody show strong and higher basolateral staining in cystic epithelial cells compared to WT (Scale: 100 μm), dotted box corresponds to magnified region followed by a successive section stained with c-Myc antibody (4th panel) (Scale: 50 μm). Arrowheads indicate nuclear localization of both β-catenin and c-Myc proteins. (H) Quantification of immunoblot analysis for active and total β-catenin expression in Pkd1-cKO (P10) (n = 2) kidneys shows increased levels relative to WT (n = 2), normalized to Gapdh (adjacent histogram). Data are representative of two independent experiments. (I) Histological sections of Pkd1-cKO (P10) kidneys stained for β-catenin show strong and higher basolateral staining in epithelial cells compared to WT (Scale: 100 μm), left and right dotted boxes correspond to magnified nuclear and lateral stained regions (3rd and 4th panel), respectively (Scale: 50 μm).
Figure 2
Figure 2
c-Myc as an inducer of Pkd1 and Pc1 expression. (A) Immunohistologic staining with c-Myc antibody on adult renal sections of SBM (line 14) showed strong signal over the nuclei of the cystic and hyperplastic epithelium relative to WT (Scale: 100 μm), dotted box corresponds to magnified region (Scale: 50 μm). (B) Histological sections of SBM kidneys (line 14) stained for β-catenin expression displayed basolateral and nuclear signal in comparison to WT controls (Scale: 100 μm), dotted box indicates the corresponding magnified region (Scale: 50 μm). (C) Quantification of immunoblot analysis for active and total β-catenin expression in kidneys (n = 2/per line) of two SBM lines ( and 47) shows increased levels relative to WT (n = 2), normalized to Gapdh (below histograms). (D) Quantitative RT-qPCR analysis of Pkd1 expression in adult kidneys of two SBM lines ( and 47) in comparison to WT (n = 5 for each, 4–7 months of age), normalized to Gapdh. Data are representative of two independent experiments. ****P < 0.0001. (E) Quantification of immunoblot analysis (Top panel) for native Pc1 expression in adult kidneys of two SBM lines (14, n = 4; 47, n = 3) in comparison to WT (n = 3) of 4–6 months of age, normalized to Gapdh in adjacent histogram. Data are representative of five independent experiments. ***P < 0.001. Pc1 immunoblot (Bottom panel; short and long exposure) was performed on adult kidneys of two SBM lines (14 and 47) in comparison to WT, Pkd1tag and SBPkd1tag under native (-) and deglycosylated with PNGase (P) conditions and Gapdh for loading control.
Figure 3
Figure 3
c-Myc binds Pkd1 in vivo and promotes transcriptional activity. (A) Analysis of c-Myc ChIP-seq binding pattern on the mouse Pkd1 locus from UCSC Browser and of associated partner Max in CH12 and MEL cells. Two regions of Pkd1 gene are shown enlarged: 1. The upstream promoter region that was queried for proximal E-box −22/−27 bp (*) and −568/−573 bp (**) and transcription initiation site −313 bp; 2. The Pkd1 exons 44–46 without apparent E-box served as controls. Bottom section, sequence of the mouse Pkd1 promoter region is depicted with the two E-box (red and stars), transcription initiation site (italic bold) and translation initiation site (blue). (B) c-Myc binds to the promoter-upstream region of Pkd1 gene. ChIP assay was performed with antibody against c-Myc or control rabbit IgG in two newborn and two adult kidneys of SBM (line 14) and WT. Two regions upstream of the Pkd1 start codon (−106 to +56 bp, −624 to −534 bp) were analyzed in comparison to negative control Pkd1 exon 45 and relative to total input. Strong PCR amplicons were detected in c-Myc IP of both WT and SBM kidneys at newborn stage and only of SBM kidneys at adult stage. No amplicon was detected from Pkd1 exon 45 in newborn or adult stage. ChIP assay was also performed with antibody against RNA pol II in newborn and adult kidneys from WT and SBM mice. PCR amplification (−356 to −194 bp) of Pkd1 transcription initiation site was observed in both newborn WT and SBM kidneys and only in SBM kidneys at adult stage. (C) ChIP-qPCR was further evaluated for relative enrichment. Both newborn WT and SBM showed enrichment at the c-Myc E-box −22/−27 bp. Strikingly, only adult SBM kidneys displayed marked enrichment at both c-Myc binding sites of Pkd1 promoter. Pkd1 transcriptional usage was assessed in WT and SBM kidneys. Enrichment was found at the transcriptional initiation site in WT and SBM at birth whereas only the SBM kidneys showed enrichment at adult stage. (D) Quantitative RT-qPCR analysis of human c-MYC and PKD1 expression in stably transfected HEK293 cells with c-MYC in comparison to empty vector control that was set as 1. (E) Distribution of nuclear size from SBM cystic (c) and non-cystic (nc) tubules and from WT kidneys at 1 month of age. Population of nuclear size in epithelial cells was subdivided according to nuclear size of 1–15 μm2, 15–30 μm2 and > 30 μm2. A clear increase in nuclear size was observed in the epithelial cells of the SBM cystic tubules relative to WT and was significant for all three size ranges with P < 0.5 for 1–15 μm2, P < 0.01 for 15–30 μm2 and P < 0.001 for >30 μm2. A shift to larger nuclear size for the SBM non-cystic epithelial cells was also shown by a decrease in nuclei population in the 15–30 μm2 range (P < 0.5) and increase in >30 μm2 relative to WT.
Figure 4
Figure 4
Inactivation of c-Myc expression delays cystogenesis in SBPkd1tag mouse model. (A) Quantification of immunoblot analysis of c-Myc full-length expression in kidneys of SBPkd1tag; Myc-cKO (n = 4) shows decreased levels compared to SBPkd1tag (n = 3) and normalized to Gapdh as shown in adjacent histogram. Data are representative of three independent experiments. **P < 0.01. (B) Adult renal histologic sections of SBPkd1tag and SBPkd1tag; Myc-cKO stained by H&E. Scale: 100 μm. (C) Semi-quantification of cystic phenotype in kidneys of SBPkd1tag; Myc-cKO (n = 9) displays significant reduction of cystic area compared to SBPkd1tag (n = 8). **P < 0.01. (D) Epithelial proliferative index was assessed by Ki67 immunohistochemistry in kidneys of SBPkd1tag; Myc-cKO (n = 11) and was particularly reduced in cystic tubules relative to SBPkd1tag mice (n = 7). ****P < 0.0001. (E) Quantification of apoptotic index detected by TUNEL assay exhibits significant reduction of apoptosis in epithelium of cystic tubules of SBPkd1tag; Myc-cKO kidneys (n = 10) in comparison to SBPkd1tag (n = 7). ****P < 0.0001. (F) Analysis of fibrosis by Sirius red in SBPkd1tag; Myc-cKO (n = 8) kidneys revealed a significant decrease in percentage of fibrosis compared to SBPkd1tag (n = 8). **P < 0.01.
Figure 5
Figure 5
Inactivation of c-Myc expression attenuates cyst growth in Pkd1null and Pkd1-cKO mouse models. (A) Renal histologic sections of newborn Pkd1null and Pkd1null-Myc-cKO stained by H&E. Scale: 500 μm. (B) Semi-quantification of cystic phenotype in newborn kidneys of Pkd1null-Myc-cKO (n = 8) shows significant reduction of cystic surface relative to Pkd1null (n = 10). **P < 0.01. (C) Epithelial cell proliferation index was evaluated by Ki67 staining in newborn kidneys of Pkd1 null-Myc-cKO (n = 5) and was significatively reduced relative to Pkd1null (n = 4). **P < 0.01, ***P < 0.001. (D) Apoptotic index in Pkd1null-Myc-cKO (n = 3) and Pkd1null (n = 3) kidneys displayed no significant difference. (E) Analysis of fibrosis in Pkd1null-Myc-cKO (n = 8) and Pkd1null (n = 10) kidneys revealed no significant difference in percentage of fibrosis. (F) Quantification of immunoblot analysis of c-Myc full-length in P10 Pkd1-Myc-cKO (n = 4) kidneys shows decreased levels in comparison to Pkd1-cKO kidneys (n = 3) and standardized to Gapdh as shown in adjacent histogram. Data are representative of two independent experiments. *P < 0.05. (G) Renal histologic sections of P10 Pkd1-cKO and Pkd1-Myc-cKO stained by H&E. Scale: 1 mm. (H) Semi-quantification of cystic phenotype in P10 kidneys of Pkd1-Myc-cKO (n = 6) displays significant reduction of cystic surface compared to Pkd1-cKO (n = 10). *P < 0.05. (I) Epithelial proliferation index was evaluated in P10 kidneys of Pkd1-Myc-cKO (n = 5) that was significantly reduced relative to Pkd1-cKO (n = 5) by Ki67 staining. ****P < 0.0001. (J) Apoptotic index in Pkd1-Myc-cKO (n = 5) and Pkd1-cKO (n = 6) kidneys displayed no significant difference. (K) Analysis of fibrosis in Pkd1-Myc-cKO (n = 9) and Pkd1-cKO (n = 7) kidneys revealed no significant difference in percentage of fibrosis.
Figure 6
Figure 6
Proposed in vivo model of Pc1-c-Myc regulatory loop mechanism. Pc1 dosage dysregulation leads to c-Myc upregulation likely via several signaling pathways including Wnt canonical cascade. In the latter pathway, activation of β-catenin expression can directly promote c-Myc expression (RNA and protein). In addition, β-catenin was also shown in vitro to stimulate Pkd1 promoter. This upregulation of c-Myc in turn can lead to a feed-forward regulation on Pkd1 gene. In ADPKD patients, the germline and/or somatic allele of PKD1 gene could respond and attempt to induce a compensatory mechanism. In the adult cystic stages however, the uncontrolled c-Myc functions and consequently downstream targets may exacerbate PKD severity.

Similar articles

Cited by

References

    1. Lanoix J., D'Agati V., Szabolcs M. and Trudel M. (1996) Dysregulation of cellular proliferation and apoptosis mediates human autosomal dominant polycystic kidney disease (ADPKD). Oncogene, 13, 1153–1160. - PubMed
    1. Ward C.J., Turley H., Ong A.C.M., Comley M., Biddolph S., Chetty R., Ratcliffe P.J., Gatter K. and Harris P.C. (1996) Polycystin, the polycystic kidney disease 1 protein, is expressed by epithelial cells in fetal, adult and polycystic kidney. Proc. Natl. Acad. Sci. U. S. A., 93, 1524–1528. - PMC - PubMed
    1. Van Adelsberg J., Chamberlain S. and D'Agati V. (1997) Polycystin expression is temporally and spatially regulated during renal development. Am. J. Physiol., 272, F602–F609. - PubMed
    1. Geng L., Segal Y., Peissel B., Deng N., Pei Y., Carone F., Rennke H.G., Glücksmann-Kuis A.M., Schneider M.C., Ericsson M. et al. (1996) Identification and localization of polycystin, the PKD1 gene product. J. Clin. Invest., 98, 2674–2682. - PMC - PubMed
    1. Ibraghimov-Beskrovnaya O., Dackowski W.R., Foggensteiner L., Coleman N., Thiru S., Petry L.R., Burn T.C., Connors T.D., Van Raay T., Bradley J. et al. (1997) Polycystin: in vitro synthesis, in vivo tissue expression, and subcellular localization identifies a large membrane-associated protein. Proc. Natl. Acad. Sci. U. S. A., 94, 6397–6402. - PMC - PubMed

Publication types

MeSH terms