. 2018 Nov 1;72(3):496-509.e9.
doi: 10.1016/j.molcel.2018.09.033.

Exon Junction Complex Shapes the Transcriptome by Repressing Recursive Splicing

Affiliations

Exon Junction Complex Shapes the Transcriptome by Repressing Recursive Splicing

Lorea Blazquez et al. Mol Cell. .

Abstract

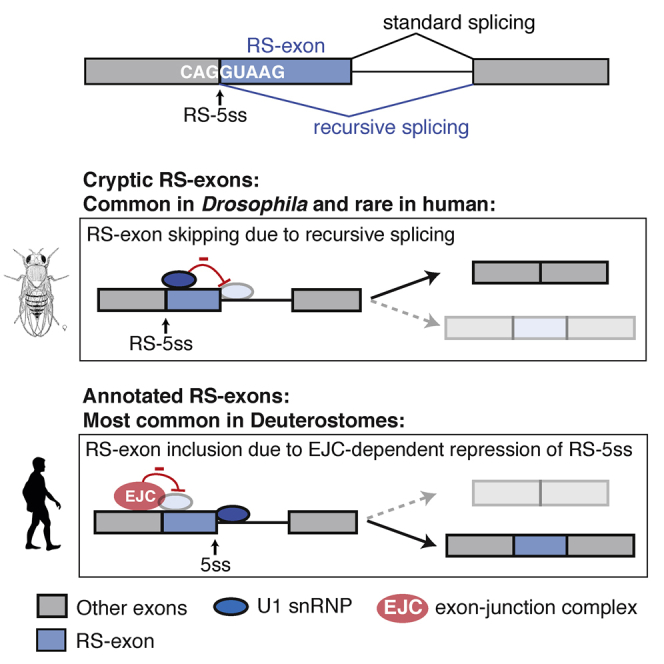
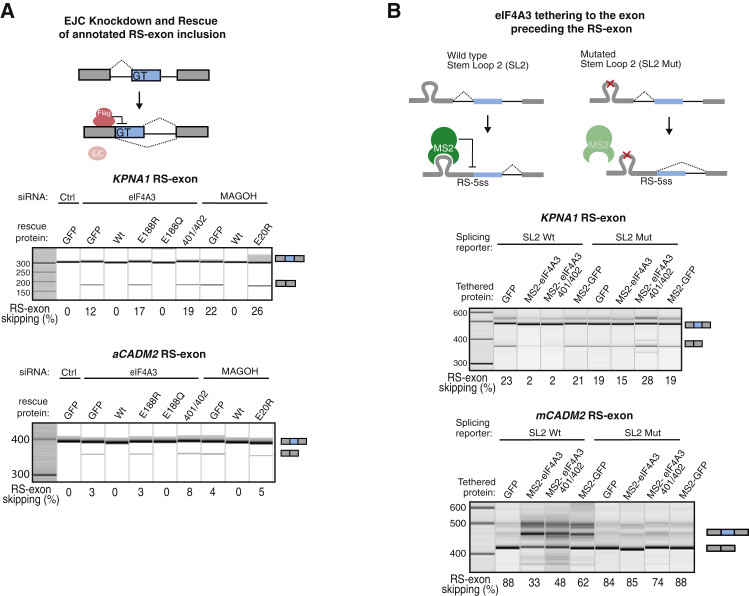
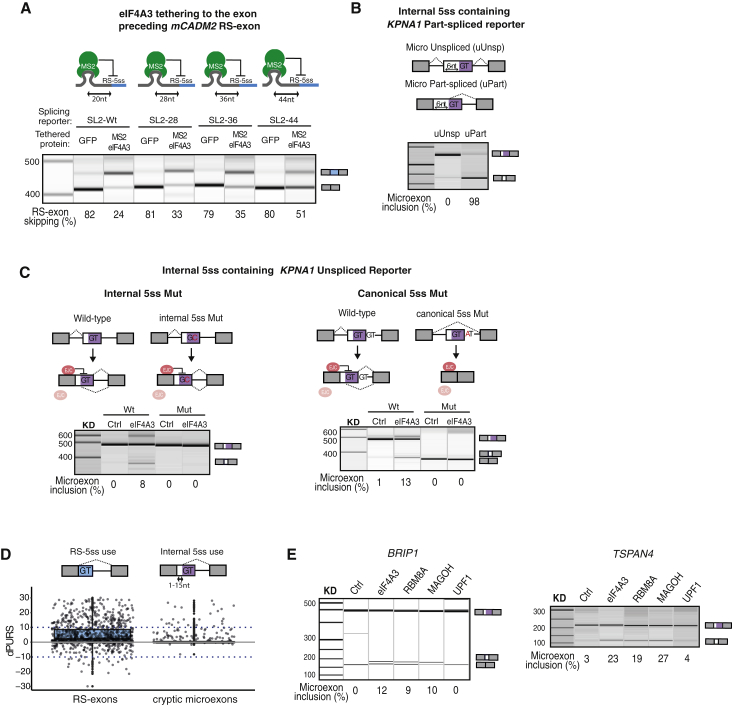
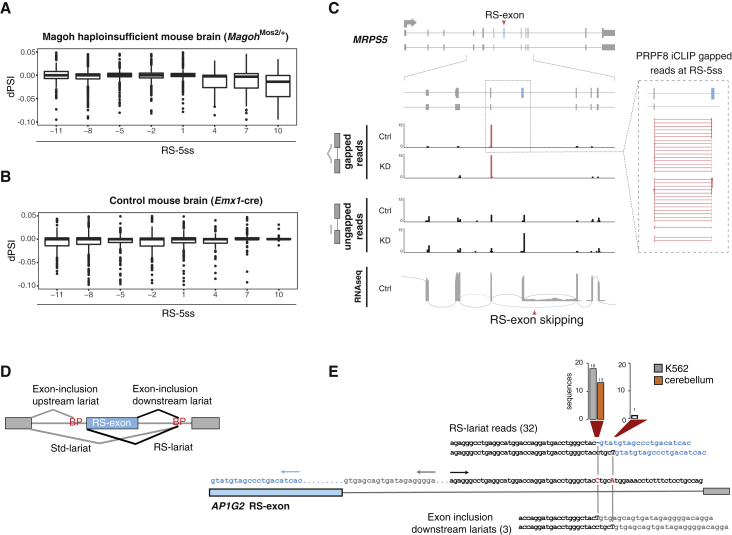
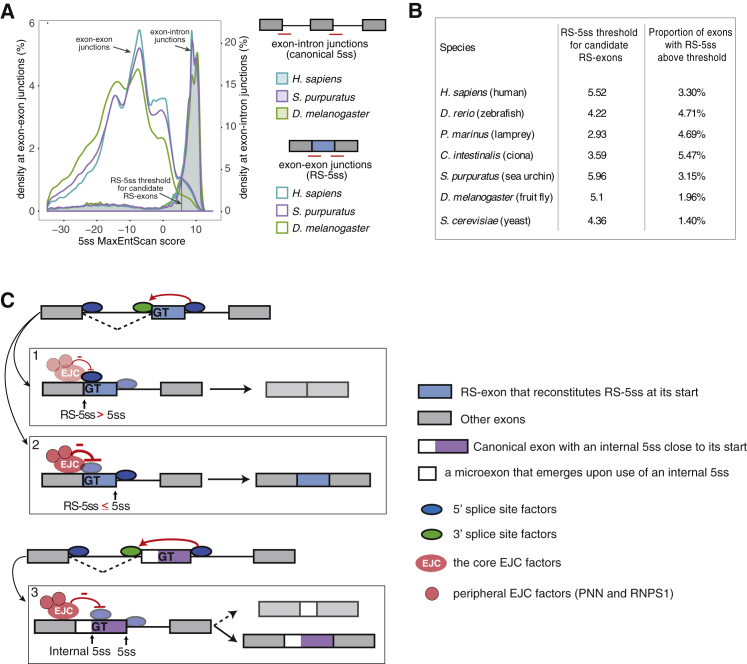
Recursive splicing (RS) starts by defining an "RS-exon," which is then spliced to the preceding exon, thus creating a recursive 5' splice site (RS-5ss). Previous studies focused on cryptic RS-exons, and now we find that the exon junction complex (EJC) represses RS of hundreds of annotated, mainly constitutive RS-exons. The core EJC factors, and the peripheral factors PNN and RNPS1, maintain RS-exon inclusion by repressing spliceosomal assembly on RS-5ss. The EJC also blocks 5ss located near exon-exon junctions, thus repressing inclusion of cryptic microexons. The prevalence of annotated RS-exons is high in deuterostomes, while the cryptic RS-exons are more prevalent in Drosophila, where EJC appears less capable of repressing RS. Notably, incomplete repression of RS also contributes to physiological alternative splicing of several human RS-exons. Finally, haploinsufficiency of the EJC factor Magoh in mice is associated with skipping of RS-exons in the brain, with relevance to the microcephaly phenotype and human diseases.

Keywords: RS exon; alternative splicing mechanisms; evolution; exon junction complex; gene expression; microcephaly; microexon; neurodevelopmental disorders; recursive splicing.


Figures

None
Graphical abstract
Figure 1
Figure 1
Core EJC Components Promote Inclusion of Putative “RS-Exons” (A) An RS-exon starts with a partial 5ss motif, and after the first step of splicing to the preceding exon, it generates RS-5ss within the part-spliced transcript. The RS-exon will be skipped if the RS-5ss is used for the second step of splicing and included if the canonical 5ss is used. (B) Pie charts show the prevalence of putative RS-exons in human mRNAs according to ENSEMBL GRCh37 annotation. (C) RT-PCR analysis of unspliced and part-spliced reporters derived from the alternative CADM2 (aCADM2) isoform after transient transfection into HeLa cells. (D) aCADM2 unspliced reporter was stably integrated into the genome of HeLa cells, and the splicing pattern of the RS-exon was analyzed by RT-PCR after eIF4A3, RBM8A, MAGOH, and UPF1 KD. (E) Boxplots show the difference in percentage spliced in (dPSI) of highly included exons (PSI > 90%) after KD of eIF4A3, RBM8A, CASC3, or UPF1. Exons are binned by their RS-5ss score, and dPSI for each bin is calculated by subtracting the PSI in the control experiment to each KD. The RS-5ss values on the x axis indicate the midpoint of each group. Negative dPSI values indicate increased exon skipping upon KD. (F) Same as (E), but for alternative exons with a PSI < 90%. (G) The statistical significance of RS-exon skipping is performed by dividing constitutive RS-exons (PSI >0.98) into two groups based on a RS-5ss score threshold, analyzing the differences in dPSI values between the two groups, and calculating a signed p-value by testing for a skew in dPSI values between the two groups using the Wilcoxon rank-sum test. The analysis is done at multiple thresholds, from −40 to 8. (H) RT-PCR analysis of RS-exon splicing pattern after KD of EJC core factors or UPF1. Results shown in (C), (D), and (H) derive from a minimum of 3 independent experiments performed in HeLa cells.
Figure 2
Figure 2
PNN and RNPS1 Contribute to the Inclusion of “Annotated RS-Exons” (A) The statistical significance of RS-exon skipping upon KD of 28 RBPs is performed by analysis of public RNA-seq data as explained in Figure 1G. Peripheral EJC factors are marked in purple, and experiments that had no effect are marked in gray. (B) The statistical significance of RS-exon skipping upon KD of 191 RBPs calculated by analysis of ENCODE consortium RNA-seq, as in (A). Core EJC components are marked in red, new factors that had an effect are marked in blue, and KD experiments that had no effect are marked in gray. (C) Distribution of dPSI after KD of different RBPs is shown for highly included exons in control (PSI > 90%), as explained in Figure 1E. (D) Same as (C), but for alternative exons with PSI < 90%. (E) RT-PCR validation of RS-exon skipping after KD of eIF4A3, RNPS1, or PNN (n = 3 independent experiments for KLHL20 and TMA16; n = 2 for EGLN1, KPNA1, MRPL3, and SACM1L).
Figure 3
Figure 3
Skipping of Annotated RS-Exons upon EJC KD Results from Recursive Splicing (A) The count of PRPF8 iCLIP reads that identify crosslinks at each nucleotide upstream of exon-intron junctions is normalized by the total number of evaluated junctions (RS = 4,631; non-RS = 130,410) and the total number of crosslinks in each experiment. HeLa cells treated with either control or eIF4A3 siRNAs were used for iCLIP (n = 4 per group, 2 independent experiments). Reads upstream of RS-exons and non RS-exons are plotted in orange and gray, respectively. The data were smoothed using locally weighted scatterplot smoothing (LOESS). Shaded regions represent 95% confidence intervals. (B) Density plot as in (A), but assessing PRPF8 iCLIP upstream of exon-exon junctions. Crosslinks upstream of RS-exons or non RS-exons are plotted in blue or gray, respectively. (C) KPNA1 unspliced reporter with a mutant RS-5ss was stably integrated into HeLa cells, and the splicing pattern of endogenous or mutant RS-exon was analyzed by RT-PCR after eIF4A3 KD. (D) Same analysis as in (C), after transfecting cells with an antisense oligonucleotide complementary to the EJC deposition site. (E) RT-PCR analysis of wild-type and mutant unspliced and part-spliced reporters derived from the KPNA1 gene after their transient transfection into HeLa cells. (F) RT-PCR analysis of RS-exon splicing pattern after transient transfection of wild-type or mutant aCADM2, KPNA1, and PSMA3-AS1 reporters into HeLa cells treated with control or eIF4A3 siRNAs. The original RS-5ss score is indicated in bold, and the scores after mutation are in regular font. (G) Nucleotide sequences at the exon-exon junctions and their associated RS-5ss scores for the splicing reporters used in (C), (F), and (H). The nucleotides before and after the slash sign correspond to the last 3 nt of the preceding exon and the first 6 nt of the exon under study. Mutations are indicated in red. (H) Wild-type and mutant splicing reporters derived from RPS2 gene were transiently transfected into HeLa cells, and their splicing pattern was analyzed by RT-PCR after control or eIF4A3 KD. Results shown in (C)–(F) and (H) derive from a minimum of 3 independent replicates.
Figure 4
Figure 4
Stable EJC Deposition Is Required to Block Recursive Splicing (A) KD of EJC components was rescued with siRNA-resistant FLAG-tagged counterparts. The splicing pattern of endogenous KPNA1 or stably integrated aCADM2 RS-exons was monitored by RT-PCR. (B) Wild-type or mutant SL2 sequence was inserted into KPNA1 and mCADM2 splicing reporters at the expected EJC deposition site, and the splicing pattern was monitored by RT-PCR after co-transfection of SL2 reporters and plasmids expressing the indicated MS2-tagged proteins. A minimum of 3 independent replicates was performed in HeLa (A) or 293 (B) cells.
Figure 5
Figure 5
EJC Depletion Leads to Inclusion of Cryptic Microexons (A) The SL2 in mCADM2 splicing reporter was moved upstream of the exon-exon junction as indicated, and the RS-exon splicing pattern was analyzed after co-transfection of SL2 reporters and plasmids expressing MS2-eIF4A3 or GFP proteins. (B) Six nucleotides (GCACAG) were added at the beginning of the KPNA1 RS-exon to move the RS site to an internal 5ss, thus creating a KPNA1 microexon reporter. Unspliced and part-spliced version of the reporters were transfected, and their splicing pattern was analyzed by RT-PCR. (C) The internal or canonical 5ss within KPNA1 microexon unspliced reporter were mutated, and the splicing pattern was analyzed by RT-PCR after transfection into HeLa cells treated with control or eIF4A3 siRNAs. (D) The difference in the use of RS-5ss or internal 5ss in EJC KD compared to control (dPURS) is shown in HeLa cells. Cryptic microexons result from the use of an internal 5ss that is located within the first 15 nt of a longer annotated exon. Positive dPURS values indicate increased RS-exon skipping or increased inclusion of cryptic microexons. (E) RT-PCR validation of 2 microexon inclusion events identified in (D) after KD of EJC core factors or UPF1. Results shown in (A)–(C) and (E) derive from a minimum of 3 independent replicates performed in HeLa cells.
Figure 6
Figure 6
EJC-Mediated Repression of Recursive Splicing in the Brain, and Physiologic Recursive Splicing (A) The dPSI of exons highly included in wild-type mouse brain (PSI > 90%) is shown after comparison with Magoh haploinsufficient mouse brain as in Figure 1E. (B) Same as (A), but comparing control Emx1-cre and wild-type mouse brain. (C) A schematic of the MRPS5 gene with the RS-exon highlighted in blue. Below, PRPF8 iCLIP crosslinking is shown, as identified by either ungapped or gapped reads in control or eIF4A3 KD cells (4 replicates are summed up per condition). Crosslinks upstream of junctions involving the RS-exon are shown in red, and corresponding reads are zoomed into on the right. Further below, a Sashimi plot shows RNA-seq evidence of RS-exon skipping. (D) The types of possible lariats associated with RS-exon splicing are named. In black are the lariats that were detected for the AP1G2 gene as described in (E). (E) Sequence of the RS-exon in the AP1G2 gene and its downstream intron. BP annotations based on lariat sequencing are highlighted in red. Arrows indicate primers used to interrogate lariats shown in black in (D). Above, sequences and number of reads supporting RS-lariats (inverted alignment) with alternative BP annotations in cerebellum and K562 cells are shown. Below, sequences and number of reads supporting exon inclusion downstream lariats with alternative BP annotations are shown.
Figure 7
Figure 7
Analysis of RS-Exon Inclusion across Evolution (A) Density plot showing 5ss score distribution at exon-intron junctions (canonical 5ss, shaded lines) or at exon-exon junctions (RS-5ss, unshaded lines) for all internal annotated exons in human (blue), sea urchin (purple), or fruit fly (green). The red line represents the 5ss score is lower than 90% of exon-intron junctions in each species. This value is used as the RS-5ss threshold to quantify the proportion of putative RS-exons across species in (B). (B) A RS-5ss threshold was calculated as explained in (A) for 7 different species. Putative RS-exons for each species were calculated as the proportion of annotated exons that reconstitute a RS-5ss above the threshold. (C) Model for EJC-dependent repression of recursive splicing and microexon inclusion. Top panel: annotated putative RS-exons (in blue) are defined and spliced to their preceding exon to reconstitute a 5ss (RS-5ss) at the exon-exon junction, which leads to EJC deposition. Two outcomes can result from the second step of splicing: (1) the EJC does not efficiently repress the RS-5ss, either because it is a very strong RS-5ss or EJC assembly is deficient, and as a result, the RS-exon is recursively spliced; or (2) the EJC efficiently represses recursive splicing at most RS-5ss that are present in human mRNAs, most often leading to constitutive inclusion of RS-exons. Bottom panel: canonical exons that contain an internal 5ss close to their beginning (in white and purple) are defined and spliced to their preceding exon. (3) This splicing event leads to EJC deposition, which normally blocks the internal 5ss recognition, leading to an isoform that includes the full exon (bottom). However, if EJC does not repress the internal 5ss efficiently, its recognition leads to inclusion of a microexon (in white), while the rest of the exon (in purple) is removed in the second splicing step.

Comment in

References

    1. Aerne B.L., Gailite I., Sims D., Tapon N. Hippo stabilises its adaptor Salvador by antagonising the HECT ubiquitin ligase Herc4. PLoS ONE. 2015;10:e0131113. - PMC - PubMed
    1. Ashton-Beaucage D., Udell C.M., Lavoie H., Baril C., Lefrançois M., Chagnon P., Gendron P., Caron-Lizotte O., Bonneil E., Thibault P., Therrien M. The exon junction complex controls the splicing of MAPK and other long intron-containing transcripts in Drosophila. Cell. 2010;143:251–262. - PubMed
    1. Ballut L., Marchadier B., Baguet A., Tomasetto C., Séraphin B., Le Hir H. The exon junction core complex is locked onto RNA by inhibition of eIF4AIII ATPase activity. Nat. Struct. Mol. Biol. 2005;12:861–869. - PubMed
    1. Bartkowska K., Tepper B., Turlejski K., Djavadian R.L. Roles of the exon junction complex components in the central nervous system: a mini review. Rev. Neurosci. 2018 Published online May 23, 2018. - PubMed
    1. Boehm V., Britto-Borges T., Steckelberg A.-L., Singh K.K., Gerbracht J.V., Gueney E., Blazquez L., Altmueller J., Dieterich C., Gehring N.H. Exon junction complexes suppress spurious splice sites to safeguard transcriptome integrity. Mol. Cell. 2018;72:482–495. this issue. - PubMed

Publication types