. 2018 Nov 1;175(4):962-972.e10.
doi: 10.1016/j.cell.2018.10.029.

US Immigration Westernizes the Human Gut Microbiome

Affiliations

US Immigration Westernizes the Human Gut Microbiome

Pajau Vangay et al. Cell. .

Abstract

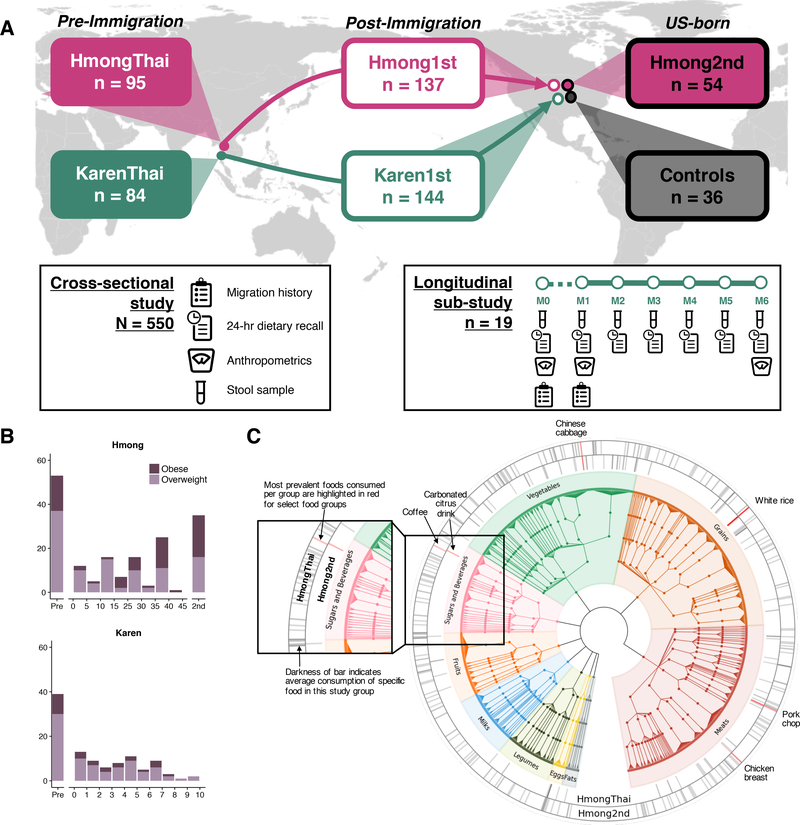
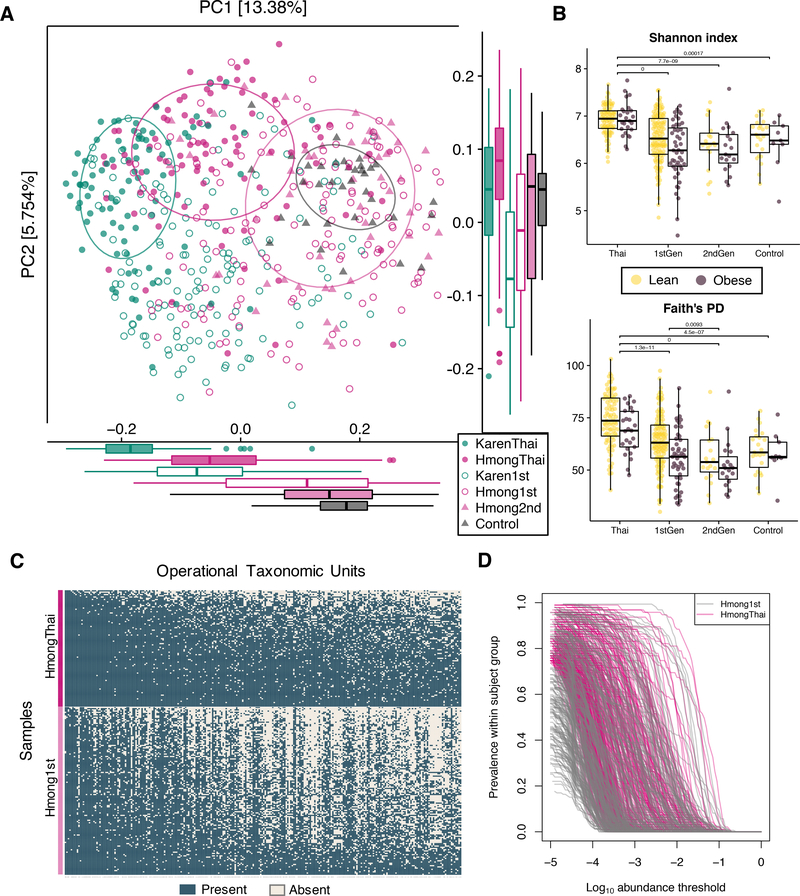
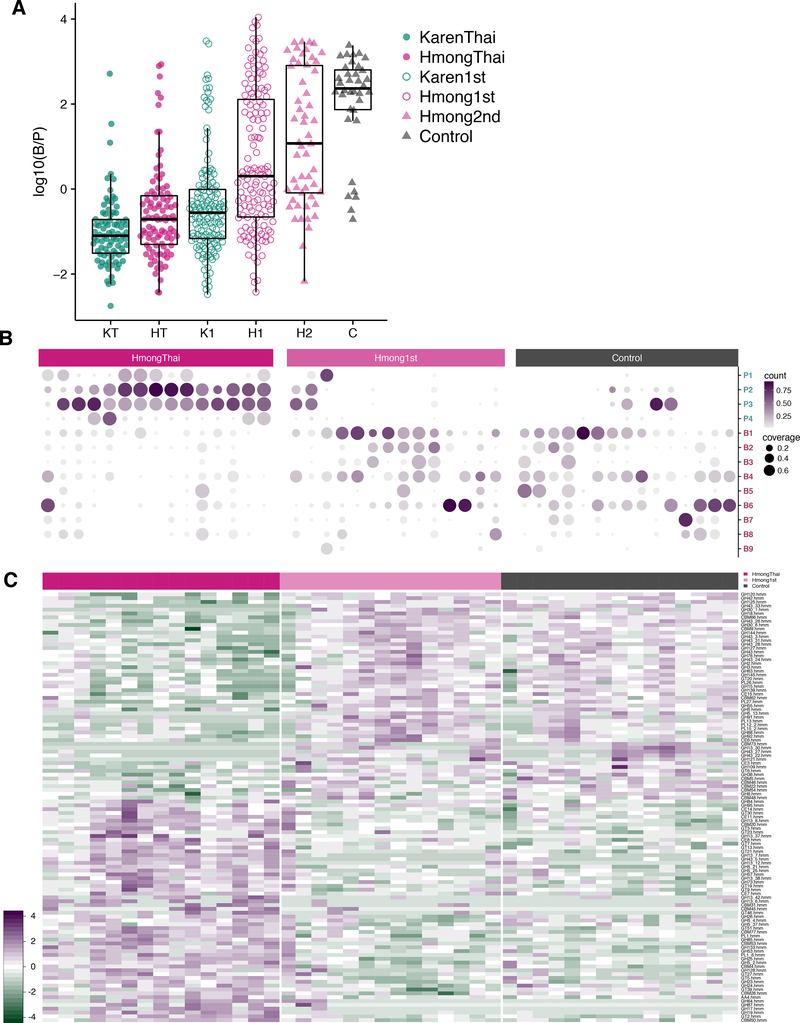
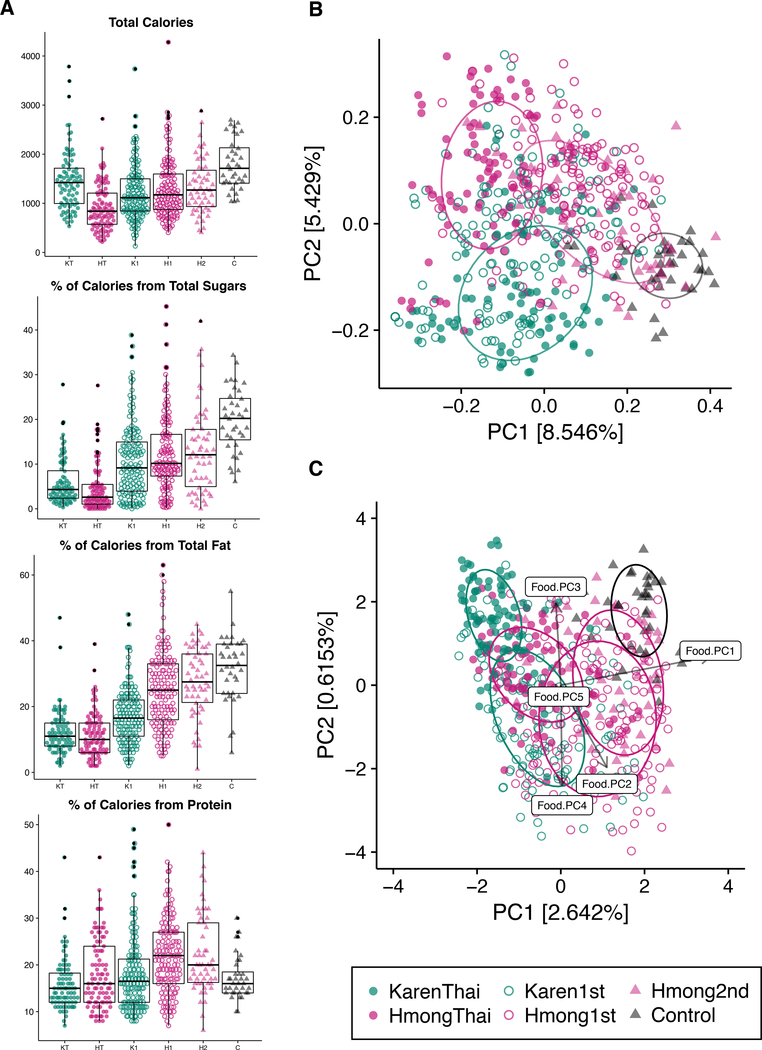
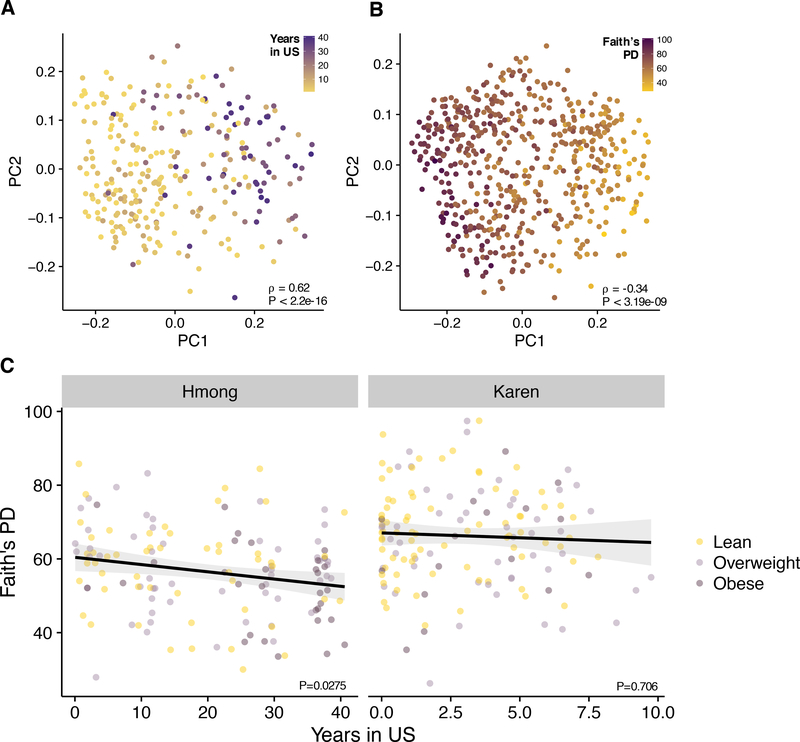
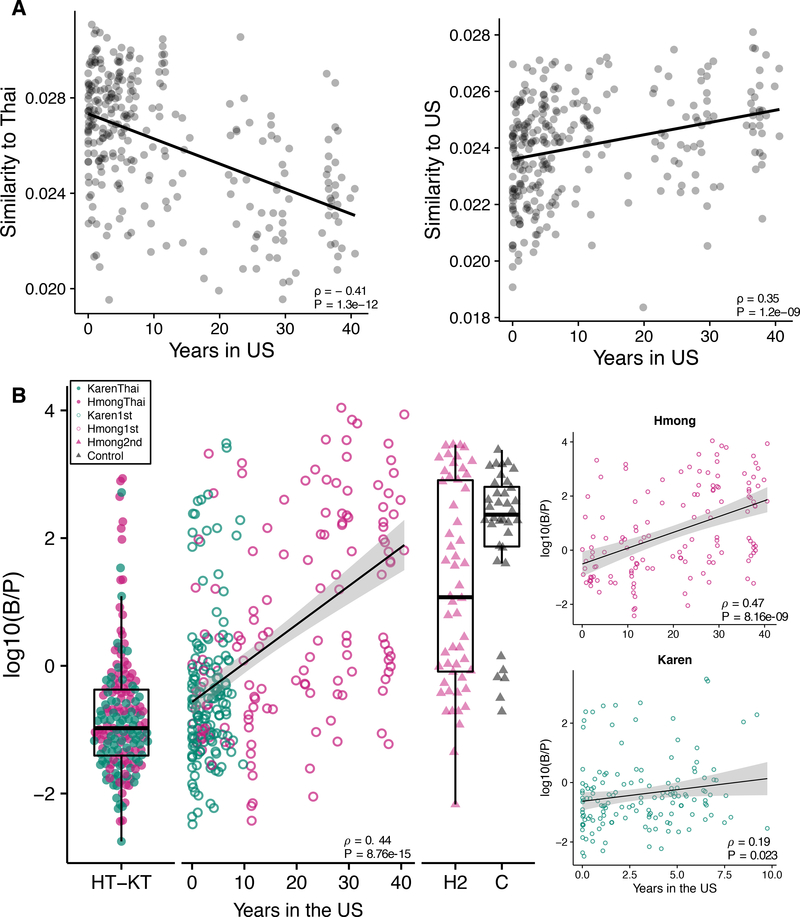
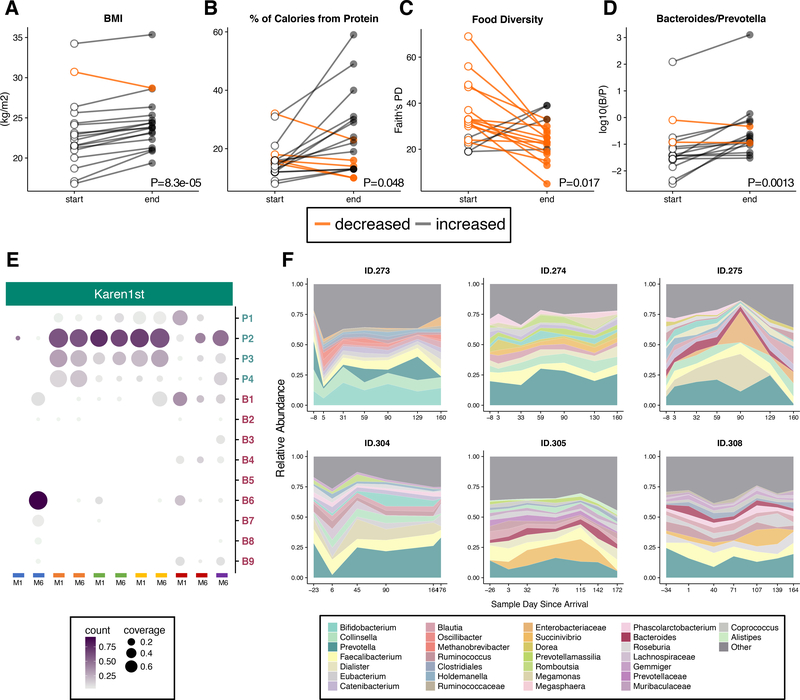
Many US immigrant populations develop metabolic diseases post immigration, but the causes are not well understood. Although the microbiome plays a role in metabolic disease, there have been no studies measuring the effects of US immigration on the gut microbiome. We collected stool, dietary recalls, and anthropometrics from 514 Hmong and Karen individuals living in Thailand and the United States, including first- and second-generation immigrants and 19 Karen individuals sampled before and after immigration, as well as from 36 US-born European American individuals. Using 16S and deep shotgun metagenomic DNA sequencing, we found that migration from a non-Western country to the United States is associated with immediate loss of gut microbiome diversity and function in which US-associated strains and functions displace native strains and functions. These effects increase with duration of US residence and are compounded by obesity and across generations.

Keywords: Bacteriodes; Prevotella; immigrant health; immigration; metagenomics; microbiome; microbiota; obesity; refugee health.


Conflict of interest statement

Declaration of Interests

D.K. serves as CEO and holds equity in CoreBiome, a company involved in the commercialization of microbiome analysis. The University of Minnesota also has financial interests in CoreBiome under the terms of a license agreement with CoreBiome. These interests have been reviewed and managed by the University of Minnesota in accordance with its Conflict-of-Interest policies.

Figures

Figure 1.
Figure 1.. Assembly of a multi-generational Asian American cohort
(1A) Experimental design for cross-sectional and longitudinal cohorts. See also Figure S1A. (1B) Ratios of overweight-to-obese individuals across sample groups and over time in the U.S., separated by ethnicity due to differences in time in years. (1C) Hmong in Thailand (n = 43) and second-generation Hmong (n = 41) (ages 20–40) diet diversity, displayed on a tree that groups related foods together. Bars denote unique foods, with darkness of the bar showing prevalence of foods reported averaged within HmongThai or Hmong2nd. Items highlighted in red denote the most prevalent vegetables, sweets and beverages, grains, and meats reported within sample groups. Full descriptions of foods highlighted in red: Coffee, brewed, regular; Carbonated citrus fruit drink; Chinese cabbage or Bok Choy family, raw; Rice, white, no salt or fat added; Pork chop, broiled, baked, or grilled, lean only eaten; Chicken breast, roasted, skin not eaten. See also Figure S1B.
Figure 2.
Figure 2.. Loss of diversity and native bacterial taxa with time spent in the U.S.
(2A) Principal coordinate analysis (PCoA) of unweighted UniFrac distances between bacterial communities of cross-sectional participants revealed that phylogenetic variation was differentiated by sample group (ANOSIM R=0.25, P=0.001). 95% standard error ellipses are shown around Hmong and Karen in Thailand, second-generation Hmong, and Controls. (2B) Alpha diversity of obese and lean individuals across sample groups, in Shannon’s Diversity index and Faith’s Phylogenetic Distance (PD). P-values denote significantly different groups using pairwise tests of sample groups without stratification by BMI (Tukey’s HSD, p < 0.01). Microbiome diversity is significantly lower in obese individuals across all sample groups (unbalanced two-way ANOVA analysis with BMI class and sample group as covariates, P = 0.0044). See also Figure S2A. (2C) Prevalence of operational taxonomic units (OTUs) in HmongThai and Hmong1st, with OTUs sorted by prevalence in HmongThai and samples sorted by richness within sample group. OTUs shown are found in at least 75% of HmongThai samples (See Table S4 for taxonomic assignments, mean group prevalence, and statistics). (2D) Prevalence-abundance curves of all OTUs present in at least 75% of HmongThai samples, plotted separately for the Hmong1st and HmongThai sample groups. See also Figure S2B.
Figure 3.
Figure 3.. Bacteroides and Prevotella strain diversity and abundances
(3A) Log-transformed ratio of Bacteroides to Prevotella (B/P) relative abundances. U.S. residence, U.S. birth, and ethnicity were all significantly associated with B/P ratio (unbalanced two-way ANOVA P=3.4e−13, P=0.00085, P=5.5e−12, respectively). (KT=KarenThai; HT=HmongThai; K1=Karen1st; H1=Hmong1st; H2=Hmong2nd; C=Controls). (3B) Coverage and relative abundance of Bacteroides and Prevotella strains in 44 samples across HmongThai, Hmong1st (who have lived in the U.S. for more than 30 years), and Controls. Strains with genomic coverage > 50% in at least one sample were included. Hierarchical clustering of strains and samples within group is based on relative abundances. Strains with genome coverage of < 1% within a person are considered not present (not plotted). See Table S5 for strain names. (3C) CAZymes with significantly different relative abundances across HmongThai, Hmong1st (who have lived in the U.S. for more than 30 years), and Controls (Kruskal-Wallis test, FDR-corrected q < 0.05). See also Figure S3.
Figure 4.
Figure 4.. Dietary acculturation partially explains microbiome variation
(4A) Comparison of macronutrient consumption across sample groups. Ethnicity is significantly associated with calories (P=3.4e−05), sugars (P=0.00023), fat (P=1.3e−07), protein (P=3.2e−07), whereas U.S. residency is associated with sugar (P=1.3e−16), fat (P=7.1e−24), and protein consumption (P=5.7e−05), and birth continent is only associated with Fat consumption (P=0.0081) (unbalanced two-way ANOVA) (HT=HmongThai; KT=KarenThai; H1=Hmong1st; K1=Karen1st; H2=Hmong2nd; C=Controls). See also Figure S4. (4B) PCoA of unweighted UniFrac diet-based distances reveals significant clustering by sample group (ANOSIM R=0.29, P=0.001). Dietary acculturation can be seen along PC1 with Thai-resident groups on the left and European Controls on the right. (4C) Redundancy analysis (RDA) of the unweighted UniFrac microbiome-distances constrained by the first 5 principal coordinates of the PCoA of unweighted UniFrac food-distances. The resulting RDA explains 16.8% of the total variation explained by PC1 and PC2 of the microbiome PCoA (Figure 2A). See also Figure S5.
Figure 5.
Figure 5.. Gut biodiversity decreases with time spent in the U.S.
(5A) Unweighted UniFrac PCoA of gut microbiomes of first-generation Hmong and Karen participants (N = 281), colored by years spent in the U.S. which ranges from 1 day to 40.6 years. PC1 is strongly correlated with the amount of time spent in the U.S. (⍴ = 0.62, p < 2.2e16). (5B) Unweighted UniFrac PCoA of gut microbiomes of cross-sectional participants (N=550), colored by Faith’s Phylogenetic Diversity. PC1 is negatively correlated with phylogenetic richness (⍴ = −0.34, p < 3.19e-09). (5C) In first-generation Hmong, diversity significantly decreases over time in the U.S. (multiple regression: Years in US β = −0.18, P = 0.0275; BMI β = −0.05, P = 0.81), but a significant association was not observed in first-generation Karen (Years in US β = −0.17, P = 0.71; BMI β = −0.27, P = 0.28).
Figure 6.
Figure 6.. Prevotella displacement continues over decades of U.S. residence
(6A) Similarity (1 / Aitchison’s distance) of microbiomes relative to Thai-based groups (Spearman’s correlation, ρ = −0.41, P = 1.3e−12) and to Controls (Spearman’s correlation, ρ = 0.35, P = 1.2e−09). See also Figure S6A. (6B) Log ratio of Bacteroides to Prevotella of first-generation groups are significantly correlated to years spent in the U.S. (Spearman’s correlation, ρ = 0.44, P = 8.76e-15). Significantly correlated trends persist after stratification by ethnicity (Spearman’s correlation, Hmong ρ = 0.47, P = 8.16e-19; Karen ρ = 0.19, P = 0.023). (HT=HmongThai; KT=KarenThai; H2=Hmong2nd; C=Controls; 0–40=Years spent in the U.S. by Hmong1st and Karen1st). See also Figure S6B.
Figure 7.
Figure 7.. Longitudinal microbiome variation during relocation to the U.S.
(7A) Comparison of per-participant changes between first and last months of the study in BMI (paired t-test, P=8.3e-05), (7B) protein consumption (paired t-test, macronutrients adjusted for multiple comparisons using false discovery rate < 0.05, P=0.048), (7C) dietary diversity (Faith’s PD) (paired t-test, macronutrients adjusted for multiple comparisons using false discovery rate < 0.05, P=0.017), and (7D) Bacteroides to Prevotella ratios (paired t-test, macronutrients adjusted for multiple comparisons using false discovery rate < 0.05, P=0.0013). (7E) Bacteroides and Prevotella strain profiles are mostly stable after 6 months. Samples (columns) from the same participant are denoted by color, and M1 and M6 correspond to Month 1 Sample and Month 6 Sample, respectively. Selected strains are identical to Figure 3B (at least 50% coverage per sample across N=55 samples, see Table S5). (7F) Taxonomic area charts of relative abundances of dominant genera (other taxa not shown) in 6 individuals who began the longitudinal study while in a refugee camp in Thailand and then continued after relocation to the U.S. First available samples were collected 6 to 34 days before departure, and second samples were collected 1 to 6 days after arrival to the U.S. See also Figure S7.

Comment in

References

    1. Abubucker S, Segata N, Goll J, Schubert AM, Izard J, Cantarel BL, Rodriguez-Mueller B, Zucker J, Thiagarajan M, Henrissat B, et al. (2012). Metabolic reconstruction for metagenomic data and its application to the human microbiome. PLoS Comput. Biol 8, e1002358. - PMC - PubMed
    1. Al-Ghalith G, and Knights D (2017). BURST enables optimal exhaustive DNA alignment for big data (Zenodo).
    1. Al-Ghalith G, and Knights D (2018). aKronyMer enables database-free metagenome comparison (Zenodo).
    1. Al-Ghalith GA, Vangay P, and Knights D (2015). The guts of obesity: progress and challenges in linking gut microbes to obesity. Discov. Med 19, 81–88. - PubMed
    1. Al-Ghalith GA, Hillmann B, Ang K, Shields-Cutler R, and Knights D (2018). SHI7 Is a Self-Learning Pipeline for Multipurpose Short-Read DNA Quality Control. mSystems 3. - PMC - PubMed

Publication types