. 2018 Nov 1;175(4):973-983.e14.
doi: 10.1016/j.cell.2018.10.020.

Microbial Interkingdom Interactions in Roots Promote Arabidopsis Survival

Affiliations

Microbial Interkingdom Interactions in Roots Promote Arabidopsis Survival

Paloma Durán et al. Cell. .

Abstract

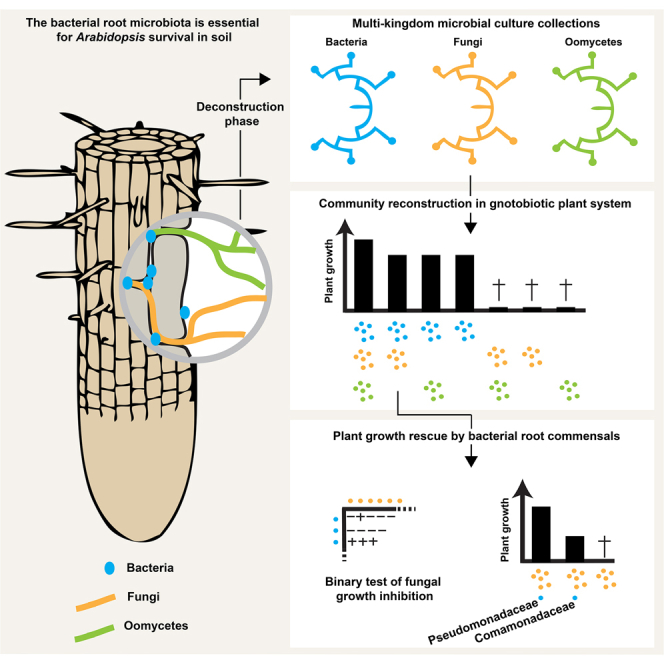
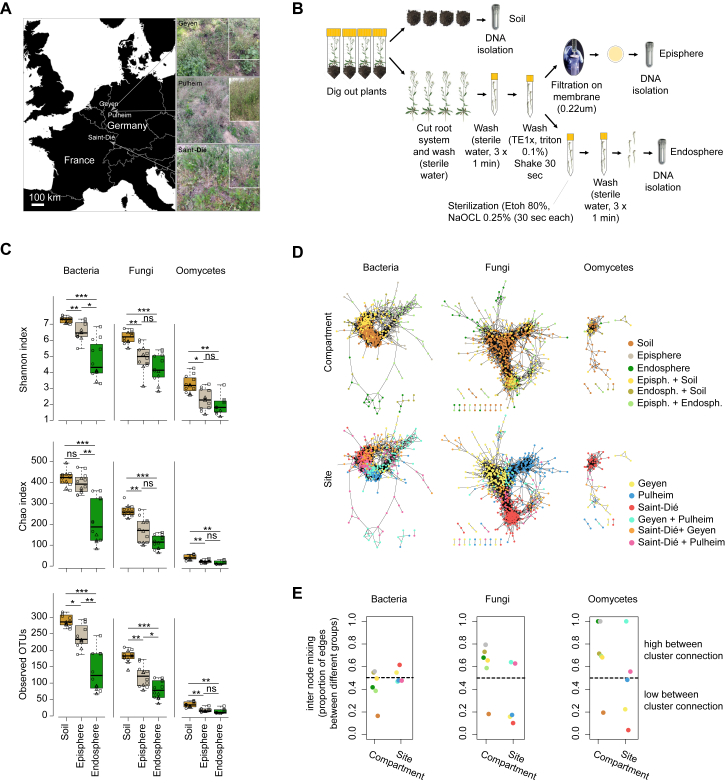
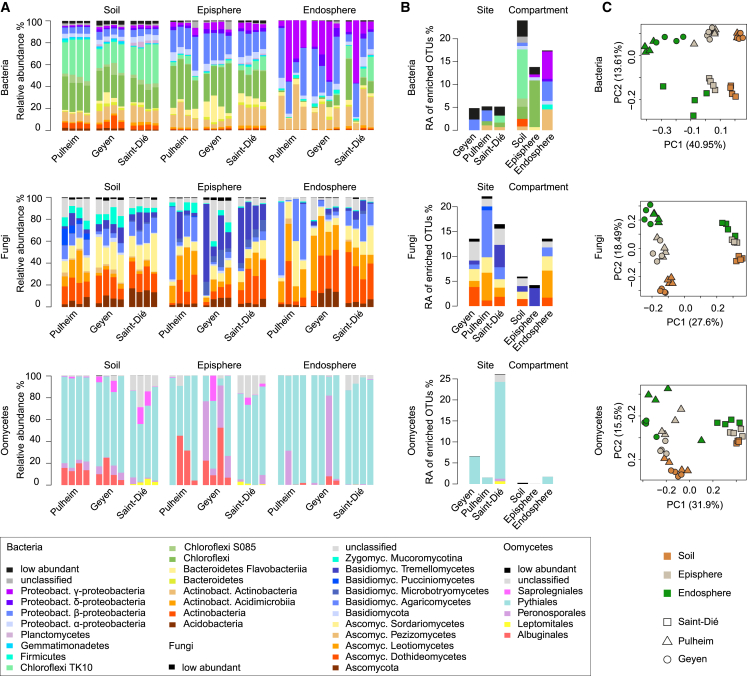
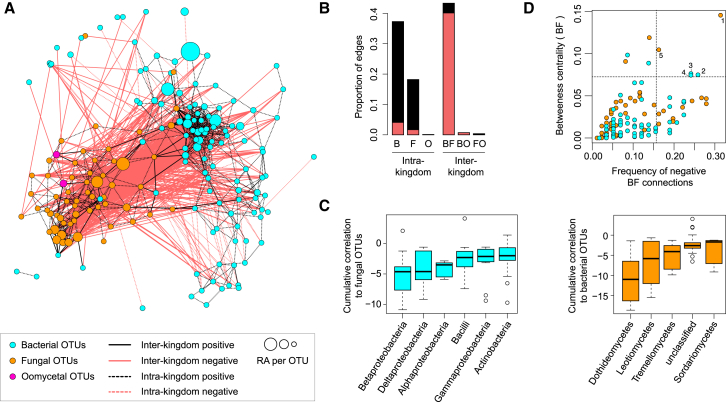
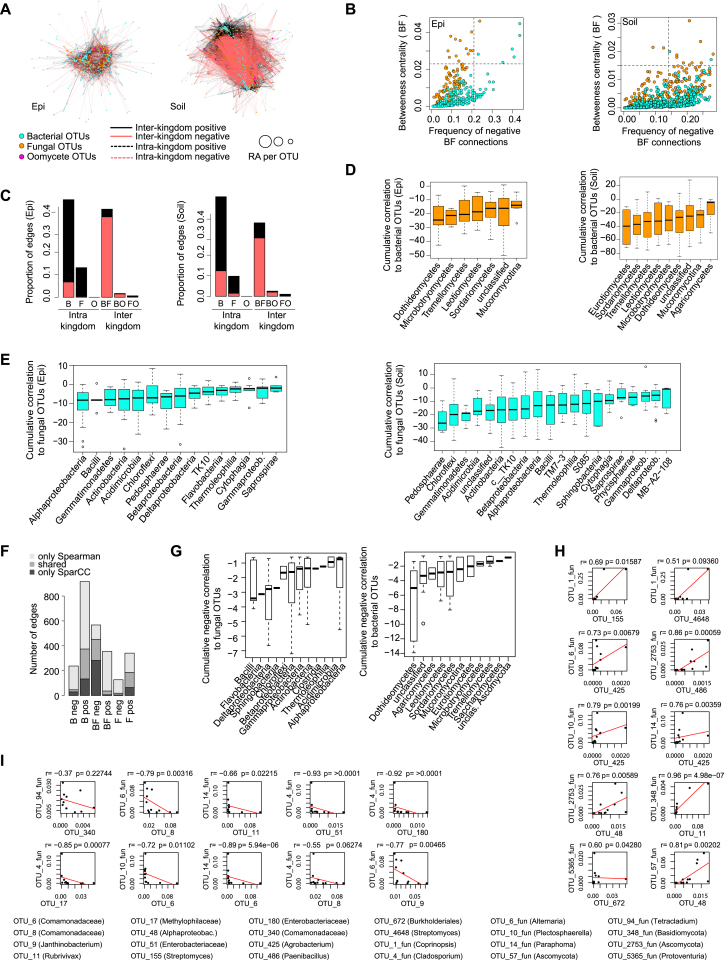
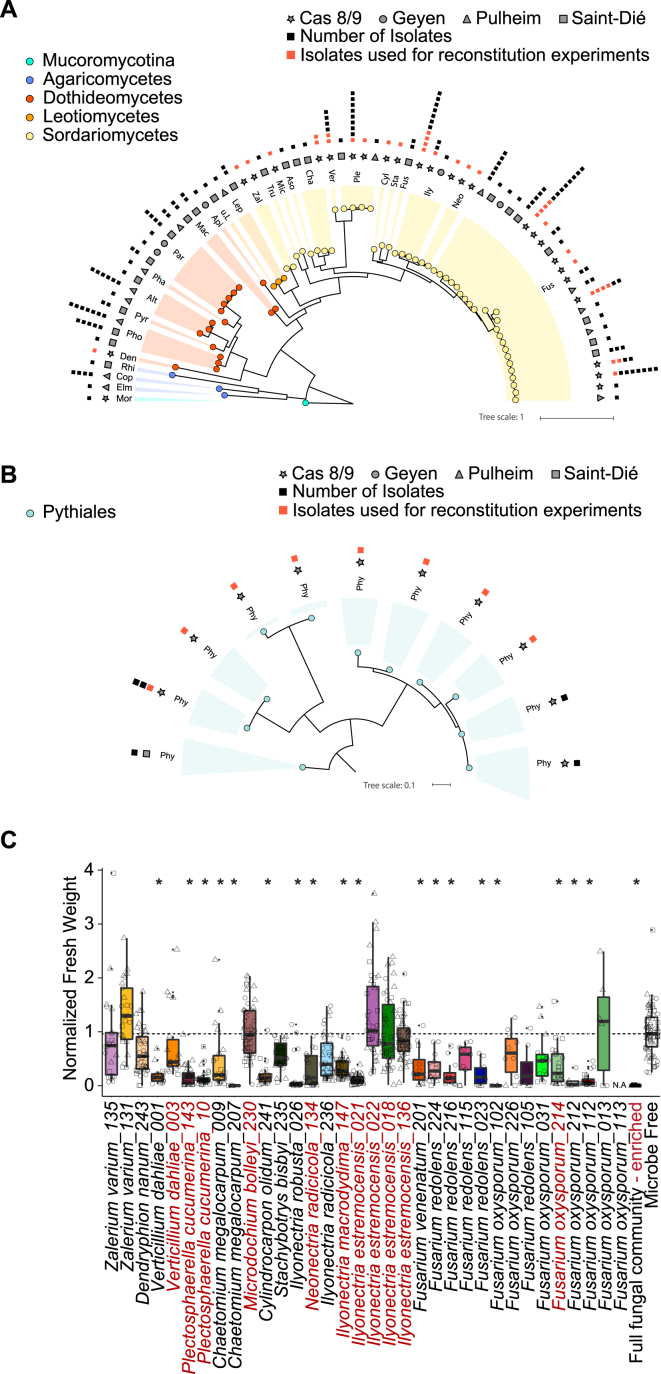
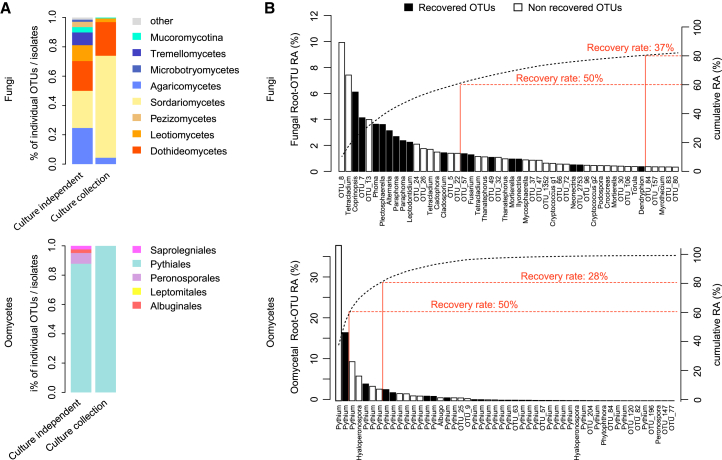
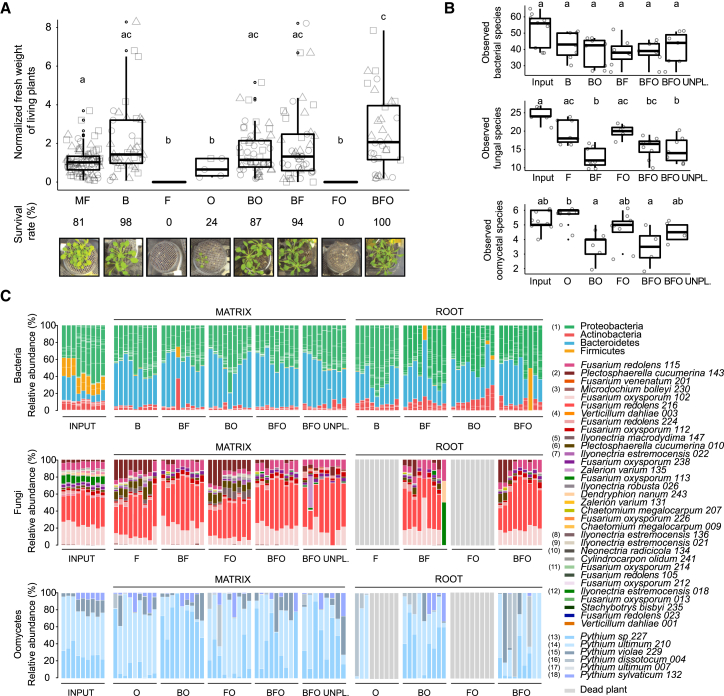
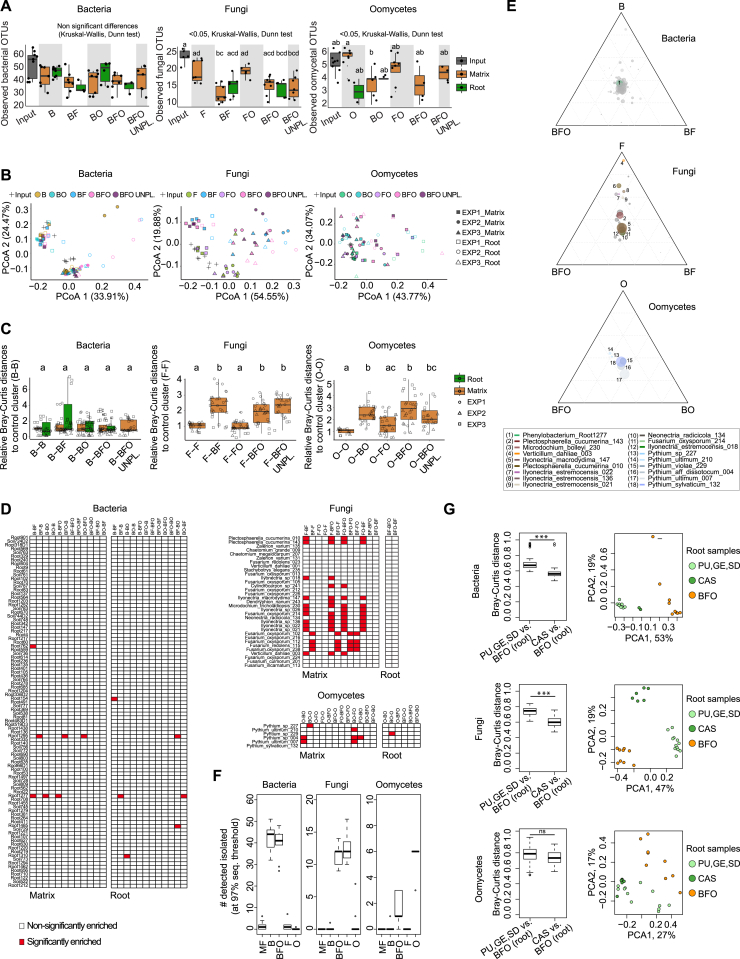
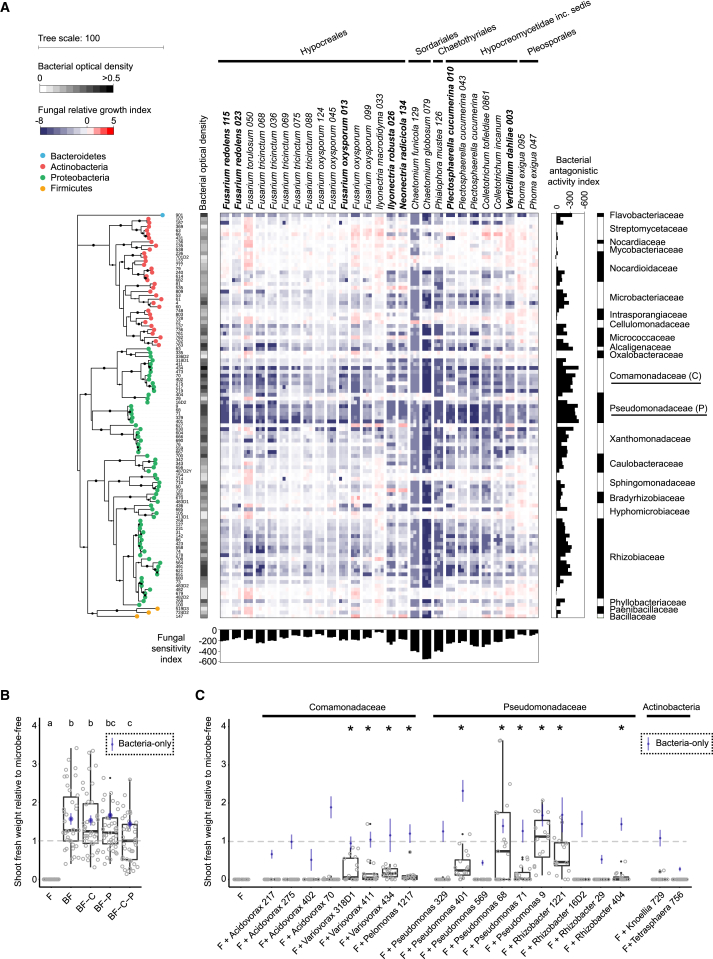
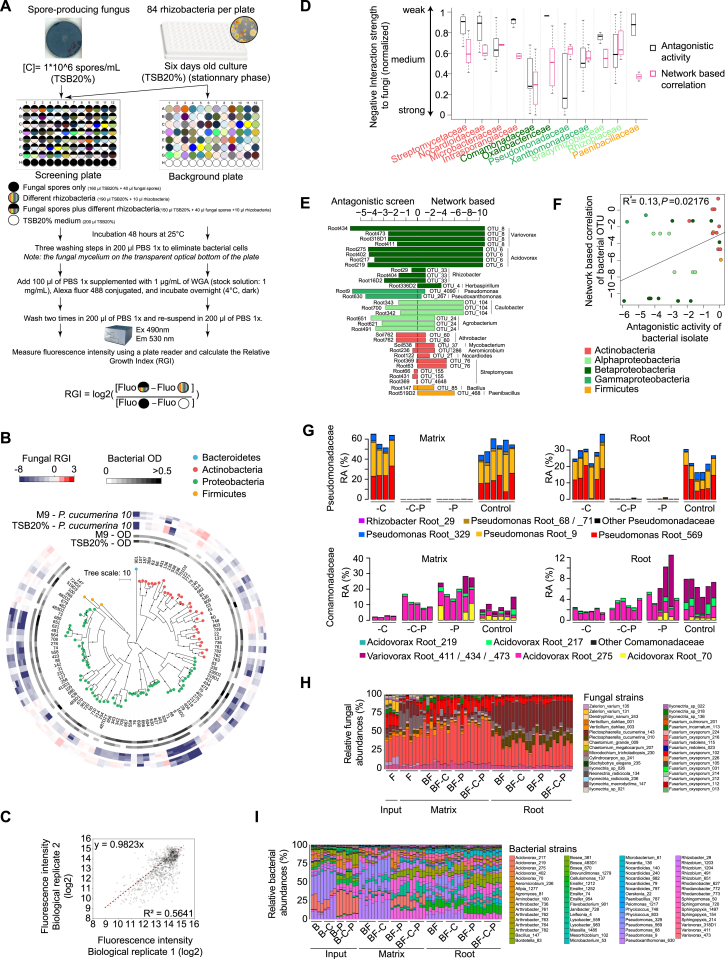
Roots of healthy plants are inhabited by soil-derived bacteria, fungi, and oomycetes that have evolved independently in distinct kingdoms of life. How these microorganisms interact and to what extent those interactions affect plant health are poorly understood. We examined root-associated microbial communities from three Arabidopsis thaliana populations and detected mostly negative correlations between bacteria and filamentous microbial eukaryotes. We established microbial culture collections for reconstitution experiments using germ-free A. thaliana. In plants inoculated with mono- or multi-kingdom synthetic microbial consortia, we observed a profound impact of the bacterial root microbiota on fungal and oomycetal community structure and diversity. We demonstrate that the bacterial microbiota is essential for plant survival and protection against root-derived filamentous eukaryotes. Deconvolution of 2,862 binary bacterial-fungal interactions ex situ, combined with community perturbation experiments in planta, indicate that biocontrol activity of bacterial root commensals is a redundant trait that maintains microbial interkingdom balance for plant health.

Keywords: bacteria; fungi; microbe-microbe interactions; oomycetes; plant microbiota; synthetic microbial communities.


Figures

None
Graphical abstract
Figure S1
Figure S1
Microbial Community Profiling in Natural A. thaliana Populations, Related to Figure 1 (A) Location of the three natural A. thaliana populations and plant developmental stages. The sites include two geographically-related populations in Geyen and Pulheim (Germany) and a more distant population in Saint-Dié (France). All plants were harvested in spring 2014 at the flowering stage. (B) Fractionation protocol. For each biological replicate (n = 4), four plant individuals were dug out from their natural habitats and samples were fractionated into soil, root episphere and root endosphere compartments. (C) Microbial alpha diversity across sites and compartments. Boxplots for the Shannon index (top), Chao index (middle) and Observed OTUs (bottom). For each of the three indices, all samples from a given site are taken into account (rarefied to 1,000 reads). Individual data points within each box correspond to samples from the three natural sites (circles = Geyen, triangles = Pulheim, squares = Saint-Dié). ns = not significant,  = p < 0.01, ∗∗ = p < 0.001, ∗∗∗ = p < 0.0001 (Kruskal-Wallis test). (D) Microbial co-occurrence networks across sites and compartments. Networks showing microbial OTU co-occurrence patterns across compartments and sites for individual microbial groups. Spearman correlation-based networks are shown. Microbial OTUs with > 200 reads and that were present in at least two samples were considered. Only edges with a correlation score > 0.6 are shown (p < 0.05, Bonferroni corrected). For each microbial OTU, the compartmental (upper part) and locational (lower part) affiliation is indicated (> 50% reads coming from one or a combination of two compartments or sites, respectively). (E) Internode mixing for each microbial network. For each microbial network (left: bacteria, middle: fungi, right: oomycetes), the amount of internode mixing is plotted considering the compartmental or locational affiliation of each OTU.
Figure 1
Figure 1
Microbial Community Structure in Three Natural A. thaliana Populations (A) Relative abundance (RA) of bacterial, fungal, and oomycetal taxa in soil, root episphere, and root endosphere compartments in three sites (Pulheim and Geyen in Germany and Saint-Dié in France). The taxonomic assignment is based on the Ribosomal Database Project (RDP) using a bootstrap cutoff of 0.5. Low-abundance taxonomic groups with less than 0.5% of total reads across all samples are highlighted in black. Each technical replicate comprised a pool of four plants. (B) RA of OTUs significantly enriched in a specific site or compartment. A generalized linear model was used to compare OTU abundance profiles in one site or compartment versus the other two sites or compartments, respectively (p < 0.05, false discovery rate [FDR] corrected). The RAs for these OTUs were aggregated at the class level. (C) Community structure of bacteria, fungi, and oomycetes in the 36 samples was determined using principal-component analysis. The first two dimensions of a principal-component analysis are plotted based on Bray-Curtis distances. Samples are color coded according to the compartment, and sites are depicted with different symbols. See also Figure S1 and Tables S1 and S2.
Figure 2
Figure 2
Microbial Network of the A. thaliana Root Endosphere Microbiota (A) Correlation-based network of root-associated microbial OTUs detected in three natural A. thaliana populations (Pulheim, Geyen, and Saint-Dié) in the endosphere. Each node corresponds to an OTU, and edges between nodes correspond to either positive (black) or negative (red) correlations inferred from OTU abundance profiles using the SparCC method (pseudo p < 0.05, correlation values < −0.6 or > 0.6). OTUs belonging to different microbial kingdoms have distinct color codes, and node size reflects their RA in the root endosphere compartment. Intrakingdom correlations are represented with dotted lines and interkingdom correlations by solid lines. (B) Proportion of edges showing positive (black) or negative (red) correlations in the microbial root endosphere network. B, bacteria; F, fungi; O, oomycetes. (C) Cumulative correlation scores measured in the microbial network between bacterial and fungal OTUs. Bacterial (left) and fungal (right) OTUs were grouped at the class level (>five OTUs per class) and sorted according to their cumulative correlation scores with fungal and bacterial OTUs, respectively. (D) Hub properties of negatively correlated bacterial and fungal OTUs. For each fungal and bacterial OTU, the frequency of negative interkingdom connections is plotted against the betweenness centrality inferred from all negative BF connections (cases in which a node lies on the shortest path between all pairs of other nodes). The five microbial OTUs that show a high frequency of negative interkingdom connections and betweenness centrality scores represent hubs of the “antagonistic” network and are highlighted with numbers: (1) Davidiella, (2) Variovorax, (3) Kineosporia, (4) Acidovorax, and (5) Alternaria. See also Figure S2 and Tables S1 and S2.
Figure S2
Figure S2
Microbial Networks of Soil and A. thaliana Episphere Microbiota, Related to Figure 2 (A) Correlation-based network of microbial episphere-associated (left) and soil-associated (right) OTUs detected in three natural A. thaliana populations (Pulheim, Geyen, Saint-Dié). Each node corresponds to a microbial OTU and edges between nodes correspond to either positive (black) or negative (red) correlations inferred from OTU abundance profiles using the SparCC method (pseudo p-value > 0.05, correlation values < -0.6 or > 0.6). OTUs belonging to the different microbial kingdoms have distinct color codes and node size reflects their relative abundance in the episphere compartment. Intra-kingdom correlations are represented with dotted lines and inter-kingdom correlations by solid lines. (B) Hub properties of negatively correlated bacterial and fungal OTUs in the episphere (left) and soil (right) networks. For each fungal and bacterial OTU, the frequency of negative inter-kingdom connections is plotted against the betweenness centrality inferred from all negative BF connections (cases in which a node lies on the shortest path between all pairs of other nodes). (C) Proportion of edges showing positive (black) or negative (red) correlations in the microbial episphere (left) and soil (right) networks. B: bacteria, F: fungi, O: oomycetes. (D) Cumulative correlation scores measured in the microbial episphere (left) and soil (right) networks between fungal and bacterial OTUs. Fungal OTUs were grouped at the class level (> five OTUs/class) and sorted according to their cumulative correlation scores with bacterial OTUs. (E) Cumulative correlation scores measured in the microbial episphere (left) and soil (right) networks between bacterial and fungal OTUs. Bacterial OTUs were grouped at the class level (> five OTUs/class) and sorted according to their cumulative correlation scores with fungal OTUs. (F-I) Validation of SparCC-defined (anti-)correlated OTUs using Spearman correlation. (F) Number of edges that are either unique to one of the two networks or shared by the two (B = connections between bacterial OTUs, F = connections between fungal OTUs, BF = connections between fungal and bacterial OTUs, pos = positively correlated connections, neg = negatively correlated connections). (G) Cumulative negative correlations across taxonomic groups inferred by Spearman correlation. (H) The ten most positively correlated OTUs from the sparCC network and the corresponding correlation inferred by Spearman correlation based on the relative abundance of the OTUs. (I) The ten most negatively correlated OTUs from the sparCC network and the corresponding correlation inferred by Spearman correlation based on the relative abundance of the OTUs.
Figure S3
Figure S3
Phylogenetic Diversity of Fungal and Oomycetal Culture Collections and Fungal Effect on Plant Growth, Related to Figure 3 (A) Maximum likelihood trees of Sanger-sequenced fungal ITS sequences for all isolates that show non identical ITS or that originate from different sites. Fungal isolates (Mor = Mortierella, Elm = Elmerina, Cop = Coprinopsis, Rhi = Rhizoctonia, Den = Dendryphion, Pho = Phoma, Pyr = Pyrenochaeta, Alt = Alternaria, Pha = Phaseolina, Par = Paraphoma, Mac = Macrophomina, Api = Apiosporina, u.L. = unclassified Leotiomycete, Lep = Leptodontidium, Zal = Zalerion, Tru = Truncatella, Mic = Microdochium, Aso = Asordaria, Cha = Chaetomium, Ver = Verticillium, Ple = Plectosphaerella, Cyl = Cylindrocarpon, Sta = Stachybotrys, Fus = Fusarium, Ily = Ilyonectria, Neo = Neonectria). The first outer ring indicates the origin of each isolate, the second ring shows the number of isolates with 100% sequence identity that were isolated from the same site, therefore representing clonal duplicates. Isolates that were used in the reconstitution experiments are highlighted with red squares. (B) Maximum likelihood trees of Sanger-sequenced oomycetal ITS sequences for all isolates that show non identical ITS or that originate from different sites. Oomycetal isolates (Phy = Phytium). The first outer ring indicates the origin of each isolate, the second ring shows the number of isolates with 100% sequence identity that were isolated from the same site, therefore representing clonal duplicates. Isolates that were used in the reconstitution experiments are highlighted with red squares. (C) Effect of individual fungal isolates on A. thaliana growth in the FlowPot system. The boxplots depict normalized fresh weight of A. thaliana Col-0 plant shoots after three weeks of incubation with each of the 34 fungal strains used in the multi-kingdom microbiota reconstitution experiment (see Figure 4). For each boxplot, three biological replicates (depicted with different shapes) with at least three technical replicates are presented. Significant differences are indicated with an asterisk (p < 0.01, Kruskal-Wallis with Dunn’s post hoc test). The 11 fungal strains enriched in the absence of bacteria (depicted in Figure S4E) are highlighted in red and a 23-member fungal community lacking these 11 isolates remains deleterious for plant growth (fungal community-enriched). N.A.: data not available
Figure 3
Figure 3
Recovery Rates and Taxonomic Representation of Root-Derived Fungal and Oomycetal Culture Collections (A) Comparison of fungal (upper panel) and oomycetal (lower panel) taxonomic composition between culture-dependent and culture-independent methods. Culture collection: taxonomic composition (class level) of the 69 fungal and 11 oomycetal strains isolated from plant roots grown in the CAS and the three natural sites Pulheim, Geyen, and Saint-Dié (Figures S3A and S3B). Culture-independent approach: taxonomic composition of fungal and oomycetal root-associated OTUs (>0.1% RA in at least one site, RDP bootstrap at class level ≥ 0.8) detected in the roots of A. thaliana grown in the same soils used for the culture-dependent approach. (B) Recovery rates of fungal (upper panel) and oomycetal (lower panel) isolates from the culture collections at different thresholds. The rank abundance plots show the 50 most abundant root-associated fungal and oomycetal OTUs from A. thaliana grown in the above-mentioned soil types together with their cumulative RA. OTUs that have a representative isolate in the culture collections (97% sequence similarity) are highlighted with black bars. The percentages of naturally occurring OTUs recovered as pure cultures are given for OTUs representing 60% and 80% of the total read counts. See also Figure S3 and Table S3.
Figure 4
Figure 4
Multi-kingdom Reconstitution of the A. thaliana Root Microbiota (A) Recolonization of germ-free plants with root-derived bacterial (148), fungal (34), and oomycetal (8) isolates in the FlowPot system. Shoot fresh weight of four-week-old A. thaliana Col-0 inoculated with bacteria (“B”), fungi (“F”); oomycetes (“O”); bacteria and oomycetes (“BO”); bacteria and fungi (“BF”); fungi and oomycetes (“FO”); and bacteria, fungi, and oomycetes (“BFO”). MF, microbe-free/control. Shoot fresh weight values were normalized to MF. Significant differences are depicted with letters (p < 0.05, Kruskal-Wallis with Dunn’s post hoc test). Survival rate values represent the percentage of germinated plants that survived. Data are from three biological replicates (represented by different shapes) with three technical replicates each. (B) Observed species per microbial group in matrix samples for each of the above-mentioned inoculations (p < 0.05, Kruskal Wallis with Dunn’s post hoc test). Input, initial microbial inoculum; UNPL, unplanted matrix. (C) RAs of microbial isolates in initial input and output matrix and root samples after 4 weeks. Taxonomic assignment is shown at the phylum level for bacteria and at the species level for fungi and oomycetes. Numbers in brackets refer to bacterial, fungal, and oomycetal strains specifically enriched in matrix samples in either B, BF, or BFO conditions; F, BF, or BFO conditions; or O, BO, or BFO conditions, as depicted in Figure S4E. See also Figure S4 and Tables S2, S3, and S4.
Figure S4
Figure S4
Multi-kingdom Microbiota Reconstitution Experiments in the FlowPot System, Related to Figure 4 (A) Microbial alpha diversity in matrix and root compartments in a multi-kingdom microbiota reconstitution system. Germ-free plants were re-colonized with root-derived bacterial (148), fungal (34) and oomycetal (8) isolates in the FlowPot system and matrix and root compartments were harvested after four weeks. Observed bacterial (upper panel), fungal (middle panel) and oomycetal (lower panel) OTUs in matrix (brown) and root (green) samples, as well as in the corresponding microbial input communities inoculated in the FlowPot system at T0 (gray) (p < 0.05, Kruskal-Wallis with Dunn’s post hoc test). Data points are missing for several root samples due to the absence of living plants in the corresponding treatment. B: bacteria, F: fungi, O: oomycetes, UNPL: unplanted pots. Note the significant decrease in observed fungal and oomycetal OTUs in the presence versus absence of bacteria. (B) Microbial community structure in matrix and root compartments in the FlowPot system four weeks after inoculation. PCoA plots of bacterial, fungal and oomycetal profiles (from left to right); shapes represent three biological replicates and colors depict different microbial combinations. B: bacteria, F: fungi, O: oomycetes, UNPL: unplanted pots. (C) Relative Bray-Curtis distances between sample clusters of bacterial, fungal and oomycete profiles (from left to right) of matrix (brown) and root (green samples) to the control clusters (B-B, F-F and O-O) (i.e., the closer to 1, the more similar to the control cluster; see STAR Methods). Significant differences are depicted with different letters (Kruskal-Wallis with Dunn’s post hoc test, < 0.05). (D) Effect of co-inoculation on microbial strain enrichment. Pairwise-enrichment tests for bacterial, fungal and oomycetal strains in gnotobiotic experiments (Generalized Linear Model, p.adj.method = FDR, p value < 0.05) co-inoculated in different combinations (B: bacteria, F: fungi, O: oomycetes). Enriched strains in one combination compared to another one are depicted with a red block (e.g., Root762 is enriched in B compared to BF). (E) Ternary plots representing the enriched strains (colored circles) (Generalized linear model, p.adj.method = FDR < 0.05) in each combination versus the other two combined. The size of the circles indicates the relative abundance of each strain and the closeness to each edge signifies a higher prevalence in that given condition. (F) Number of detected bacterial, fungal or oomycetal isolates in microbe-free (MF), B, BFO, F, and O matrix samples (reference sequences mapped at 97% sequence identity). (G) Comparison of the abundance of root-associated microbial communities derived from natural sites and synthetic communities. Left: Bray-Curtis distances between root samples from synthetic communities (BFO) of the reconstitution experiment (see Figure 4) and root samples from the natural sites (PU, GE, SD) or from plants grown in the Cologne Agricultural Soil (CAS, used to establish the microbial culture collections). Kruskal-Wallis test, ns = not significant, p < 0.01, ∗∗p < 0,001, ∗∗∗p < 0.0001. Right: Beta diversity determined using principal component analysis of the aforementioned root samples. Only the 100 most abundant root-associated OTUs found in the three natural sites and in CAS samples were considered for calculation of distances between samples.
Figure 5
Figure 5
Inhibitory Activities of Bacterial Root Microbiota Members toward Root-Associated Fungi (A) Alteration of fungal growth upon interaction with phylogenetically diverse bacterial root commensals. The heatmap depicts the log2 fungal relativegrowth index (presence versus absence of bacterial competitors) measured by fluorescence using a chitin binding assay with wheat germ agglutinin (WGA), Alexa Fluor 488 conjugate. The phylogenetic tree was constructed based on the full bacterial 16S rRNA gene sequences, and bootstrapvalues aredepicted with black circles. Vertical and horizontal barplots indicate the cumulative antagonistic activity for each bacterial strain andthe cumulativesensitivity score for each fungal isolate, respectively. Alternating white and black colors are used to distinguish the bacterial families.All bacteria presented and 7/27 fungi (highlighted in bold) were used for the above-mentioned multi-kingdom reconstitution experiment (see Figure4). (B) Shoot fresh weight of plants inoculated with fungi only (F) or bacteria plus fungi (BF, BF-C, BF-P, BF-C-P) relative to microbe-free control plants. -C, withdrawal of Comamonadaceae strains; -P, withdrawal of Pseudomonadaceae strains. Significant differences are depicted with letters (Kruskal-Wallis with Dunn’s post hoc test, p < 0.05). Relative shoot fresh weight of control plants inoculated with bacteria only is indicated for each strain (blue vertical lines; standard error, n = 8). Dashed gray horizontal line indicates shoot fresh weight of microbe-free plants normalized to 1. (C) Same experiment as in (B), but instead of removing bacterial strains, individual bacterial isolates were co-inoculated with the 34-member fungal community (F) to determine their capacity for plant growth rescue. See also Figure S5 and Table S5.
Figure S5
Figure S5
High-Throughput Fungal-Bacterial Interaction Screen and Biocontrol Activities of Bacterial Root Commensals, Related to Figure 5 (A) Schematic overview of the experimental protocol. Fungal spores were equally distributed to the wells of a transparent-bottom 96 well plate and incubated in the presence or absence of different root-derived bacteria (stationary phase) in liquid medium (screening plate). Bacteria were also grown in the absence of fungal spores as a control (background plate). After 48 hours of interaction, three washing steps were used to eliminate bacterial cells in suspension. Note that the fungal mycelium sticks to the transparent optical bottom of the plate. After overnight incubation in Wheat Germ Agglutinin and two additional washes, the fluorescence intensity (reflecting fungal growth) was measured using a plate reader. The relative growth index was calculated as illustrated (see STAR Methods). (B) Alteration of the growth of Plectosphaerella cucumerina isolate 10 upon competition with phylogenetically diverse members of the bacterial root microbiota in minimum medium (M9) and a carbon-rich medium (20% TSB). The phylogenetic tree was constructed based on the full bacterial 16S rRNA gene sequences and bootstrap values are depicted with black circles. The heatmap depicts the log2 fungal relative growth index (presence versus absence of bacterial competitors) measured by fluorescence (see above). Note the similar overall inhibitory activities in minimum and complex media. (C) Validation experiment, in which the bacterial strains were re-screened against ten randomly-selected fungi. Fluorescence intensities (log2) were compared with those obtained from the first biological replicate. (D) Comparison of network-derived correlations and experimentally tested interactions of bacterial families with fungal species. For each bacterial family shared between antagonistic screening and root-associated OTU network analysis, the average antagonistic activity against fungal isolates and the cumulative correlation to fungal OTUs in the network are represented. Bacterial families with more than two members were considered and values for both measurements were normalized to be in the same range. (E) Direct comparison of bacterial OTUs from the root network with bacterial isolates used in the antagonistic screening. Each data point corresponds to a bacterial OTU-isolate pair (> 97% sequence similarity; only best matching hits are shown). For each pair, the network-derived correlation with fungal OTUs (from the bacterial OTU) is plotted against the result from the antagonistic screening (from the bacterial isolates). (F) Same as E) but data are presented in a correlation plot. (G) Validation of withdrawal of a subset of bacterial strains in the FlowPot microbiota reconstitution system. Relative abundances of isolates of the Pseudomonadaceae (top) and the Comamonadaceae (bottom) families in output matrix and root samples four weeks after inoculation (direct mapping at 100% sequence similarity). RA: Relative abundance. -C: withdrawal of ten Comamonadaceae strains, -P: withdrawal of eight Pseudomonadaceae strains. -C-P removal of 18 Comamonadaceae plus Pseudomonadaceae strains. Control samples were inoculated with the full 148-member bacterial community. Note that one Acidovorax strain (Acidovorax 275) was unintentionally not removed from the -C depleted samples. This Acidovorax strain is unable to rescue plant growth in the presence of the fungal community (see Figure 5C). (H and I) Relative abundance of (H) fungal isolates and (I) bacterial isolates (direct mapping at 100% sequence similarity) is presented for all conditions. B: full 148-member bacterial community. F: 34-member fungal community. -C: depletion of Comamonadaceae isolates. -P: depletion of Pseudomonadaceae isolates. -C-P: depletion of Comamonadaceae and Pseudomonadaceae isolates.

References

    1. Agler M.T., Ruhe J., Kroll S., Morhenn C., Kim S.T., Weigel D., Kemen E.M. Microbial Hub Taxa Link Host and Abiotic Factors to Plant Microbiome Variation. PLoS Biol. 2016;14:e1002352. - PMC - PubMed
    1. Almario J., Jeena G., Wunder J., Langen G., Zuccaro A., Coupland G., Bucher M. Root-associated fungal microbiota of nonmycorrhizal Arabis alpina and its contribution to plant phosphorus nutrition. Proc. Natl. Acad. Sci. USA. 2017;114:E9403–E9412. - PMC - PubMed
    1. Bai Y., Müller D.B., Srinivas G., Garrido-Oter R., Potthoff E., Rott M., Dombrowski N., Münch P.C., Spaepen S., Remus-Emsermann M. Functional overlap of the Arabidopsis leaf and root microbiota. Nature. 2015;528:364–369. - PubMed
    1. Bengtsson-Palme J., Ryberg M., Hartmann M., Branco S., Wang Z., Godhe A., De Wit P., Sanchez-Garcia M., Ebersberger I., de Sousa F. Improved software detection and extraction of ITS1 and ITS2 from ribosomal ITS sequences of fungi and other eukaryotes for analysis of environmental sequencing data. Methods Ecol. Evol. 2013;4:914–919.
    1. Boc A., Diallo A.B., Makarenkov V. T-REX: a web server for inferring, validating and visualizing phylogenetic trees and networks. Nucleic Acids Res. 2012;40 W573–W579. - PMC - PubMed

Publication types